
Market Overview
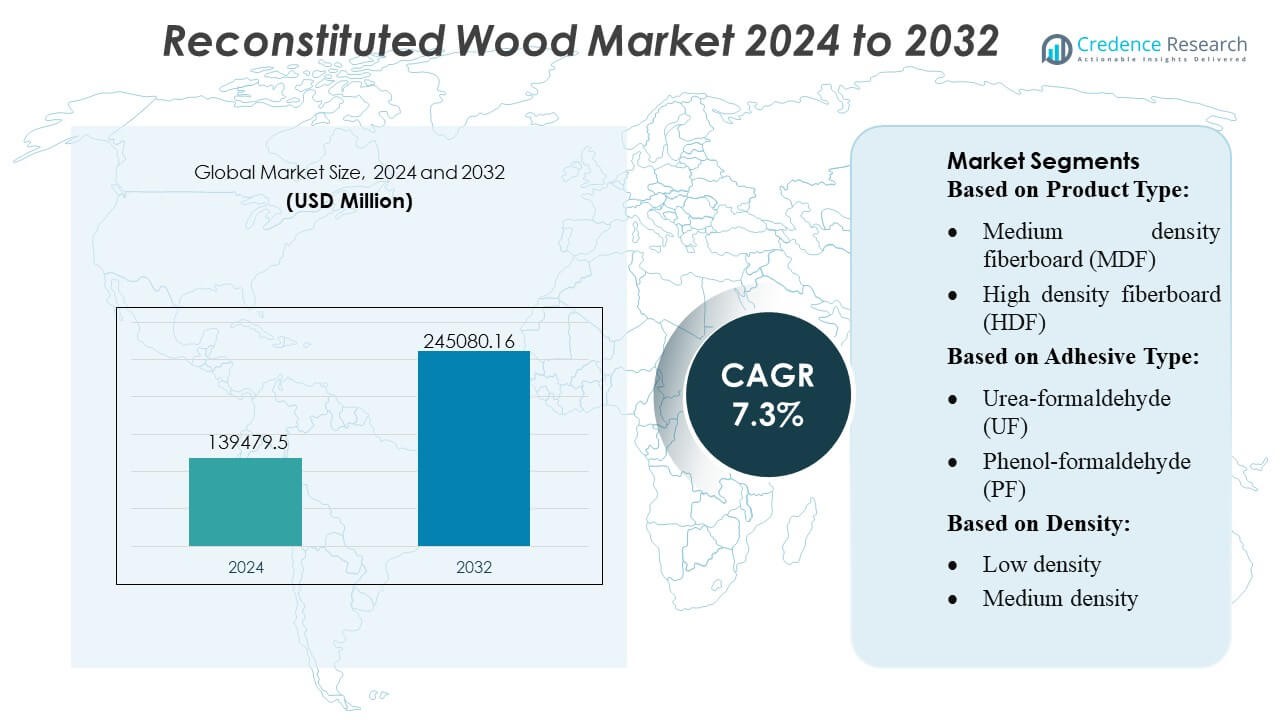
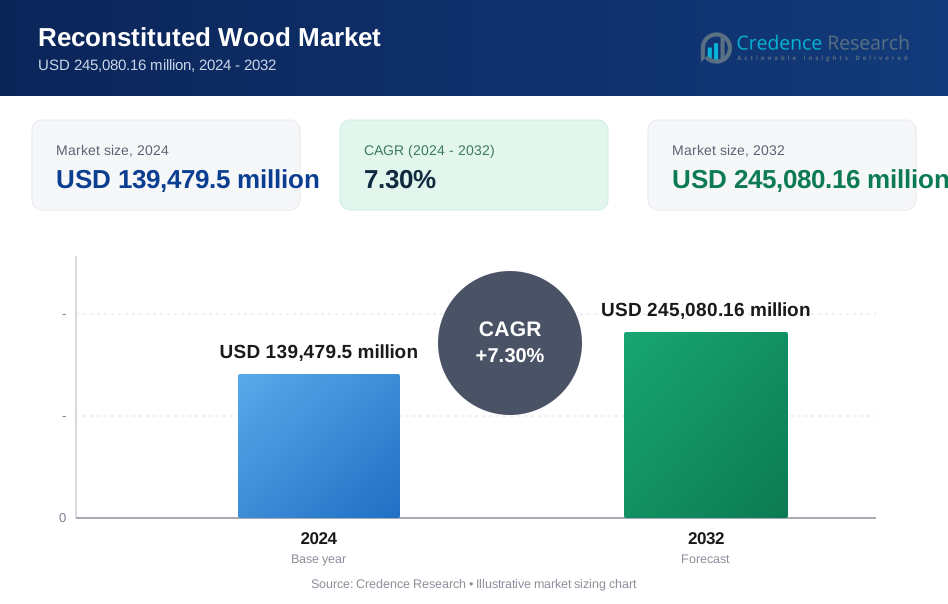
Reconstituted Wood Market size was valued USD 139479.5 million in 2024 and is anticipated to reach USD 245080.16 million by 2032, at a CAGR of 7.3% during the forecast period.
| REPORT ATTRIBUTE | DETAILS |
|---|---|
| Historical Period | 2020-2023 |
| Base Year | 2024 |
| Forecast Period | 2025-2032 |
| Reconstituted Wood Market Size 2024 | USD 139479.5 Million |
| Reconstituted Wood Market, CAGR | 7.3% |
| Reconstituted Wood Market Size 2032 | USD 245080.16 Million |
The reconstituted wood market is shaped by a diverse group of manufacturers that compete through advancements in engineered panels, sustainable sourcing practices, and high-precision processing technologies. Leading companies focus on expanding production capacity, optimizing adhesive systems, and supplying consistent, high-performance materials to construction, furniture, and interior design industries. Competitive strategies increasingly emphasize low-emission products, digitalized manufacturing, and customization capabilities to meet evolving regulatory and architectural requirements. Asia-Pacific leads the global market with an exact 38% share, supported by rapid urban development, strong furniture export activity, and large-scale manufacturing clusters that enable cost-effective and high-volume panel production.
Market Insights
- The Reconstituted Wood Market was valued at USD 139,479.5 million in 2024 and is projected to reach USD 245,080.16 million by 2032, registering a 7.3% CAGR during the forecast period.
- Demand grows as engineered panels gain preference in construction and furniture manufacturing, supported by sustainable sourcing practices and advancements in low-emission adhesive technologies.
- Market trends highlight rapid adoption of digitalized manufacturing, rising use of bio-based adhesives, and expanding production of MDF and OSB, with MDF retaining a dominant share due to its versatility.
- Competitive intensity increases as manufacturers enhance capacity, optimize processing efficiency, and focus on delivering high-performance, customizable panel solutions while addressing emission compliance challenges.
- Asia-Pacific leads with 38% share, followed by North America and Europe, supported by strong manufacturing clusters; segment-wise, MDF holds the largest share, driven by consistent demand in interior applications.
Market Segmentation Analysis:
By Product Type
Particleboard dominates the reconstituted wood market with an estimated 32–34% share, supported by its cost efficiency, wide availability, and suitability for furniture, cabinetry, and interior construction. Its strong adoption in ready-to-assemble furnishings and modular housing drives consistent demand. MDF follows closely, benefitting from superior surface finish and compatibility with laminates and veneers. OSB and plywood maintain strong usage in structural applications, while CLT and LVL gain traction in mass-timber construction due to rising interest in low-carbon building materials and improved dimensional stability across multi-story projects.
- For instance, Honeywell’s HPM Series PM2.5 sensor delivers a detection range up to 1,000 µg/m³. The sensor provides high accuracy of ±15% (for PM2.5 concentrations over 100 µg/m³ or ±15 µg/m³ for concentrations of 0 to 100 µg/m³) and is engineered for a life of up to 10 years of intermittent use (approximately 20,000 hours of continuous use).
By Adhesive Type
Urea-formaldehyde (UF) adhesives hold the leading position with an estimated 40–42% share, driven by their low cost, fast cure time, and widespread use in particleboard and MDF manufacturing. Their strong bonding performance in interior-grade products ensures continued dominance across large-volume applications. MDI adhesives report rising adoption in OSB and engineered structural panels due to higher moisture resistance and superior mechanical strength. Bio-based adhesives gain momentum as sustainability mandates strengthen, prompting manufacturers to invest in formaldehyde-free chemistries for premium and environmentally compliant panel products.
- For instance, Haier's U+ Smart Life Platform supports integrations with more than 20,000 IoT device models and connects with over 1,000 certified service partners, facilitating the incorporation of smart furniture into new construction environments.
By Density
Medium-density products account for the largest market share at approximately 45–47%, supported by their balanced strength-to-weight properties that meet requirements for furniture, interior paneling, and non-structural construction applications. Manufacturers favor this category due to its versatility in machining, surface finishing, and lamination performance. High-density variants gain demand in flooring substrates, industrial packaging, and heavy-duty panels that require enhanced load-bearing capability. Low-density boards continue to serve niche applications such as insulation cores and lightweight furnishings, though their growth remains slower due to limited structural suitability.
Key Growth Drivers
- Expanding Construction and Furniture Manufacturing
Growth in residential and commercial construction significantly boosts demand for reconstituted wood, driven by the material’s uniformity, cost efficiency, and design versatility. Manufacturers increasingly adopt MDF, particleboard, and OSB as substitutes for solid wood to support scalable production in furniture, cabinetry, and interior applications. Rising urbanization and rapid infrastructure development in Asia-Pacific strengthen uptake, while engineered wood’s favorable mechanical properties and dimensional stability enhance its suitability for high-volume manufacturing environments across global markets.
- For instance, Martela reported refurbishing and reselling approximately 23,700 pieces of used furniture through its Martela Outlet chain in 2023, integrating circular economy principles into its indoor offering.
- Rising Preference for Sustainable and Engineered Wood Alternatives
Heightened sustainability commitments encourage industries to shift toward wood-based panels that optimize raw material usage and minimize environmental waste. Reconstituted wood supports circularity by utilizing chips, fibers, and veneers that would otherwise be discarded, aligning well with green building certifications. Demand strengthens further as regulatory pressures limit deforestation and promote low-emission, formaldehyde-compliant adhesives. The market benefits from the growing emphasis on renewable materials and improved resource efficiency across construction, packaging, and furniture value chains.
- For instance, Natuzzi initiated and executed the "Factory 4.0" program, initially in one pilot factory in Italy, with plans to extend it to other plants globally.
- Advances in Resin Technology and Manufacturing Processes
Innovations in resin chemistry, including low-VOC adhesives, MDI binders, and bio-based formulations, enhance panel strength, moisture resistance, and thermal stability. These developments expand application potential in flooring, structural panels, and high-performance interiors. Automated pressing, precision fiber refining, and continuous production lines improve throughput and consistency, enabling manufacturers to deliver higher-grade panels at competitive costs. The evolution of digital quality monitoring and optimized curing systems further reinforces product reliability and drives adoption in high-specification industries.
Key Trends & Opportunities
1. Growing Penetration of Mass Timber and Prefabricated Construction
The rise of modular and prefabricated building systems creates new opportunities for CLT, LVL, and OSB due to their high load-bearing capacity, ease of fabrication, and reduced construction timelines. Mass timber’s ability to lower carbon footprints positions it as a core component in modern sustainable architecture. As governments promote green infrastructure and low-carbon materials, adoption accelerates across mid-rise buildings, educational facilities, and commercial structures, opening significant opportunities for engineered wood panel producers.
- For instance, La-Z-Boy did launch a next-generation 3D product configurator and "WebAR OnDemand™" platform that supports over 29 million distinct furniture configurations, and this switch to web-based augmented reality (AR) resulted in a 150% increase in AR session usage compared to the prior app-based version.
2. Increasing Use of Bio-Based Adhesives and Low-Emission Products
Regulatory pressures on formaldehyde emissions encourage rapid adoption of eco-friendly binders and E0/E1-compliant panels. Bio-based adhesives derived from lignin, tannin, soy, or starch gain traction as manufacturers seek sustainable alternatives without compromising strength or moisture resistance. Opportunities expand as green-certified construction, eco-conscious furniture brands, and environmentally aware consumers prioritize low-emission, recyclable materials. This trend positions eco-optimized engineered wood products as preferred choices in premium interior and architectural applications.
- For instance, Ethan Allen Interiors Inc. operates a digital interior design platform with approximately 1,500 professional designers. The platform also includes a 3D room planner and other tools that allow customers to visualize thousands of furniture and décor products.
3. Digitalization and Smart Manufacturing Advancements
Industry 4.0 technologies—such as automated defect detection, real-time moisture control, and advanced press optimization—enable producers to achieve higher yields, reduce waste, and improve quality consistency. Digital supply-chain platforms strengthen forecasting, inventory planning, and traceability for distributors and furniture OEMs. As manufacturers invest in robotics, data analytics, and AI-enhanced production systems, the sector gains efficiency advantages and opportunities to deliver customized panel formats that meet evolving customer specifications.
Key Challenges
1. Raw Material Supply Constraints and Volatile Timber Prices
Fluctuations in wood fiber availability, driven by logging restrictions, environmental regulations, and climate-related disruptions, pose significant challenges for panel manufacturers. Rising global demand for pulp, biomass, and lumber further escalates competition for raw materials, leading to cost instability. These pressures affect margins and can disrupt production schedules, particularly for producers reliant on specific wood species. Ensuring long-term fiber security and diversifying sourcing strategies remain critical to maintaining stable supply chains.
2. Emission Compliance and Technical Limitations in Certain Applications
Despite improvements, some reconstituted wood products still face challenges in meeting strict emission standards, moisture resistance requirements, and structural performance criteria in heavy-load or humidity-prone environments. Formaldehyde regulations raise production costs and require continuous formulation changes. Additionally, engineered panels may face durability limitations compared with solid wood in outdoor or high-impact applications. Manufacturers must invest in R&D to overcome technical constraints and ensure compliance with evolving global building and indoor air quality norms.
Regional Analysis
North America
North America holds a strong position in the reconstituted wood market with an estimated 32% share, supported by mature construction, remodeling, and furniture manufacturing industries. Demand rises as builders increasingly adopt MDF, OSB, and plywood for structural and interior applications due to their durability, dimensional stability, and cost efficiency. Growth is reinforced by green building certifications and continued investment in mass timber construction across the U.S. and Canada. Strong penetration of home-improvement retail, combined with robust supply chains and advanced production technologies, strengthens the region’s competitive advantage.
Europe
Europe accounts for approximately 28% of the market, driven by stringent emission regulations, high adoption of sustainable construction materials, and strong technological capabilities among engineered wood producers. Demand for MDF, particleboard, and CLT continues to rise as EU policies promote low-carbon materials, circular resource utilization, and eco-certified building practices. Germany, Austria, and Scandinavia lead CLT adoption, while Eastern Europe expands panel manufacturing capacity. Growth is further supported by advanced adhesive technologies and widespread acceptance of energy-efficient building systems, positioning Europe among the most innovation-driven markets for reconstituted wood.
Asia-Pacific
Asia-Pacific dominates the global landscape with the largest 38% market share, driven by rapid urbanization, expanding residential construction, and rising demand for cost-effective furniture in China, India, and Southeast Asia. Large-scale manufacturing, abundant raw materials, and competitive production costs fuel the region’s leadership in MDF, particleboard, and plywood output. Policy-driven infrastructure development and increasing penetration of modular construction accelerate adoption of engineered wood solutions. Growing sustainability awareness and the shift toward eco-compliant adhesives also strengthen long-term demand, making Asia-Pacific the fastest-growing region in the reconstituted wood market.
Latin America
Latin America holds an estimated 7% share, supported by growing construction activity, expanding furniture exports, and rising availability of plantation wood resources, particularly in Brazil and Chile. MDF and particleboard demand accelerates as regional manufacturers scale production to serve domestic and international furniture markets. Economic recovery, urban housing expansion, and increasing adoption of affordable interiors further boost consumption. However, market growth depends on stabilizing raw material supply chains and addressing import dependency for advanced adhesives and processing equipment. Sustainability initiatives and investments in panel manufacturing capacity enhance future regional competitiveness.
Middle East & Africa
The Middle East & Africa region accounts for approximately 5% share, with growth driven by infrastructure development, tourism-led construction, and rising adoption of engineered wood in commercial and hospitality projects. Countries such as the UAE, Saudi Arabia, and South Africa increasingly use MDF, plywood, and OSB for interiors, partitions, and modular applications due to cost efficiency and installation flexibility. Limited local manufacturing capacity results in heavy dependence on imports, influencing price dynamics. Emerging investments in wood processing facilities and rising demand for sustainable building materials create opportunities for market expansion across MEA.
Market Segmentations:
By Product Type:
- Medium density fiberboard (MDF)
- High density fiberboard (HDF)
By Adhesive Type:
- Urea-formaldehyde (UF)
- Phenol-formaldehyde (PF)
By Density:
- Low density
- Medium density
By Geography
- North America
- U.S.
- Canada
- Mexico
- Europe
- Germany
- France
- U.K.
- Italy
- Spain
- Rest of Europe
- Asia Pacific
- China
- Japan
- India
- South Korea
- South-east Asia
- Rest of Asia Pacific
- Latin America
- Brazil
- Argentina
- Rest of Latin America
- Middle East & Africa
- GCC Countries
- South Africa
- Rest of the Middle East and Africa
Competitive Landscape
The competitive landscape of the reconstituted wood market players such as TerraMai, Beam and Board, LLC, Imondi Flooring, Olde Wood Ltd., Carpentier Hardwood Solutions, NV, True American Grain Reclaimed Wood, Vintage Timberworks, Inc, Jarmak Corporation, Elemental Republic, and Trestlewood. the reconstituted wood market is defined by strong participation from manufacturers that prioritize sustainable sourcing, precision engineering, and value-added processing to meet rising demand across construction, furniture, and interior applications. Companies strengthen their market position by expanding production capacity, adopting low-emission adhesive technologies, and integrating digital quality-control systems to ensure consistent panel performance. The shift toward engineered wood in green building projects further intensifies competition, prompting investment in eco-certified products, moisture-resistant formulations, and structural-grade composites. Market participants differentiate through customized solutions, diversified product portfolios, and enhanced supply-chain reliability to serve global OEMs, builders, and architectural firms.
Key Player Analysis
- TerraMai
- Beam and Board, LLC
- Imondi Flooring
- Olde Wood Ltd.
- Carpentier Hardwood Solutions, NV
- True American Grain Reclaimed Wood
- Vintage Timberworks, Inc
- Jarmak Corporation
- Elemental Republic
- Trestlewood
Recent Developments
- In May 2025, SPAN FLOORS did introduce a new engineered wood flooring line specifically for staircases. This collection is aimed at contemporary Indian households as a safer, warmer, and more durable alternative to traditional materials like marble.
- In July 2024, JP Wood Accents made a strategic move by launching wide plank engineered wood flooring for commercial and residential markets, offering durable, high-quality solutions to meet the growing demand for premium, stylish wood floors, aligning with industry trends for expanded choices in durable, aesthetically pleasing options.
- In May 2024, Star Equity Holdings completed its acquisition of Timber Technologies for a total purchase. The acquisition strategically expands Star Equity's operations into the engineered wood products market as part of its Building Solutions division.
- In February 2024, German chemical firms Henkel and Covestro collaborate to promote sustainability in adhesives for load-bearing timber construction. Elements like Cross Laminated Timber or Glued Laminated Timber are used in many indoor and outdoor building applications, including staircases, facades, and structural components.
Report Coverage
The research report offers an in-depth analysis based on Product Type, Adhesive Type, Density and Geography. It details leading market players, providing an overview of their business, product offerings, investments, revenue streams, and key applications. Additionally, the report includes insights into the competitive environment, SWOT analysis, current market trends, as well as the primary drivers and constraints. Furthermore, it discusses various factors that have driven market expansion in recent years. The report also explores market dynamics, regulatory scenarios, and technological advancements that are shaping the industry. It assesses the impact of external factors and global economic changes on market growth. Lastly, it provides strategic recommendations for new entrants and established companies to navigate the complexities of the market.
Future Outlook
- The market will see increasing adoption of engineered wood panels in modular and prefabricated construction systems.
- Demand for low-emission and bio-based adhesive technologies will grow as global regulations tighten.
- Mass timber solutions such as CLT and LVL will gain wider acceptance in mid-rise and commercial building projects.
- Manufacturers will expand digitalized production lines to improve yield, reduce waste, and enhance product consistency.
- Sustainability certification will become a key differentiator across furniture and architectural applications.
- Asia-Pacific will continue to strengthen its leadership through large-scale manufacturing and rising urban development.
- Reclaimed and recycled wood materials will gain traction as circular economy practices expand.
- Investments in advanced resin systems will improve moisture resistance and structural performance.
- Partnerships between panel manufacturers and construction technology firms will accelerate innovation.
- Global supply-chain optimization will reshape sourcing strategies and improve market accessibility.
Request a Free Sample
Fill in your details and we'll send you a free sample report.
- Sample data tables & charts
- Research methodology
Need a Custom Version of This Report?
Tailor the scope, geography, or segments to your exact requirements.
- Custom geography or segment scope
- Direct access to our analyst team
Frequently Asked Questions
What is the current market size for the Reconstituted Wood Market, and what is its projected size in 2032?
At what Compound Annual Growth Rate is the Reconstituted Wood Market projected to grow between 2024 and 2032?
Which Reconstituted Wood Market segment held the largest share in 2024?
What are the primary factors fueling the growth of the Reconstituted Wood Market?
Who are the leading companies in the Reconstituted Wood Market?
Which region commanded the largest share of the Reconstituted Wood Market in 2024?
Table of Content
Chapter 1. Report Introduction
- 1.1 Report Description & Purpose
- 1.1.1 Report Title & Market Definition
- 1.1.2 Unique Selling Propositions (USP) & Key Differentiators
- 1.1.3 Value Proposition for Stakeholders
- 1.2 Research Objectives
- 1.2.1 Market Sizing Objectives (Volume & Revenue)
- 1.2.2 Segmentation Objectives
- 1.2.3 Competitive Intelligence Objectives
- 1.2.4 Forecast & Scenario Objectives
- 1.3 Report Scope
- 1.3.1 Reconstituted Wood Scope – Types & Subtypes Covered
- 1.3.2 Geographic Scope – Regions & Countries Covered
- 1.3.3 Historical Period, Base Year & Forecast Period (2024; forecast to 2032)
- 1.3.4 Inclusions & Exclusions
- 1.4 HS Code & Classification Framework
- 1.5 Currency, Units & Pricing Basis
- 1.6 Target Stakeholders
- 1.7 Limitations & Assumptions
Chapter 2. Executive Summary
- 2.1 Global Reconstituted Wood Market Snapshot
- 2.1.1 Market Size – Historical (2024) & Forecast (2024-2032) (2024: USD 139,479.5 million → 2032: USD 245,080.16 million)
- 2.1.2 Volume & Revenue – Global Totals
- 2.1.3 Key Market Highlights – Top Five Facts
- 2.2 Reconstituted Wood Market Segmentation Snapshot
- 2.2.1 Market Split by Region – 2024 vs. 2032
- 2.3 Competitive Snapshot
- 2.3.1 Top 10 Players by Revenue Share – 2024
- 2.3.2 Top 10 Players by Volume Share – 2024
- 2.3.3 Recent Strategic Developments (18-Month Summary)
- 2.4 Key Investment Highlights & Strategic Conclusions
Chapter 3. Reconstituted Wood Market Dynamics & Industry Analysis
- 3.1 Market Overview & Context
- 3.1.1 Reconstituted Wood Market Position in the Broader Automotive Value Chain
- 3.1.2 OEM vs. Replacement Market Dynamics
- 3.1.3 Market Maturity & Development Stage by Region
- 3.2 Reconstituted Wood Market Drivers
- 3.3 Reconstituted Wood Market Restraints & Challenges
- 3.4 Reconstituted Wood Market Opportunities
- 3.5 Porter's Five Forces Analysis
- 3.5.1 Threat of New Entrants
- 3.5.2 Bargaining Power of Suppliers
- 3.5.3 Bargaining Power of Buyers
- 3.5.4 Threat of Substitutes
- 3.5.5 Competitive Rivalry – Intensity Assessment
- 3.6 Reconstituted Wood Value Chain Analysis
- 3.6.1 Upstream – Raw Material/Input Suppliers
- 3.6.1.1 Raw Material/Input 1
- 3.6.1.2 Raw Material/Input 2
- 3.6.1.3 Raw Material/Input 3
- 3.6.2 Midstream – Production/Manufacturing/Service Delivery
- 3.6.2.1 Production/Process Overview
- 3.6.2.2 Key Facility Locations & Capacity by Manufacturer
- 3.6.3 Downstream – Distribution & End Consumer
- 3.6.3.1 Primary Channel – B2B/OEM
- 3.6.3.2 Secondary Channels – Dealer, Retail, Online, Direct
- 3.6.4 Value Chain Profitability Analysis
- 3.6.1 Upstream – Raw Material/Input Suppliers
- 3.7 PESTEL Analysis
- 3.7.1 Political Factors
- 3.7.2 Economic Factors
- 3.7.3 Social Factors
- 3.7.4 Technological Factors
- 3.7.5 Environmental Factors
- 3.7.6 Legal Factors
- 3.8 Reconstituted Wood Supply Chain Analysis
- 3.8.1 Raw Material/Input Supply Risk Assessment
- 3.8.2 Manufacturing Concentration Risk (Geographic Exposure)
- 3.8.3 Trade Disruption Impact Analysis
- 3.9 Regulatory & Policy Landscape
Note: The regulatory and policy landscape section covers regulations based on their applicability to the market, Reconstituted Wood category, geography, and scope of the study. Only regulatory frameworks with a material impact on operations, compliance, trade, sustainability, or market access are analyzed in detail.
Chapter 4. Key Investment Pockets & Opportunity Analysis
- 4.1 Reconstituted Wood Market Attractiveness Analysis
- 4.1.1 By Region – Investment Attractiveness Matrix (Volume × CAGR)
- 4.2 Absolute Revenue Growth Opportunity
- 4.2.1 By Region – Absolute USD Growth Through 2032
- 4.3 Incremental Volume Opportunity
- 4.3.1 By Region – Incremental Volume Through 2032
- 4.3.2 Segment – Incremental Volume
- 4.4 Emerging Submarket Opportunity Deep Dive (Subject to Applicability)
- 4.5 Emerging Market Opportunity Scorecards
- 4.5.1 United States
- 4.5.2 Europe
- 4.5.3 Asia
- 4.5.4 Middle East & Africa
Note: Emerging Market Opportunity Scorecards will be included based on relevance and strategic importance. Regions listed are indicative and may vary depending on data availability and market dynamics.
Chapter 5. Reconstituted Wood Import-Export Analysis & Trade Flows
- 5.1 Global Trade Overview
- 5.1.1 Global Export Value by Country (2024)
- 5.1.2 Global Export Volume by Country (2024)
- 5.1.3 Global Import Value by Country (2024)
- 5.1.4 Global Import Volume by Country (2024)
- 5.1.5 Net Trade Balance by Country (2024)
- 5.2 Export Analysis – Segment
- 5.2.1 Type 1 (HS Code)
- 5.2.2 Type 2 (HS Code)
- 5.2.3 Type 3 (HS Code)
- 5.2.4 Type 4 (HS Code)
- 5.2.5 Type 5 (HS Code)
- 5.3 Import Analysis – Segment
- 5.3.1 Type 1 (HS Code)
- 5.3.2 Type 2 (HS Code)
- 5.3.3 Type 3 (HS Code)
- 5.3.4 Type 4 (HS Code)
- 5.3.5 Type 5 (HS Code)
- 5.4 Average Unit Trade Prices
- 5.4.1 Average Export Price – Segment & Country
- 5.4.2 Average Import Price – Segment & Source Country
- 5.4.3 Price Trends (2024)
- 5.5 Key Trade Route Analysis
- 5.5.1 Trade Route 1
- 5.5.2 Trade Route 2
- 5.5.3 Trade Route 3
- 5.5.4 Trade Route 4
- 5.5.5 Trade Route 5
- 5.6 Trade Policy Impact Assessment
- 5.6.1 US Anti-Dumping & Section 301 Tariffs
- 5.6.2 EU Customs Union Impact
- 5.6.3 Major Free Trade Agreements
- 5.6.4 USMCA Rules of Origin
Note: Trade policy analysis will be included only where relevant to the Reconstituted Wood market.
Chapter 6. Competitive Landscape & Company Benchmarking
- 6.1 Reconstituted Wood Market Concentration & Structure
- 6.1.1 Herfindahl-Hirschman Index (HHI) – vs. 2024
- 6.1.2 Tier 1, Tier 2 & Tier 3 Market Structure
- 6.1.3 Global, Regional & Local Player Dynamics
- 6.2 Reconstituted Wood Market Share Analysis – 2024
- 6.2.1 Global Revenue Share by Company
- 6.2.2 Global Volume Share by Company
- 6.2.3 Regional Revenue Share
- 6.2.4 Market Share Evolution ( vs. 2024)
- 6.2.5 OEM Segment Share by Company
- 6.2.6 Replacement Segment Share by Company
- 6.3 Production/Delivery Capacity & Facility Analysis
- 6.3.1 Global Installed Capacity
- 6.3.2 Capacity Utilization Rates
- 6.3.3 Production/Output Volume
- 6.3.4 Facility Locations & Capacity Map
- 6.3.5 Planned Capacity Additions
- 6.4 Reconstituted Wood Competitive Benchmarking Matrix
- 6.4.1 Revenue, Volume, CAGR & Profitability Comparison
- 6.4.2 Channel Revenue Mix
- 6.4.3 Geographic Revenue Exposure
- 6.4.4 R&D Intensity
- 6.4.5 Sustainability Maturity
- 6.5 Strategic Developments in Reconstituted Wood (Last 24 Months)
- 6.5.1 Mergers, Acquisitions & Divestments
- 6.5.2 New Reconstituted Wood Launches
- 6.5.3 Facility Expansions
- 6.5.4 Strategic Alliances, Joint Ventures & Partnerships
- 6.5.5 Distribution Expansion & Market Entry
- 6.5.6 Sustainability & ESG Initiatives
- 6.6 Competitive Strategy Mapping
- 6.6.1 Leader, Challenger, Follower & Niche Classification
- 6.6.2 Pricing Strategy Comparison
- 6.6.3 Channel Strategy Matrix
Note: Strategic developments are included based on their materiality and the availability of reliable information.
Chapter 7. Global Reconstituted Wood Market – By Distribution Channel
- 7.1 Segment Overview
- 7.1.1 Volume & Revenue Split by Channel (2024 & 2032)
- 7.1.2 Channel Mix Evolution (2024-2032)
Chapter 8. Regional Market Analysis – Global Overview
- 8.1 Global Regional Overview
- 8.1.1 Regional Volume Share
- 8.1.2 Regional Revenue Share
- 8.1.3 Regional Volume by Region
- 8.1.4 Regional Revenue by Region
- 8.1.5 Regional Forecast Through 2032
- 8.2 Cross-Regional Segment Analysis
- 8.2.1 By Distribution Channel
- 8.2.2 By Brand/Price Tier
Chapter 9. North America Reconstituted Wood Market
- 9.1 United States
- 9.2 Canada
- 9.3 Mexico
Chapter 10. Europe Reconstituted Wood Market
- 10.1 Germany
- 10.2 France
- 10.3 Italy
- 10.4 United Kingdom
- 10.5 Spain
- 10.6 Poland
- 10.7 Russia
- 10.8 Netherlands
- 10.9 Belgium
- 10.10 Sweden
- 10.11 Denmark
- 10.12 Norway
- 10.13 Rest of Europe
Chapter 11. Asia Pacific Reconstituted Wood Market
- 11.1 China
- 11.2 India
- 11.3 Japan
- 11.4 South Korea
- 11.5 Thailand
- 11.6 Indonesia
- 11.7 Vietnam
- 11.8 Malaysia
- 11.9 Australia
- 11.10 Rest of Asia Pacific
Chapter 12. Latin America Reconstituted Wood Market
- 12.1 Brazil
- 12.2 Argentina
- 12.3 Colombia
- 12.4 Chile
- 12.5 Rest of Latin America
Chapter 13. Middle East Reconstituted Wood Market
- 13.1 Saudi Arabia
- 13.2 United Arab Emirates
- 13.3 Turkey
- 13.4 Israel
- 13.5 Iran
- 13.6 Rest of the Middle East
Chapter 14. Africa Reconstituted Wood Market
- 14.1 South Africa
- 14.2 Egypt
- 14.3 Nigeria
- 14.4 Morocco
- 14.5 Rest of Africa
Chapter 15. Reconstituted Wood Company Profiles
- 15.1 [Company 01]
- 15.1.1 Company Overview
- 15.1.2 Key Management Personnel
- 15.1.3 Products & Services Portfolio
- 15.1.4 Financial Performance
- 15.1.5 Key Market Focus & Geographic Presence
- 15.1.6 Recent Developments & Strategic Initiatives
Note: The company profile list is preliminary and may change based on research findings, market developments, data availability, and client requirements.
Chapter 16. Appendices
- Appendix A – List of Abbreviations & Acronyms
- Appendix B – Industry Classification Code Reference – Full Series
- Appendix C – Production & Capacity Data Tables
- Appendix D – End-Use & Demand Base Tables
- Appendix E – Consumption & Replacement Rate Assumptions
- Appendix F – ASP Reference Tables
- Appendix G – Manufacturing & Facility Database
- Appendix H – Import-Export Data Tables
- Appendix I – Regulatory Summary Tables
- Appendix J – Primary Research Participant List (Anonymized)
- Appendix K – Primary Research Questionnaire Framework
- Appendix L – Data Sources & Bibliography
- Appendix M – Market Size Divergence & Source Comparison
Chapter 17. Research Methodology
- 17.1 Research Framework & Philosophy
- 17.2 Secondary Research – Sources, Hierarchy & Data Extraction
- 17.3 Data Modeling – Bottom-Up & Top-Down Market Sizing
- 17.4 Primary Research – Stakeholder Framework, LOI & Sample Sizes
- 17.5 Forecast Methodology – Regression, Scenario & Sensitivity Analysis
- 17.6 Quality Control – Four-Layer Validation Framework
- 17.7 Limitations & Standard Assumptions
- 17.8 Disclaimer
