
Market overview
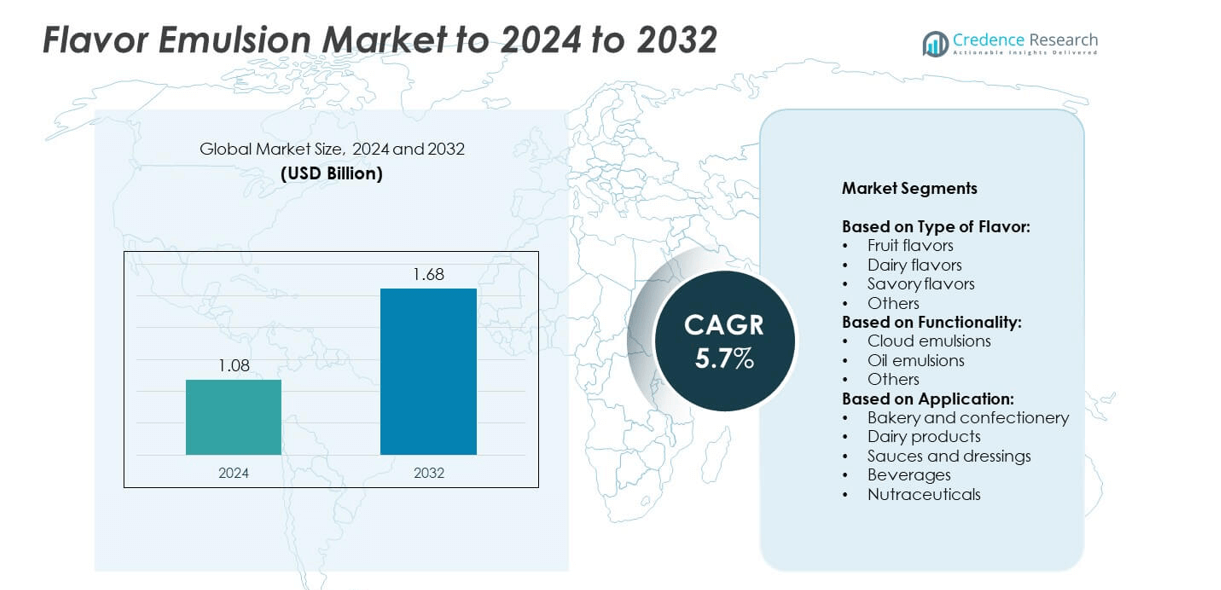
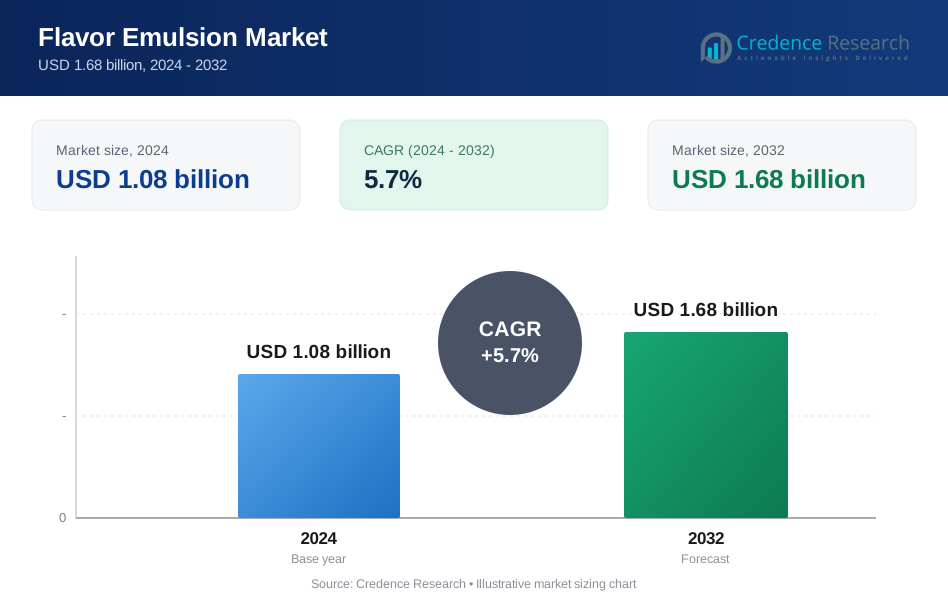
The Flavor Emulsion Market size was valued at USD 1.08 billion in 2024 and is anticipated to reach USD 1.68 billion by 2032, at a CAGR of 5.7% during the forecast period.
| REPORT ATTRIBUTE | DETAILS |
|---|---|
| Historical Period | 2020-2023 |
| Base Year | 2024 |
| Forecast Period | 2025-2032 |
| Flavor Emulsion Market Size 2024 | USD 1.08 billion |
| Flavor Emulsion Market, CAGR | 5.7% |
| Flavor Emulsion Market Size 2032 | USD 1.68 billion |
The flavor emulsion market is shaped by prominent players such as Flavorcon Corporation, Firmenich, Gold Coast Ingredients, LorAnn Oils, Keva Flavours, M&N Flavor, Cargill Incorporated, Flavaroma, Jamsons Industries, and Cape Food Ingredients. These companies focus on developing natural, clean-label, and innovative formulations to meet evolving consumer preferences in beverages, bakery, and nutraceuticals. North America led the global market in 2024 with a 35% share, supported by strong demand for functional beverages and advanced processing capabilities. Europe followed with 28%, driven by regulatory push for sustainable ingredients, while Asia Pacific accounted for 25%, emerging as the fastest-growing regional market.
Market Insights
- The flavor emulsion market was valued at USD 1.08 billion in 2024 and is projected to reach USD 1.68 billion by 2032, expanding at a CAGR of 5.7%.
- Rising demand for clean-label, natural, and functional beverages is fueling the adoption of fruit-based emulsions, which held the largest share in 2024.
- Key trends include the growing shift toward plant-based and vegan food products, along with premiumization through exotic flavor offerings in beverages and bakery segments.
- The market is competitive, with global and regional players investing in R&D, focusing on stability, shelf life, and sustainable formulations, while smaller firms aim to capture share through cost-effective solutions.
- North America led with 35% market share in 2024, followed by Europe at 28% and Asia Pacific at 25%, while Latin America and the Middle East & Africa accounted for 7% and 5% respectively, highlighting strong regional diversification.
Market Segmentation Analysis:
By Type of Flavor
Fruit flavors dominated the flavor emulsion market in 2024, accounting for over 40% of total share. Their popularity stems from strong demand in beverages, confectionery, and dairy products, where natural fruity notes enhance consumer appeal. Rising health-conscious preferences for clean-label and natural ingredients further push the adoption of fruit-based emulsions. Dairy flavors follow, supported by innovations in frozen desserts and flavored milk, while savory emulsions expand in sauces and ready-to-eat meals. The continuous introduction of exotic fruit variants and improved extraction techniques reinforce fruit flavors’ leading position.
- For instance, Symrise’s Taste, Nutrition & Health portfolio sells ~19,000 products in 148 countries supporting broad fruit flavor rollouts.
By Functionality
Cloud emulsions held the dominant share of the market in 2024, representing nearly 50% of overall demand. Their ability to provide stability, visual appeal, and uniform dispersion in beverages makes them the preferred choice for juices, soft drinks, and functional waters. Growing innovations in beverage formulations, coupled with rising demand for natural clouding agents, continue to drive this segment. Oil emulsions, on the other hand, play a crucial role in flavor delivery for sauces and confectionery applications. The development of shelf-stable, low-fat formulations strengthens the relevance of cloud emulsions globally.
- For instance, Givaudan’s PRIMETIME line lists 837 products, including dedicated cloud flavor emulsions for drinks.
By Application
Beverages emerged as the largest application segment in 2024, capturing over 45% of market share. Flavor emulsions in juices, carbonated soft drinks, and energy drinks drive this dominance, supported by rising demand for refreshing and innovative flavors. The expansion of functional and fortified beverages has also created strong growth opportunities for stable emulsions that preserve taste and appearance. Bakery and confectionery remain significant contributors, where emulsions enhance consistency and flavor release. The rising adoption of nutraceutical products further supports demand, but beverages remain the primary driver due to volume consumption and continuous product innovation.
Key Growth Drivers
Rising Demand for Clean-Label and Natural Ingredients
Consumers increasingly prefer clean-label food and beverages with natural flavoring solutions. This shift is driving manufacturers to use fruit-based and plant-derived emulsions that meet transparency and health requirements. Companies are focusing on eliminating artificial stabilizers, synthetic colors, and chemical additives, further boosting demand for natural flavor emulsions. Regulatory support for clean-label formulations adds momentum, especially in North America and Europe. This trend ensures sustained market growth, making the demand for clean-label and natural ingredients a key growth driver.
- For instance, Nexira’s Fibregum™ acacia provides a minimum 90% soluble fiber clean-label stabilizer for beverages.
Expansion of Functional and Fortified Beverages
The growing popularity of fortified waters, energy drinks, and nutraceutical beverages has strengthened the use of flavor emulsions. These emulsions enhance taste stability, improve texture, and provide uniform dispersion, which are critical in functional beverage formulations. The health-conscious population drives this demand by seeking drinks with added vitamins, minerals, and herbal extracts. Beverage producers are innovating with tropical, citrus, and exotic flavor emulsions to attract wider audiences. The increasing reliance on functional beverages positions this as a key growth driver.
- For instance, Sensient’s beverage guidance flags low stability above 200 nm, underscoring the push toward sub-200 nm systems.
Technological Advancements in Emulsion Stability
Advances in microencapsulation, nanoemulsions, and natural stabilizer integration have improved flavor delivery and shelf life. These technologies enable better solubility, reduced phase separation, and enhanced sensory experiences across applications. Food and beverage manufacturers benefit from stable emulsions that withstand processing stress, maintaining consistent quality and appearance. Companies are also developing fat-reduced and allergen-free emulsions for broader market acceptance. These innovations allow producers to meet diverse consumer needs, reinforcing technological progress as a key growth driver.
Key Trends and Opportunities
Shift Toward Plant-Based and Vegan Food Products
The rapid expansion of plant-based diets presents a major opportunity for flavor emulsion providers. Emulsions are being tailored for dairy alternatives such as plant-based milk, yogurt, and cheese to improve flavor and texture. Vegan-friendly emulsions free from animal-derived stabilizers are in high demand. Manufacturers are exploring natural oil-based emulsions to cater to this niche. The alignment with consumer lifestyle choices makes plant-based applications a key trend and opportunity, accelerating product innovations in dairy substitutes and meat alternatives.
- For instance, IFF notes 35% of 2023 North American dessert and ice-cream launches used IFF emulsifiers; 22% in bakery, >15% in chocolate.
Premiumization and Exotic Flavor Adoption
Consumers are increasingly drawn to premium, exotic, and experiential flavors in food and beverages. This demand has led to the adoption of tropical fruit emulsions such as passionfruit, lychee, and dragon fruit. Brands are using exotic emulsions to differentiate products in competitive beverage and confectionery markets. Premium flavors also resonate with younger consumers seeking novel taste experiences. The rising focus on premiumization and exotic flavor introduction positions this as a key trend and opportunity in global markets.
- For instance, Takasago’s 2024 Global Pulse TrendSeeds™ analysis aggregated over 2,700 data sources from over 20 countries to guide exotic flavor development.
Key Challenges
High Cost of Natural and Specialty Ingredients
Natural emulsions made from plant extracts, essential oils, or exotic fruits come with high production costs. These costs challenge manufacturers in offering price-competitive solutions for mass-market applications. Fluctuations in raw material supply further add to expenses, especially for fruit-based extracts dependent on seasonal yields. Smaller manufacturers often struggle to manage cost pressures while meeting clean-label demand. As a result, the high cost of natural and specialty inputs remains a key challenge for the flavor emulsion industry.
Regulatory Compliance and Quality Standardization
Flavor emulsion producers face complex compliance requirements across regions, including FDA, EFSA, and other food safety authorities. Stringent regulations mandate testing for stability, shelf life, and permissible additives. Differing standards across markets make global expansion difficult for companies. Ensuring consistent quality while meeting varying legal thresholds adds to operational challenges. This regulatory complexity often slows product launches and increases production costs. Thus, regulatory compliance and quality standardization remain a key challenge in sustaining long-term growth.
Regional Analysis
North America
North America held the largest share of the flavor emulsion market in 2024, accounting for 35% of global revenue. The strong presence of beverage manufacturers, rising demand for clean-label flavors, and innovations in functional drinks supported this leadership. Growth is also fueled by consumer preference for natural fruit emulsions in juices, energy drinks, and dairy alternatives. The region benefits from advanced food processing technologies and well-established regulatory frameworks that encourage product innovation. Increasing investments by key players in plant-based and fortified beverages further consolidate North America’s leading position in the global market.
Europe
Europe captured a market share of 28% in 2024, driven by its well-regulated food and beverage industry and strong consumer focus on natural, sustainable products. The popularity of premium bakery, confectionery, and dairy products has increased the adoption of fruit and dairy emulsions across the region. Strict EU regulations on food additives are pushing manufacturers to develop cleaner, plant-based solutions. Germany, France, and the UK remain key contributors, supported by innovation in functional beverages and nutraceuticals. The growing trend toward vegan and allergen-free food further enhances the region’s demand for advanced flavor emulsion solutions.
Asia Pacific
Asia Pacific accounted for 25% of the flavor emulsion market in 2024, making it one of the fastest-growing regions. Rising disposable incomes, urbanization, and demand for convenience food products have accelerated adoption of emulsions in beverages and dairy segments. Countries such as China, India, and Japan lead consumption due to their expanding food processing industries and younger consumer demographics. The region’s beverage sector, particularly flavored waters and carbonated drinks, drives significant growth. Increasing interest in exotic and tropical fruit flavors further supports expansion. Multinational players continue to invest heavily in manufacturing capacity across Asia Pacific.
Latin America
Latin America represented 7% of the global flavor emulsion market in 2024, supported by rising demand in beverages and confectionery products. Brazil and Mexico dominate regional consumption, with fruit emulsions playing a central role due to the popularity of juice-based drinks and flavored dairy. Growing middle-class populations and urban food consumption trends are fueling demand for innovative flavors. While the market size is smaller compared to other regions, increasing investments from international flavor houses are boosting local production. Latin America’s preference for exotic fruit profiles presents growth opportunities for manufacturers targeting region-specific tastes.
Middle East and Africa
The Middle East and Africa accounted for 5% of the flavor emulsion market in 2024, with growth primarily driven by expanding beverage and dairy sectors. Gulf countries are witnessing rising demand for fortified drinks, while Africa’s growth is tied to increasing urbanization and packaged food adoption. The popularity of flavored milk, juices, and confectionery supports market development. However, the region faces challenges in terms of limited manufacturing infrastructure and high dependence on imports. Despite this, rising investments in food processing and consumer preference for natural flavors are expected to enhance market opportunities.
Market Segmentations:
By Type of Flavor:
- Fruit flavors
- Dairy flavors
- Savory flavors
- Others
By Functionality:
- Cloud emulsions
- Oil emulsions
- Others
By Application:
- Bakery and confectionery
- Dairy products
- Sauces and dressings
- Beverages
- Nutraceuticals
By Geography
- North America
- U.S.
- Canada
- Mexico
- Europe
- Germany
- France
- U.K.
- Italy
- Spain
- Rest of Europe
- Asia Pacific
- China
- Japan
- India
- South Korea
- South-east Asia
- Rest of Asia Pacific
- Latin America
- Brazil
- Argentina
- Rest of Latin America
- Middle East & Africa
- GCC Countries
- South Africa
- Rest of the Middle East and Africa
Competitive Landscape
The flavor emulsion market features a competitive landscape led by Flavorcon Corporation, Firmenich, Gold Coast Ingredients, LorAnn Oils, Keva Flavours, M&N Flavor, Cargill Incorporated, Flavaroma, Jamsons Industries, and Cape Food Ingredients. Competition is shaped by continuous innovation in clean-label solutions, natural emulsions, and advanced technologies such as nanoencapsulation for enhanced stability and shelf life. Companies are expanding their global footprint through partnerships, acquisitions, and new production facilities to meet growing regional demand. Strong investment in research and development enables the introduction of exotic flavor profiles and sustainable formulations aligned with consumer preferences. The market is also witnessing greater emphasis on customized solutions for beverages, dairy alternatives, and nutraceuticals. Regional players focus on cost-effective formulations to strengthen their position in developing markets, while global firms leverage strong supply chains and premium offerings. Overall, innovation, sustainability, and consumer-driven product development remain the core strategies driving competition across the industry.
Key Player Analysis
- Flavorcon Corporation
- Firmenich
- Gold Coast Ingredients
- LorAnn Oils
- Keva Flavours
- M&N Flavor
- Cargill Incorporated
- Flavaroma
- Jamsons Industries
- Cape Food Ingredients
Recent Developments
- In 2025, Cargill Incorporated: Showcased innovative functional blends at AAHAAR 2025 in India, targeting a range of applications including bakery, dairy, and confectionery.
- In 2024, Firmenich (now dsm-firmenich): Announced "Peach+" as its 2024 Flavor of the Year. This selection was inspired by Pantone's Color of the Year and highlighted emerging consumer trends in comfort and wellness.
- In 2024, Flavorcon Corporation, in partnership with Perfumer & Flavorist magazine, planned to host its annual industry conference to discuss future trends in flavor technology, The conference hosted over 330 flavor professionals, with representatives from companies such as PepsiCo, Mars Wrigley, and Givaudan.
Report Coverage
The research report offers an in-depth analysis based on Type of Flavor, Functionality, Application and Geography. It details leading market players, providing an overview of their business, product offerings, investments, revenue streams, and key applications. Additionally, the report includes insights into the competitive environment, SWOT analysis, current market trends, as well as the primary drivers and constraints. Furthermore, it discusses various factors that have driven market expansion in recent years. The report also explores market dynamics, regulatory scenarios, and technological advancements that are shaping the industry. It assesses the impact of external factors and global economic changes on market growth. Lastly, it provides strategic recommendations for new entrants and established companies to navigate the complexities of the market.
Future Outlook
- The flavor emulsion market will see steady growth driven by rising demand for natural ingredients.
- Beverage applications will remain the largest segment due to strong consumer preference for flavored drinks.
- Fruit-based emulsions will continue to dominate, supported by innovations in tropical and exotic flavors.
- Functional and fortified beverages will create major opportunities for advanced emulsion technologies.
- Plant-based and vegan food products will drive demand for dairy-free and allergen-free emulsions.
- Technological advancements in nanoemulsions and encapsulation will enhance stability and shelf life.
- Clean-label and sustainable formulations will gain higher adoption across global markets.
- Asia Pacific will emerge as the fastest-growing region with strong food and beverage expansion.
- Premiumization trends will encourage development of unique and high-quality flavor emulsions.
- Regulatory compliance will remain a challenge but push innovation toward safer, standardized solutions.
Request a Free Sample
Fill in your details and we'll send you a free sample report.
- Sample data tables & charts
- Research methodology
Need a Custom Version of This Report?
Tailor the scope, geography, or segments to your exact requirements.
- Custom geography or segment scope
- Direct access to our analyst team
Frequently Asked Questions
What is the current market size for Flavor Emulsion Market, and what is its projected size in 2032?
At what Compound Annual Growth Rate is the Flavor Emulsion Market projected to grow between 2 and 2032?
Which Flavor Emulsion Market segment held the largest share in 2024?
What are the primary factors fueling the growth of the Flavor Emulsion Market?
Who are the leading companies in the Flavor Emulsion Market?
Table of Content
Chapter 1. Report Introduction
- 1.1 Report Description & Purpose
- 1.1.1 Report Title & Market Definition
- 1.1.2 Unique Selling Propositions (USP) & Key Differentiators
- 1.1.3 Value Proposition for Stakeholders
- 1.2 Research Objectives
- 1.2.1 Market Sizing Objectives (Volume & Revenue)
- 1.2.2 Segmentation Objectives
- 1.2.3 Competitive Intelligence Objectives
- 1.2.4 Forecast & Scenario Objectives
- 1.3 Report Scope
- 1.3.1 Flavor Emulsion Scope – Types & Subtypes Covered
- 1.3.2 Geographic Scope – Regions & Countries Covered
- 1.3.3 Historical Period, Base Year & Forecast Period (2024; forecast to 2032)
- 1.3.4 Inclusions & Exclusions
- 1.4 HS Code & Classification Framework
- 1.5 Currency, Units & Pricing Basis
- 1.6 Target Stakeholders
- 1.7 Limitations & Assumptions
Chapter 2. Executive Summary
- 2.1 Global Flavor Emulsion Market Snapshot
- 2.1.1 Market Size – Historical (2024) & Forecast (2024-2032) (2024: USD 1.08 billion → 2032: USD 1.68 billion)
- 2.1.2 Volume & Revenue – Global Totals
- 2.1.3 Key Market Highlights – Top Five Facts
- 2.2 Flavor Emulsion Market Segmentation Snapshot
- 2.2.1 Market Split by Region – 2024 vs. 2032
- 2.3 Competitive Snapshot
- 2.3.1 Top 10 Players by Revenue Share – 2024
- 2.3.2 Top 10 Players by Volume Share – 2024
- 2.3.3 Recent Strategic Developments (18-Month Summary)
- 2.4 Key Investment Highlights & Strategic Conclusions
Chapter 3. Flavor Emulsion Market Dynamics & Industry Analysis
- 3.1 Market Overview & Context
- 3.1.1 Flavor Emulsion Market Position in the Broader Automotive Value Chain
- 3.1.2 OEM vs. Replacement Market Dynamics
- 3.1.3 Market Maturity & Development Stage by Region
- 3.2 Flavor Emulsion Market Drivers
- 3.3 Flavor Emulsion Market Restraints & Challenges
- 3.4 Flavor Emulsion Market Opportunities
- 3.5 Porter's Five Forces Analysis
- 3.5.1 Threat of New Entrants
- 3.5.2 Bargaining Power of Suppliers
- 3.5.3 Bargaining Power of Buyers
- 3.5.4 Threat of Substitutes
- 3.5.5 Competitive Rivalry – Intensity Assessment
- 3.6 Flavor Emulsion Value Chain Analysis
- 3.6.1 Upstream – Raw Material/Input Suppliers
- 3.6.1.1 Raw Material/Input 1
- 3.6.1.2 Raw Material/Input 2
- 3.6.1.3 Raw Material/Input 3
- 3.6.2 Midstream – Production/Manufacturing/Service Delivery
- 3.6.2.1 Production/Process Overview
- 3.6.2.2 Key Facility Locations & Capacity by Manufacturer
- 3.6.3 Downstream – Distribution & End Consumer
- 3.6.3.1 Primary Channel – B2B/OEM
- 3.6.3.2 Secondary Channels – Dealer, Retail, Online, Direct
- 3.6.4 Value Chain Profitability Analysis
- 3.6.1 Upstream – Raw Material/Input Suppliers
- 3.7 PESTEL Analysis
- 3.7.1 Political Factors
- 3.7.2 Economic Factors
- 3.7.3 Social Factors
- 3.7.4 Technological Factors
- 3.7.5 Environmental Factors
- 3.7.6 Legal Factors
- 3.8 Flavor Emulsion Supply Chain Analysis
- 3.8.1 Raw Material/Input Supply Risk Assessment
- 3.8.2 Manufacturing Concentration Risk (Geographic Exposure)
- 3.8.3 Trade Disruption Impact Analysis
- 3.9 Regulatory & Policy Landscape
Note: The regulatory and policy landscape section covers regulations based on their applicability to the market, Flavor Emulsion category, geography, and scope of the study. Only regulatory frameworks with a material impact on operations, compliance, trade, sustainability, or market access are analyzed in detail.
Chapter 4. Key Investment Pockets & Opportunity Analysis
- 4.1 Flavor Emulsion Market Attractiveness Analysis
- 4.1.1 By Region – Investment Attractiveness Matrix (Volume × CAGR)
- 4.2 Absolute Revenue Growth Opportunity
- 4.2.1 By Region – Absolute USD Growth Through 2032
- 4.3 Incremental Volume Opportunity
- 4.3.1 By Region – Incremental Volume Through 2032
- 4.3.2 Segment – Incremental Volume
- 4.4 Emerging Submarket Opportunity Deep Dive (Subject to Applicability)
- 4.5 Emerging Market Opportunity Scorecards
- 4.5.1 United States
- 4.5.2 Europe
- 4.5.3 Asia
- 4.5.4 Middle East & Africa
Note: Emerging Market Opportunity Scorecards will be included based on relevance and strategic importance. Regions listed are indicative and may vary depending on data availability and market dynamics.
Chapter 5. Flavor Emulsion Import-Export Analysis & Trade Flows
- 5.1 Global Trade Overview
- 5.1.1 Global Export Value by Country (2024)
- 5.1.2 Global Export Volume by Country (2024)
- 5.1.3 Global Import Value by Country (2024)
- 5.1.4 Global Import Volume by Country (2024)
- 5.1.5 Net Trade Balance by Country (2024)
- 5.2 Export Analysis – Segment
- 5.2.1 Type 1 (HS Code)
- 5.2.2 Type 2 (HS Code)
- 5.2.3 Type 3 (HS Code)
- 5.2.4 Type 4 (HS Code)
- 5.2.5 Type 5 (HS Code)
- 5.3 Import Analysis – Segment
- 5.3.1 Type 1 (HS Code)
- 5.3.2 Type 2 (HS Code)
- 5.3.3 Type 3 (HS Code)
- 5.3.4 Type 4 (HS Code)
- 5.3.5 Type 5 (HS Code)
- 5.4 Average Unit Trade Prices
- 5.4.1 Average Export Price – Segment & Country
- 5.4.2 Average Import Price – Segment & Source Country
- 5.4.3 Price Trends (2024)
- 5.5 Key Trade Route Analysis
- 5.5.1 Trade Route 1
- 5.5.2 Trade Route 2
- 5.5.3 Trade Route 3
- 5.5.4 Trade Route 4
- 5.5.5 Trade Route 5
- 5.6 Trade Policy Impact Assessment
- 5.6.1 US Anti-Dumping & Section 301 Tariffs
- 5.6.2 EU Customs Union Impact
- 5.6.3 Major Free Trade Agreements
- 5.6.4 USMCA Rules of Origin
Note: Trade policy analysis will be included only where relevant to the Flavor Emulsion market.
Chapter 6. Competitive Landscape & Company Benchmarking
- 6.1 Flavor Emulsion Market Concentration & Structure
- 6.1.1 Herfindahl-Hirschman Index (HHI) – vs. 2024
- 6.1.2 Tier 1, Tier 2 & Tier 3 Market Structure
- 6.1.3 Global, Regional & Local Player Dynamics
- 6.2 Flavor Emulsion Market Share Analysis – 2024
- 6.2.1 Global Revenue Share by Company
- 6.2.2 Global Volume Share by Company
- 6.2.3 Regional Revenue Share
- 6.2.4 Market Share Evolution ( vs. 2024)
- 6.2.5 OEM Segment Share by Company
- 6.2.6 Replacement Segment Share by Company
- 6.3 Production/Delivery Capacity & Facility Analysis
- 6.3.1 Global Installed Capacity
- 6.3.2 Capacity Utilization Rates
- 6.3.3 Production/Output Volume
- 6.3.4 Facility Locations & Capacity Map
- 6.3.5 Planned Capacity Additions
- 6.4 Flavor Emulsion Competitive Benchmarking Matrix
- 6.4.1 Revenue, Volume, CAGR & Profitability Comparison
- 6.4.2 Channel Revenue Mix
- 6.4.3 Geographic Revenue Exposure
- 6.4.4 R&D Intensity
- 6.4.5 Sustainability Maturity
- 6.5 Strategic Developments in Flavor Emulsion (Last 24 Months)
- 6.5.1 Mergers, Acquisitions & Divestments
- 6.5.2 New Flavor Emulsion Launches
- 6.5.3 Facility Expansions
- 6.5.4 Strategic Alliances, Joint Ventures & Partnerships
- 6.5.5 Distribution Expansion & Market Entry
- 6.5.6 Sustainability & ESG Initiatives
- 6.6 Competitive Strategy Mapping
- 6.6.1 Leader, Challenger, Follower & Niche Classification
- 6.6.2 Pricing Strategy Comparison
- 6.6.3 Channel Strategy Matrix
Note: Strategic developments are included based on their materiality and the availability of reliable information.
Chapter 7. Global Flavor Emulsion Market – By Distribution Channel
- 7.1 Segment Overview
- 7.1.1 Volume & Revenue Split by Channel (2024 & 2032)
- 7.1.2 Channel Mix Evolution (2024-2032)
Chapter 8. Regional Market Analysis – Global Overview
- 8.1 Global Regional Overview
- 8.1.1 Regional Volume Share
- 8.1.2 Regional Revenue Share
- 8.1.3 Regional Volume by Region
- 8.1.4 Regional Revenue by Region
- 8.1.5 Regional Forecast Through 2032
- 8.2 Cross-Regional Segment Analysis
- 8.2.1 By Distribution Channel
- 8.2.2 By Brand/Price Tier
Chapter 9. North America Flavor Emulsion Market
- 9.1 United States
- 9.2 Canada
- 9.3 Mexico
Chapter 10. Europe Flavor Emulsion Market
- 10.1 Germany
- 10.2 France
- 10.3 Italy
- 10.4 United Kingdom
- 10.5 Spain
- 10.6 Poland
- 10.7 Russia
- 10.8 Netherlands
- 10.9 Belgium
- 10.10 Sweden
- 10.11 Denmark
- 10.12 Norway
- 10.13 Rest of Europe
Chapter 11. Asia Pacific Flavor Emulsion Market
- 11.1 China
- 11.2 India
- 11.3 Japan
- 11.4 South Korea
- 11.5 Thailand
- 11.6 Indonesia
- 11.7 Vietnam
- 11.8 Malaysia
- 11.9 Australia
- 11.10 Rest of Asia Pacific
Chapter 12. Latin America Flavor Emulsion Market
- 12.1 Brazil
- 12.2 Argentina
- 12.3 Colombia
- 12.4 Chile
- 12.5 Rest of Latin America
Chapter 13. Middle East Flavor Emulsion Market
- 13.1 Saudi Arabia
- 13.2 United Arab Emirates
- 13.3 Turkey
- 13.4 Israel
- 13.5 Iran
- 13.6 Rest of the Middle East
Chapter 14. Africa Flavor Emulsion Market
- 14.1 South Africa
- 14.2 Egypt
- 14.3 Nigeria
- 14.4 Morocco
- 14.5 Rest of Africa
Chapter 15. Flavor Emulsion Company Profiles
- 15.1 [Company 01]
- 15.1.1 Company Overview
- 15.1.2 Key Management Personnel
- 15.1.3 Products & Services Portfolio
- 15.1.4 Financial Performance
- 15.1.5 Key Market Focus & Geographic Presence
- 15.1.6 Recent Developments & Strategic Initiatives
Note: The company profile list is preliminary and may change based on research findings, market developments, data availability, and client requirements.
Chapter 16. Appendices
- Appendix A – List of Abbreviations & Acronyms
- Appendix B – Industry Classification Code Reference – Full Series
- Appendix C – Production & Capacity Data Tables
- Appendix D – End-Use & Demand Base Tables
- Appendix E – Consumption & Replacement Rate Assumptions
- Appendix F – ASP Reference Tables
- Appendix G – Manufacturing & Facility Database
- Appendix H – Import-Export Data Tables
- Appendix I – Regulatory Summary Tables
- Appendix J – Primary Research Participant List (Anonymized)
- Appendix K – Primary Research Questionnaire Framework
- Appendix L – Data Sources & Bibliography
- Appendix M – Market Size Divergence & Source Comparison
Chapter 17. Research Methodology
- 17.1 Research Framework & Philosophy
- 17.2 Secondary Research – Sources, Hierarchy & Data Extraction
- 17.3 Data Modeling – Bottom-Up & Top-Down Market Sizing
- 17.4 Primary Research – Stakeholder Framework, LOI & Sample Sizes
- 17.5 Forecast Methodology – Regression, Scenario & Sensitivity Analysis
- 17.6 Quality Control – Four-Layer Validation Framework
- 17.7 Limitations & Standard Assumptions
- 17.8 Disclaimer
