Market Overview
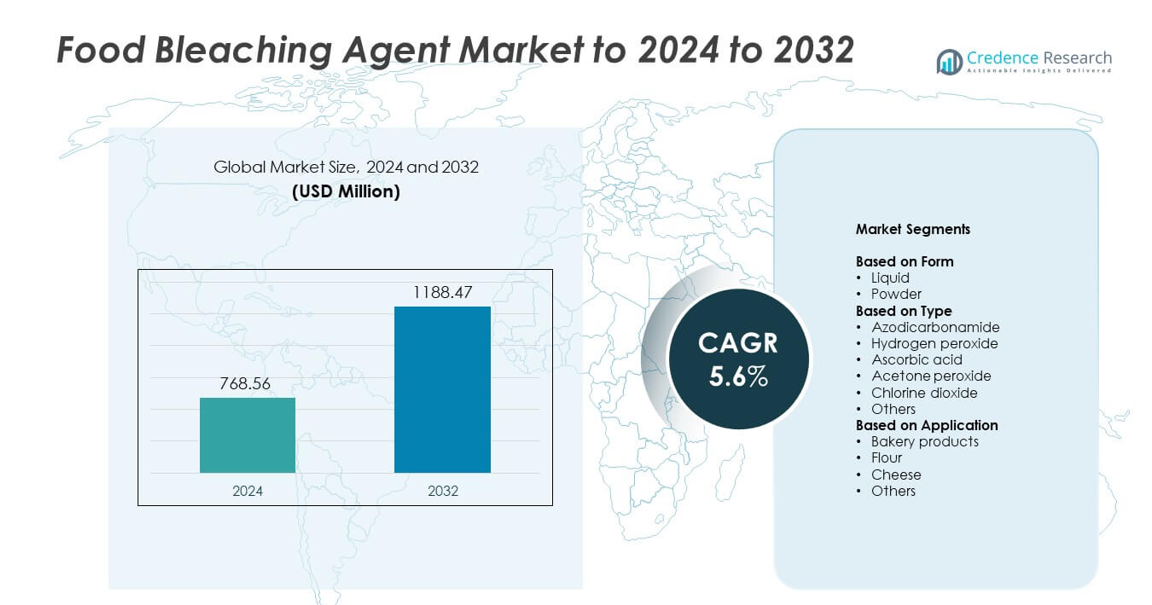
The food bleaching agent market size was valued at USD 768.56 million in 2024 and is anticipated to reach USD 1,188.47 million by 2032, at a CAGR of 5.6% during the forecast period.
| REPORT ATTRIBUTE |
DETAILS |
| Historical Period |
2020-2023 |
| Base Year |
2024 |
| Forecast Period |
2025-2032 |
| Food Bleaching Agent MarketSize 2024 |
USD 768.56 million |
| Food Bleaching Agent Market, CAGR |
5.6% |
| Food Bleaching Agent Market Size 2032 |
USD 1,188.47 million |
The food bleaching agent market is led by major players such as Arkema, Evonik Industries, Solvay, DSM, Nouryon, United Initiators, Cargill, Ineos, Kemira, Gujarat Alkalies and Chemicals, Loba Chemie, and American Elements. These companies focus on innovation, regulatory compliance, and sustainable manufacturing to enhance product safety and efficiency. They are investing in advanced oxidation technologies and residue-free formulations to cater to rising demand across bakery, flour, and dairy sectors. Regionally, North America held the largest market share of 36.5% in 2024, supported by strong food processing infrastructure and strict quality standards, followed by Europe and Asia Pacific, which are experiencing steady expansion driven by technological advancements and growing industrial bakery production.
Market Insights
- The food bleaching agent market was valued at USD 768.56 million in 2024 and is projected to reach USD 1,188.47 million by 2032, growing at a CAGR of 5.6%.
- Rising demand for processed and packaged foods, along with advancements in food safety and oxidation technologies, is driving market expansion.
- The market is witnessing a trend toward natural and clean-label bleaching agents, with hydrogen peroxide and ascorbic acid leading due to safety and efficiency benefits.
- Competition remains strong among global players focusing on eco-friendly formulations, technological innovation, and regulatory compliance to strengthen their market presence.
- North America dominated the market with a 36.5% share, followed by Europe with 29.8% and Asia Pacific with 24.6%, while the powder segment led overall with 61.4% market share in 2024.
Access crucial information at unmatched prices!
Request your sample report today & start making informed decisions powered by Credence Research Inc.!
Download Sample
Market Segmentation Analysis:
By Form
The powder segment dominated the food bleaching agent market with a 61.4% share in 2024. Powder-based agents are widely used due to their stability, easy storage, and precise dosing in flour and bakery applications. They provide consistent whitening effects and longer shelf life compared to liquid variants. The liquid segment is expanding in dairy processing, supported by better solubility and blending efficiency. Growing demand for ready-to-use food-grade bleaching formulations from industrial bakeries further strengthens the dominance of powdered forms across global markets.
- For instance, Mühlenchemie specifies ascorbic acid at 20–60 ppm in flour, with 40 ppm common in base treatments. These dosing levels support consistent loaf volume in bakery trials.
By Type
The hydrogen peroxide segment held the largest share of 43.7% in 2024, driven by its high oxidation efficiency and minimal residue formation. It is extensively used in flour milling and dairy processing to improve color and microbial safety. Regulatory approval for food-grade hydrogen peroxide enhances its acceptance across developed markets. Ascorbic acid and azodicarbonamide are also gaining traction due to their dual functionality as bleaching and maturing agents. The increasing focus on safer, non-chlorinated bleaching alternatives continues to support hydrogen peroxide’s leading position.
- For instance, Evonik supplies AOPACK® hydrogen peroxide at 35% for aseptic food use. Evonik’s global H₂O₂ capacity now totals more than 1 million metric tons per year
By Application
The bakery products segment accounted for the largest share of 48.9% in 2024, driven by strong demand for bread, cakes, and pastries with consistent texture and appearance. Food bleaching agents help improve flour whiteness and baking performance by modifying gluten strength. The flour segment also remains significant, as whitening is essential for refined wheat-based products. Growing urbanization and expansion of organized bakery chains globally continue to propel the use of bleaching agents in bakery production, ensuring quality consistency across large-scale manufacturing operations.
Key Growth Drivers
Rising Demand for Processed and Packaged Foods
Increasing consumption of bakery, dairy, and flour-based products is fueling demand for food bleaching agents. These agents improve product texture, appearance, and shelf appeal, making them essential in food processing. The global expansion of convenience food manufacturing and the rising intake of refined flour products in emerging economies are key contributors. Urbanization and the rapid growth of organized bakery chains are further driving bleaching agent use to ensure consistency in color and quality across mass production lines.
- For instance, Nestlé runs 337 factories in 75 countries. This footprint reflects strong processed food output and consistent ingredient pull.
Technological Advancements in Food Processing
Advances in food-grade oxidation and purification technologies are boosting bleaching agent adoption. Modern manufacturing systems ensure safe concentration control and residue-free formulations. These developments enhance product safety, supporting compliance with food safety regulations. The use of advanced filtration and automation technologies in bleaching systems has improved precision and reduced waste, benefiting food manufacturers. Such innovations also enable the development of eco-friendly and non-chlorinated bleaching alternatives, addressing evolving consumer and regulatory preferences.
- For instance, Tetra Pak’s E3/Speed Hyper fills up to 40,000 packs per hour. Energy use falls by up to 30% and water by up to 45% versus A3/Speed.
Regulatory Support and Standardization
Global regulatory bodies are establishing clear guidelines for safe use of bleaching agents in food applications. Approval for substances like hydrogen peroxide and ascorbic acid by agencies such as the FDA and EFSA is supporting wider market penetration. These approvals have built industry trust and allowed manufacturers to expand their product range. Standardization of food bleaching processes and labeling has also improved transparency, encouraging adoption among bakery, dairy, and flour producers seeking compliance with export-quality norms.
Key Trends & Opportunities
Shift Toward Natural and Clean-Label Agents
Growing consumer preference for chemical-free and natural food ingredients is driving innovation in bleaching solutions. Manufacturers are developing natural alternatives derived from plant-based and enzymatic sources. The clean-label movement is pushing producers to replace synthetic agents like azodicarbonamide with natural oxidizers such as ascorbic acid. This trend offers opportunities for companies investing in organic-certified ingredients and eco-safe processing methods. Rising awareness of ingredient transparency is expected to strengthen this transition.
- For instance, Novonesis’ Acrylaway cut acrylamide ~90% in pretzel trials at 145 ppm. Cracker tests showed ~75% reduction at 60 ppm without flavor change.
R&D in Safe and Residue-Free Formulations
Food companies are investing in research to enhance bleaching performance while reducing chemical residues. Advances in oxidation control have allowed the development of bleaching systems that maintain product quality without compromising safety. New formulations are minimizing environmental impact and ensuring compatibility with sensitive dairy and bakery products. Collaborations between ingredient suppliers and food processors are accelerating the development of advanced, low-toxicity bleaching agents suited for global safety standards.
- For instance, Shin Nihon Chemical Co., Ltd.’s glucose-oxidase food enzyme from Penicillium rubens strain PGO 19-162 has a specified total organic solids (TOS) content ranging between 1.5 % and 2.5 % of the preparation.
Key Challenges
Stringent Food Safety Regulations
Tightening regulatory frameworks across regions are challenging the use of certain chemical bleaching agents. Restrictions on substances such as chlorine dioxide and azodicarbonamide due to health concerns have forced manufacturers to reformulate. Compliance with multi-regional safety standards increases production costs and delays product approvals. These evolving regulations require continuous testing and certification, posing a major challenge for smaller producers lacking advanced R&D or compliance infrastructure.
Rising Demand for Chemical-Free Alternatives
The growing consumer backlash against synthetic additives is reducing the acceptance of chemical bleaching agents. Demand for clean-label and minimally processed foods limits the application of conventional bleaching compounds. Manufacturers face pressure to balance performance with safety, increasing R&D spending. Transitioning to natural agents also brings formulation challenges and higher costs, affecting profitability for producers in cost-sensitive markets like Asia-Pacific and Latin America.
Regional Analysis
North America
North America dominated the food bleaching agent market with a 36.5% share in 2024. The region’s strong demand is driven by the expanding bakery and packaged food industries in the United States and Canada. High consumption of processed flour-based products and strict food quality standards boost the adoption of regulated bleaching compounds such as hydrogen peroxide and ascorbic acid. Growing investment in clean-label formulations and technological innovations in food processing are further supporting market expansion across large-scale commercial bakeries and flour mills in this region.
Europe
Europe accounted for 29.8% of the market share in 2024, supported by a well-established bakery sector and growing demand for organic and residue-free bleaching agents. Countries such as Germany, France, and the United Kingdom are leading in the use of food-grade hydrogen peroxide and natural oxidizers. The European Food Safety Authority’s (EFSA) strict compliance standards encourage the shift toward safe and sustainable ingredients. Continuous innovations in clean-label bakery formulations and regional consumer preference for premium, high-quality bread and confectionery products further enhance the region’s market position.
Asia Pacific
Asia Pacific held a 24.6% market share in 2024, driven by expanding bakery and flour production in China, India, and Japan. Rapid urbanization, population growth, and changing dietary patterns are increasing demand for processed foods. Local manufacturers are adopting advanced bleaching technologies to meet international quality standards. The rising preference for refined flour products and the growing number of commercial bakeries contribute to market expansion. Investments in food-grade hydrogen peroxide production and regulatory reforms supporting food safety are expected to strengthen regional growth further.
Latin America
Latin America captured a 5.4% market share in 2024, primarily driven by the bakery and dairy processing industries in Brazil, Mexico, and Argentina. The increasing consumption of bread and flour-based foods is creating steady demand for efficient bleaching solutions. Adoption of natural and hydrogen peroxide-based agents is gaining pace as regional producers align with international safety norms. Growing investment in the modernization of food processing facilities and rising awareness regarding product quality enhancement are likely to drive market growth across Latin American countries.
Middle East & Africa
The Middle East & Africa region accounted for 3.7% of the market share in 2024, supported by growing urban populations and expansion of commercial food manufacturing. Demand for bakery and dairy products is increasing across Gulf Cooperation Council (GCC) countries and South Africa. Local food processors are adopting hydrogen peroxide and ascorbic acid-based bleaching agents to improve product quality and color consistency. The establishment of new flour mills and bakery production units, along with supportive food safety regulations, is expected to drive gradual market penetration in the region.
Market Segmentations:
By Form
By Type
- Azodicarbonamide
- Hydrogen peroxide
- Ascorbic acid
- Acetone peroxide
- Chlorine dioxide
- Others
By Application
- Bakery products
- Flour
- Cheese
- Others
By Geography
- North America
- Europe
- Germany
- France
- Italy
- U.K.
- Russia
- Rest of Europe
- Asia-Pacific
- India
- China
- Japan
- Rest of Asia-Pacific
- Latin America
- Brazil
- Mexico
- Rest of Latin America
- Middle East and Africa
- GCC Countries
- South Africa
- Rest of Middle East and Africa
Competitive Landscape
The food bleaching agent market is characterized by strong competition among major players such as Arkema, Evonik Industries, Solvay, DSM, Nouryon, United Initiators, Cargill, Ineos, Kemira, Gujarat Alkalies and Chemicals, Loba Chemie, and American Elements. Companies focus on developing safe, residue-free, and high-performance formulations to meet global food safety standards. Continuous investment in research and innovation drives advancements in oxidation control and clean-label product development. Strategic collaborations with food processors and ingredient manufacturers enhance product applications across bakery, flour, and dairy sectors. Firms are also expanding production capacities and distribution networks in emerging markets to strengthen their global presence. Regulatory compliance, sustainable manufacturing, and eco-friendly formulations remain critical differentiators among competitors. The industry is shifting toward natural and non-chlorinated bleaching agents, reflecting growing consumer preference for transparency and sustainability in food processing ingredients.
Shape Your Report to Specific Countries or Regions & Enjoy 30% Off!
Key Player Analysis
- Arkema
- Evonik Industries
- Solvay
- DSM
- Nouryon
- United Initiators
- Cargill
- Ineos
- Kemira
- Gujarat Alkalies and Chemicals
- Loba Chemie
- American Elements
Recent Developments
- In 2025, Cargill Showcased a range of innovative functional blends at trade shows, including a dent corn-based modified starch that creates brighter color and appearance in sauces.
- In 2024, Evonik Industries AG Introduced a carbon-neutral hydrogen peroxide in Europe as part of its “Way to GO2” initiative. This product helps customers reduce their Scope 3 emissions while maintaining high bleaching performance.
- In 2024, Solvay announced a partnership with Huatai Chemical to expand its hydrogen peroxide plant in China.
Report Coverage
The research report offers an in-depth analysis based on Form, Type, Application and Geography. It details leading market players, providing an overview of their business, product offerings, investments, revenue streams, and key applications. Additionally, the report includes insights into the competitive environment, SWOT analysis, current market trends, as well as the primary drivers and constraints. Furthermore, it discusses various factors that have driven market expansion in recent years. The report also explores market dynamics, regulatory scenarios, and technological advancements that are shaping the industry. It assesses the impact of external factors and global economic changes on market growth. Lastly, it provides strategic recommendations for new entrants and established companies to navigate the complexities of the market.
Future Outlook
- The market will witness steady growth due to increasing bakery and flour production globally.
- Demand for hydrogen peroxide and ascorbic acid-based agents will continue rising.
- Clean-label and natural bleaching formulations will gain strong traction in developed regions.
- Advancements in oxidation technology will improve product safety and processing efficiency.
- Stringent food safety regulations will drive reformulation toward approved and eco-safe agents.
- Asia Pacific will emerge as the fastest-growing regional market driven by food industrialization.
- Strategic collaborations between ingredient suppliers and food processors will boost innovation.
- Growing consumer awareness about food quality will strengthen preference for residue-free products.
- Expansion of industrial bakeries will create consistent demand for powder-based bleaching forms.
- Sustainable manufacturing and plant-derived bleaching solutions will define future market direction.



