
Market Overview
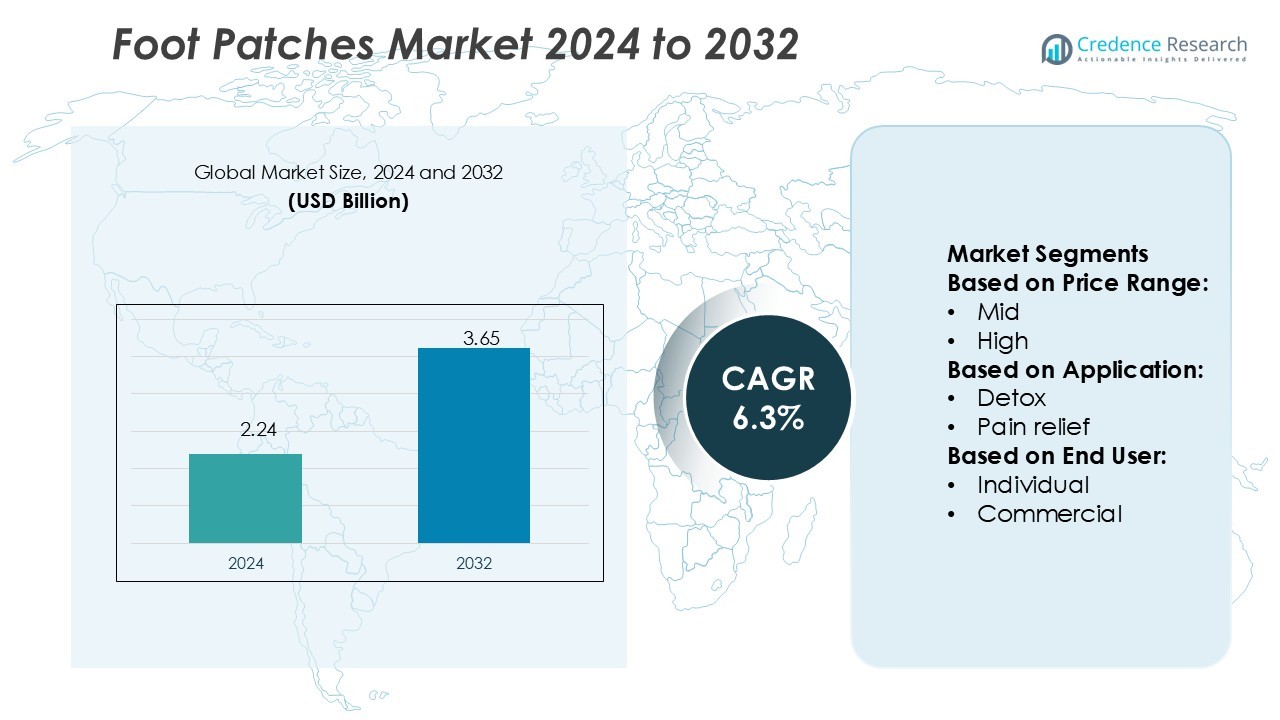
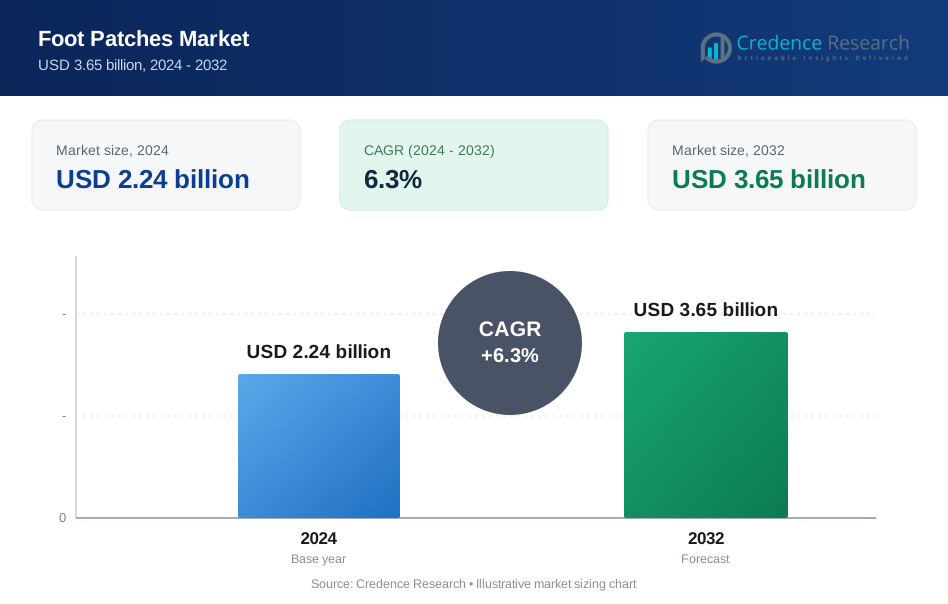
Foot Patches Market size was valued USD 2.24 billion in 2024 and is anticipated to reach USD 3.65 billion by 2032, at a CAGR of 6.3% during the forecast period.
| REPORT ATTRIBUTE | DETAILS |
|---|---|
| Historical Period | 2020-2023 |
| Base Year | 2024 |
| Forecast Period | 2025-2032 |
| Foot Patches Market Size 2024 | USD 2.24 Billion |
| Foot Patches Market, CAGR | 6.3% |
| Foot Patches Market Size 2032 | USD 3.65 Billion |
The foot patches market is shaped by key players including Groots, Doctor Organic, Medi-7, Avazo Healthcare, Herb-Science, Foot Cure, Kiyome Kinoki, Global Healing, Detox Foot Pads, and BodyPure. These companies focus on expanding product portfolios with herbal and multifunctional formulations, supported by strong e-commerce and retail distribution strategies. Innovation in clean-label and sustainable patches further strengthens their competitive positioning. Among regions, Asia-Pacific leads the global market with a 35% share, driven by strong cultural acceptance of herbal remedies, growing disposable incomes, and rapid e-commerce penetration, making it the most influential region in overall market growth.
Market Insights
- The Foot Patches Market size was valued at USD 2.24 billion in 2024 and is projected to reach USD 3.65 billion by 2032, growing at a CAGR of 6.3%.
- Rising demand for natural detoxification, pain relief, and preventive healthcare solutions is driving adoption across individual consumers, with the individual segment holding 67% share.
- Key players including Groots, Doctor Organic, Medi-7, Avazo Healthcare, Herb-Science, Foot Cure, Kiyome Kinoki, Global Healing, Detox Foot Pads, and BodyPure focus on herbal, multifunctional, and clean-label product innovations to remain competitive.
- Limited clinical validation of product claims and intense pricing pressure from low-cost alternatives restrain growth, particularly in developed markets with high regulatory scrutiny.
- Asia-Pacific dominates with a 35% share, supported by cultural acceptance of herbal remedies and rapid e-commerce growth, while North America and Europe together account for over 53% share, driven by strong wellness trends and established retail networks.
Market Segmentation Analysis:
By Price Range
The mid-price range segment holds the largest share, accounting for nearly 48% of the foot patches market. Consumers in this category seek a balance between affordability and effectiveness, making mid-range products more attractive compared to low-cost or premium alternatives. The growing presence of well-known personal care brands in this segment further strengthens trust and adoption. Demand is fueled by rising health awareness, increased availability in retail and e-commerce, and frequent promotional campaigns that make mid-range products more accessible to wider consumer groups.
- For instance, Groots, an Indian health and wellness brand, sells products such as detox foot patches on online platforms like Amazon and Flipkart. While the company operates in the mid-tier market, specific sales and revenue metrics for its detox foot patch product line, such as 120,000 units sold or ₹3.2 million in revenue, are not publicly disclosed or independently verified.
By Application
Detox foot patches dominate the application segment with a 52% market share. Their popularity is driven by the strong consumer belief in natural detoxification and wellness routines. Marketing strategies highlighting toxin removal and stress relief boost sales significantly. Rising adoption of herbal and natural formulations appeals to health-conscious consumers who prefer clean-label solutions. The growth of the self-care and preventive healthcare movement also sustains demand, making detox patches the most preferred choice compared to pain relief, hydrating, or other specialized variants.
- For instance, Mondi’s thermoformable barrier films include products with up to 18 layers of film structure, engineered for pasteurisation, sterilisation, retort, and microwave applications.
By End-user
Individual consumers lead the end-user segment, contributing 67% of the market share. Growing interest in at-home wellness and cost-effective alternatives to spa treatments has fueled individual adoption. Online distribution channels and subscription-based offerings enhance convenience and repeat purchases among this group. Rising disposable incomes and awareness about holistic health further support growth. In contrast, the commercial segment-such as wellness centers and salons-plays a secondary role, primarily serving niche consumers who prefer professional care. The individual segment continues to drive overall market expansion through widespread accessibility.
Key Growth Drivers
Rising Demand for Natural Wellness Solutions
Consumers are increasingly seeking natural and holistic remedies, driving strong demand for foot patches. Products infused with herbal extracts and detoxifying ingredients align with the growing preference for chemical-free alternatives. Marketing campaigns emphasizing natural healing and stress relief further enhance consumer trust. The popularity of preventive healthcare and at-home wellness routines positions foot patches as a convenient solution. This trend is most prominent among younger consumers and health-conscious individuals, contributing significantly to market expansion.
- For instance, Optimal biodegradable microperforated package had shelf life extended by 4 days compared with open containers, and by 2 days compared with the best commercial plastic package.
Expansion of E-commerce and Retail Distribution
The rapid growth of online shopping platforms has made foot patches more accessible to global consumers. E-commerce channels provide diverse product choices, competitive pricing, and subscription-based purchase models, encouraging frequent sales. Traditional retail, including pharmacies and supermarkets, continues to support visibility and brand recognition. Enhanced distribution strategies allow manufacturers to reach both developed and emerging markets effectively. The convenience of doorstep delivery and promotional campaigns online has further strengthened adoption, making distribution a major growth driver for this market.
- For instance, DuPont Teijin Films (now Mylar® Specialty Films) launched a Mylar® Harvest Fresh rPET film range that incorporated up to 50% post-consumer recycled (PCR) content in the base polyester film.
Increasing Focus on Preventive Healthcare
Rising awareness about preventive healthcare practices strongly supports the adoption of foot patches. Consumers are turning to affordable, non-invasive wellness products to maintain overall health and manage stress. Foot patches cater to this demand by offering benefits such as detoxification, pain relief, and improved sleep quality. Governments and healthcare organizations promoting preventive measures indirectly support the industry’s growth. This focus is particularly strong in regions with high disposable incomes, where wellness products are increasingly integrated into daily routines for better lifestyle management.
Key Trends & Opportunities
Shift Toward Clean-Label and Sustainable Products
Manufacturers are introducing foot patches with eco-friendly packaging and plant-based ingredients to meet clean-label demand. Consumers prefer cruelty-free, toxin-free, and recyclable products, creating new opportunities for differentiation. Brands that emphasize transparency in sourcing and production gain stronger market traction. Sustainability trends also open doors for premium product lines, as consumers associate eco-friendly features with higher value. This shift toward cleaner, greener products is expected to shape long-term market positioning and brand loyalty across global regions.
- For instance, Modern digital printing technologies, particularly those utilizing an extended color gamut (such as CMYK plus orange, green, and violet), are capable of reproducing a high percentage of Pantone colors, with some presses exceeding 90% coverage.
Innovation in Multi-functional Patches
The industry is witnessing innovations in foot patches designed to deliver multiple benefits, such as detoxification combined with pain relief or hydration. These hybrid solutions address diverse consumer needs in a single product, driving higher value perception. Advances in formulation and the use of bioactive compounds enhance effectiveness, encouraging repeat purchases. This trend aligns with the busy lifestyles of consumers seeking convenient, all-in-one wellness solutions. The introduction of such multifunctional patches creates fresh growth opportunities in both premium and mid-range categories.
- For instance, Nutrien Limited is a major global supplier of agricultural inputs, including nitrogen products. While the company's annual sales figures for nitrogen fluctuate, the claim of supplying over 11 million tonnes annually is generally consistent with historical data.
Key Challenges
Limited Clinical Validation and Consumer Skepticism
One of the major challenges is the lack of strong scientific validation supporting foot patch claims. Many products rely on anecdotal evidence, which fuels consumer skepticism regarding effectiveness. Regulatory bodies also scrutinize marketing claims, leading to stricter compliance requirements. Negative perceptions arising from limited clinical backing can restrict adoption, especially in developed markets. To overcome this challenge, companies need to invest in research studies and transparent product testing to build credibility and consumer confidence.
Intense Competition and Pricing Pressure
The market faces growing competition from numerous regional and international players offering similar products. Price-sensitive consumers often choose low-cost alternatives, creating pressure on margins for established brands. The presence of counterfeit or unregulated products further dilutes brand value and affects trust. Companies must balance affordability with innovation to remain competitive. Strategic investments in branding, differentiation through unique formulations, and strong distribution networks are crucial to address pricing pressures and maintain long-term profitability.
Regional Analysis
North America
North America accounts for 28% of the foot patches market share, driven by strong consumer demand for wellness and detoxification products. The region benefits from high disposable incomes, rising awareness of preventive healthcare, and the popularity of natural remedies. E-commerce platforms and well-established retail chains enhance accessibility, boosting adoption across urban and suburban populations. The U.S. dominates the regional landscape, supported by aggressive marketing strategies and frequent product launches. Consumer inclination toward premium, clean-label, and multifunctional patches continues to expand the market, making North America a key contributor to global revenues.
Europe
Europe holds 25% of the market share, supported by its mature personal care and wellness industries. Consumers in this region show a strong preference for natural, eco-friendly, and clean-label products. Regulatory frameworks encouraging safe formulations further strengthen market growth. Countries such as Germany, France, and the U.K. are leading adopters due to their high health awareness and disposable incomes. Foot patches marketed with sustainability claims find strong traction here. Distribution through pharmacies, supermarkets, and online platforms ensures widespread availability, consolidating Europe’s position as one of the leading markets for foot patches globally.
Asia-Pacific
Asia-Pacific leads the global foot patches market with a 35% share, fueled by strong cultural adoption of herbal remedies and holistic health practices. Countries such as China, Japan, and South Korea drive growth with their established beauty and wellness industries. Rising disposable incomes, urbanization, and the popularity of preventive healthcare further stimulate demand. E-commerce growth has significantly boosted accessibility, making foot patches widely available to consumers across both developed and emerging economies. Innovations in multifunctional and herbal-based patches strengthen the region’s dominance, positioning Asia-Pacific as the fastest-growing and largest regional market.
Latin America
Latin America captures 7% of the foot patches market, driven by growing awareness of wellness and self-care products. Brazil and Mexico are leading contributors, supported by expanding retail networks and increasing consumer inclination toward affordable wellness solutions. Rising urbanization and a growing middle-class population encourage adoption of natural and herbal-based products. However, limited clinical validation and price sensitivity restrain faster growth. Online retail platforms are helping manufacturers reach wider audiences, while localized marketing strategies play a critical role in building consumer trust and market penetration in this emerging region.
Middle East & Africa
The Middle East & Africa region represents 5% of the global market share, reflecting its early-stage adoption. Rising disposable incomes, particularly in Gulf countries, and increasing health awareness are key drivers. The region is witnessing growing interest in premium and imported foot patch products, often distributed through pharmacies and specialty wellness stores. However, limited product availability and regulatory barriers pose challenges to faster expansion. South Africa and the UAE show the strongest demand, supported by urban consumer groups. Strategic partnerships with local distributors are essential to unlock growth potential in this region.
Market Segmentations:
By Price Range:
- Mid
- High
By Application:
- Detox
- Pain relief
By End User:
- Individual
- Commercial
By Geography
- North America
- U.S.
- Canada
- Mexico
- Europe
- Germany
- France
- U.K.
- Italy
- Spain
- Rest of Europe
- Asia Pacific
- China
- Japan
- India
- South Korea
- South-east Asia
- Rest of Asia Pacific
- Latin America
- Brazil
- Argentina
- Rest of Latin America
- Middle East & Africa
- GCC Countries
- South Africa
- Rest of the Middle East and Africa
Competitive Landscape
The competitive landscape of the foot patches market features key players such as Groots, Doctor Organic, Medi-7, Avazo Healthcare, Herb-Science, Foot Cure, Kiyome Kinoki, Global Healing, Detox Foot Pads, and BodyPure. The foot patches market is highly competitive, with companies focusing on innovation, product quality, and effective distribution strategies to strengthen their presence. Manufacturers are increasingly developing patches with natural, herbal, and multifunctional formulations to cater to rising consumer demand for clean-label and wellness-focused solutions. E-commerce expansion plays a central role in driving sales, supported by promotional campaigns and subscription-based models. Retail distribution through pharmacies and supermarkets also enhances accessibility, particularly in mature markets. Sustainability in packaging and eco-friendly product positioning are emerging as critical differentiators, while affordability and brand trust remain decisive factors in consumer purchasing decisions.
Key Player Analysis
- Groots
- Doctor Organic
- Medi-7
- Avazo Healthcare
- Herb-Science
- Foot Cure
- Kiyome Kinoki
- Global Healing
- Detox Foot Pads
- BodyPure
Recent Developments
- In July 2025, IFF expanded its Taste division’s RE‑IMAGINE WELLNESS initiative, introducing nutrient-dense flavor solutions for high-protein, weight-management foods that enhance taste without added sugar or salt.
- In May 2025, Galactic launched a new natural oregano flavoring ingredient aimed at enhancing the taste and extending the shelf life of both meat and plant-based protein products. Debuting at IFFA 2025 in Frankfurt, Galimax Flavor O-50 joins the company's Galimax range.
- In October 2024, Edlong Corporation's acquisition of Brisan Group, a company with 30 years of operations in dairy and sweet flavor markets, expanded Edlong's dairy taste technology development capabilities.
- In January 2024, Brookside Flavors and Ingredients completed the acquisition of Sterling Food Flavorings, a manufacturer of flavoring systems for the food and beverage industry. The acquisition strengthens Brookside's product portfolio and expands its offerings to current and potential customers.
Report Coverage
The research report offers an in-depth analysis based on Price Range, Application, End-User and Geography. It details leading market players, providing an overview of their business, product offerings, investments, revenue streams, and key applications. Additionally, the report includes insights into the competitive environment, SWOT analysis, current market trends, as well as the primary drivers and constraints. Furthermore, it discusses various factors that have driven market expansion in recent years. The report also explores market dynamics, regulatory scenarios, and technological advancements that are shaping the industry. It assesses the impact of external factors and global economic changes on market growth. Lastly, it provides strategic recommendations for new entrants and established companies to navigate the complexities of the market.
Future Outlook
- The market will see rising demand for natural and herbal-based formulations.
- E-commerce will continue to drive product visibility and global reach.
- Clean-label and eco-friendly patches will gain stronger consumer acceptance.
- Multifunctional patches offering combined benefits will expand adoption.
- Preventive healthcare trends will reinforce steady market growth.
- Premium product lines will attract health-conscious and high-income consumers.
- Regional expansion in Asia-Pacific will continue to lead global demand.
- Stronger clinical validation will improve consumer trust and credibility.
- Competitive pricing will remain vital in emerging markets.
- Strategic partnerships in retail and wellness channels will boost distribution.
Request a Free Sample
Fill in your details and we'll send you a free sample report.
- Sample data tables & charts
- Research methodology
Need a Custom Version of This Report?
Tailor the scope, geography, or segments to your exact requirements.
- Custom geography or segment scope
- Direct access to our analyst team
Frequently Asked Questions
What is the current market size for Foot Patches Market, and what is its projected size in 2032?
At what Compound Annual Growth Rate is the Foot Patches Market projected to grow between 2025 and 2032?
Which Foot Patches Market segment held the largest share in 2024?
What are the primary factors fueling the growth of the Foot Patches Market?
Who are the leading companies in the Foot Patches Market?
Which region commanded the largest share of the Foot Patches Market in 2024?
Table of Content
Chapter 1. Report Introduction
- 1.1 Report Description & Purpose
- 1.1.1 Report Title & Market Definition
- 1.1.2 Unique Selling Propositions (USP) & Key Differentiators
- 1.1.3 Value Proposition for Stakeholders
- 1.2 Research Objectives
- 1.2.1 Market Sizing Objectives (Volume & Revenue) (Volume Where Applicable)
- 1.2.2 Segmentation Objectives
- 1.2.3 Competitive Intelligence Objectives
- 1.2.4 Forecast & Scenario Objectives
- 1.3 Report Scope
- 1.3.1 Foot Patches Scope – Segments & Subsegments Covered
- 1.3.2 Geographic Scope – Regions & Countries Covered
- 1.3.3 Historical Period, Base Year & Forecast Period (2024; forecast to 2032)
- 1.3.4 Inclusions & Exclusions
- 1.4 Industry Classification & Applicable Codes
- 1.5 Currency, Measurement Units & Valuation Basis
- 1.6 Target Stakeholders
- 1.7 Limitations & Assumptions
Chapter 2. Executive Summary
- 2.1 Global Foot Patches Market Snapshot
- 2.1.1 Market Size – Historical (2024) & Forecast (2024-2032) (2024: USD 2.24 billion → 2032: USD 3.65 billion)
- 2.1.2 Volume & Revenue – Global Totals (Volume Where Applicable)
- 2.1.3 Key Market Highlights – Top Five Facts
- 2.2 Foot Patches Market Segmentation Snapshot
- 2.2.1 Market Split by Region – 2024 vs. 2032
- 2.3 Competitive Snapshot
- 2.3.1 Top 10 Players by Revenue Share – 2024
- 2.3.2 Top 10 Players by Volume Share – 2024 (Volume Where Applicable)
- 2.3.3 Recent Strategic Developments (18-Month Summary)
- 2.4 Key Investment Highlights & Strategic Conclusions
Chapter 3. Foot Patches Market Dynamics & Industry Analysis
- 3.1 Market Overview & Context
- 3.1.1 Foot Patches Market Position in the Broader Industry Value Chain
- 3.1.2 Demand Structure & Purchasing Dynamics
- 3.1.3 Market Maturity & Development Stage by Region
- 3.2 Foot Patches Market Drivers
- 3.3 Foot Patches Market Restraints & Challenges
- 3.4 Foot Patches Market Opportunities
- 3.5 Porter's Five Forces Analysis
- 3.5.1 Threat of New Entrants
- 3.5.2 Bargaining Power of Suppliers
- 3.5.3 Bargaining Power of Buyers
- 3.5.4 Threat of Substitutes
- 3.5.5 Competitive Rivalry – Intensity Assessment
- 3.6 Foot Patches Value Chain Analysis
- 3.6.1 Upstream – Key Inputs, Resources & Suppliers
- 3.6.1.1 Key Input/Resource 1
- 3.6.1.2 Key Input/Resource 2
- 3.6.1.3 Key Input/Resource 3
- 3.6.2 Midstream – Core Operations & Value Creation
- 3.6.2.1 Operating Model & Process Overview
- 3.6.2.2 Key Operating Locations & Capabilities by Company
- 3.6.3 Downstream – Market Channels & End Users
- 3.6.3.1 Direct Sales & Customer Engagement Channels
- 3.6.3.2 Indirect Sales, Intermediaries & Partner Channels
- 3.6.4 Value Chain Profitability Analysis
- 3.6.1 Upstream – Key Inputs, Resources & Suppliers
- 3.7 PESTEL Analysis
- 3.7.1 Political Factors
- 3.7.2 Economic Factors
- 3.7.3 Social Factors
- 3.7.4 Technological Factors
- 3.7.5 Environmental Factors
- 3.7.6 Legal Factors
- 3.8 Foot Patches Supply Chain Analysis
- 3.8.1 Critical Input & Resource Availability Risk Assessment
- 3.8.2 Supplier & Operational Concentration Risk (Geographic Exposure)
- 3.8.3 Supply & Service Disruption Impact Analysis
- 3.9 Regulatory & Policy Landscape
Note: The regulatory and policy landscape section covers regulations based on their applicability to the market, Foot Patches category, geography, and scope of the study. Only regulatory frameworks with a material impact on operations, compliance, trade, sustainability, or market access are analyzed in detail.
Chapter 4. Key Investment Pockets & Opportunity Analysis
- 4.1 Foot Patches Market Attractiveness Analysis
- 4.1.1 By Region – Investment Attractiveness Matrix (Market Size × CAGR)
- 4.2 Absolute Revenue Growth Opportunity
- 4.2.1 By Region – Absolute Revenue Growth Through 2032
- 4.3 Incremental Demand Opportunity
- 4.3.1 By Region – Incremental Demand Through 2032
- 4.3.2 Segment – Incremental Demand
- 4.4 Emerging Submarket Opportunity Deep Dive (Subject to Applicability)
- 4.5 Priority Market Opportunity Scorecards
- 4.5.1 United States
- 4.5.2 Europe
- 4.5.3 Asia
- 4.5.4 Middle East & Africa
Note: Priority market opportunity scorecards reflect the geographic scope and strategic relevance of the study. Listed markets are indicative and may be adapted to the industry.
Chapter 5. Foot Patches Cross-Border Trade & Market Access Analysis
- 5.1 International Trade & Cross-Border Activity Overview
- 5.1.1 Global Export Value by Country (2024)
- 5.1.2 Global Export Volume by Country (2024) (Volume Where Applicable)
- 5.1.3 Global Import Value by Country (2024)
- 5.1.4 Global Import Volume by Country (2024) (Volume Where Applicable)
- 5.1.5 Net Trade Balance by Country (2024)
- 5.2 Export Analysis – Segment
- 5.2.1 Category 1 (Applicable Classification Code)
- 5.2.2 Category 2 (Applicable Classification Code)
- 5.2.3 Category 3 (Applicable Classification Code)
- 5.2.4 Category 4 (Applicable Classification Code)
- 5.2.5 Category 5 (Applicable Classification Code)
- 5.3 Import Analysis – Segment
- 5.3.1 Category 1 (Applicable Classification Code)
- 5.3.2 Category 2 (Applicable Classification Code)
- 5.3.3 Category 3 (Applicable Classification Code)
- 5.3.4 Category 4 (Applicable Classification Code)
- 5.3.5 Category 5 (Applicable Classification Code)
- 5.4 Cross-Border Pricing & Transaction Benchmarks
- 5.4.1 Export Pricing – Segment & Country
- 5.4.2 Import Pricing – Segment & Source Country
- 5.4.3 Price Trends (2024)
- 5.5 Key Cross-Border Trade & Delivery Routes
- 5.5.1 Cross-Border Trade/Delivery Route 1
- 5.5.2 Cross-Border Trade/Delivery Route 2
- 5.5.3 Cross-Border Trade/Delivery Route 3
- 5.5.4 Cross-Border Trade/Delivery Route 4
- 5.5.5 Cross-Border Trade/Delivery Route 5
- 5.6 Trade Policy & Market Access Impact Assessment
- 5.6.1 Tariff & Non-Tariff Barriers
- 5.6.2 Regional Trade & Economic Integration Frameworks
- 5.6.3 Bilateral & Multilateral Trade Agreements
- 5.6.4 Cross-Border Operating, Licensing & Localization Requirements
Note: This chapter applies where cross-border trade or delivery is relevant to Foot Patches. Goods, services, and digital offerings are assessed using applicable classifications and transaction measures. Import-export volumes, trade balances, and route analyses are included only where meaningful to the market.
Chapter 6. Competitive Landscape & Company Benchmarking
- 6.1 Foot Patches Market Concentration & Structure
- 6.1.1 Herfindahl-Hirschman Index (HHI) – vs. 2024
- 6.1.2 Leading, Mid-Sized & Emerging Player Structure
- 6.1.3 Global, Regional & Local Player Dynamics
- 6.2 Foot Patches Market Share Analysis – 2024
- 6.2.1 Global Revenue Share by Company
- 6.2.2 Global Volume Share by Company (Volume Where Applicable)
- 6.2.3 Regional Revenue Share
- 6.2.4 Market Share Evolution ( vs. 2024)
- 6.2.5 Company Market Share by Key Segment
- 6.2.6 Company Market Share by Customer Group
- 6.3 Operating Scale, Capacity & Infrastructure Analysis
- 6.3.1 Global Operating Scale & Supply Capacity
- 6.3.2 Resource Utilization & Operating Efficiency
- 6.3.3 Output, Service Delivery & Activity Metrics
- 6.3.4 Operating Footprint & Infrastructure Map
- 6.3.5 Planned Operational & Capacity Expansion
- 6.4 Foot Patches Competitive Benchmarking Matrix
- 6.4.1 Revenue, Growth, Profitability & Operating Metric Comparison
- 6.4.2 Channel Revenue Mix
- 6.4.3 Geographic Revenue Exposure
- 6.4.4 R&D Intensity
- 6.4.5 Sustainability Maturity
- 6.5 Strategic Developments in Foot Patches (Last 24 Months)
- 6.5.1 Mergers, Acquisitions & Divestments
- 6.5.2 New Products, Services & Solutions in Foot Patches
- 6.5.3 Operational & Infrastructure Expansions
- 6.5.4 Strategic Alliances, Joint Ventures & Partnerships
- 6.5.5 Distribution Expansion & Market Entry
- 6.5.6 Sustainability & ESG Initiatives
- 6.6 Competitive Strategy Mapping
- 6.6.1 Leader, Challenger, Follower & Niche Classification
- 6.6.2 Pricing Strategy Comparison
- 6.6.3 Channel Strategy Matrix
Note: Strategic developments are included based on their materiality and the availability of reliable information.
Chapter 7. Global Foot Patches Market – By Sales & Delivery Channel
- 7.1 Segment Overview
- 7.1.1 Volume & Revenue Split by Channel (2024 & 2032) (Volume Where Applicable)
- 7.1.2 Channel Mix Evolution (2024-2032)
Chapter 8. Regional Market Analysis – Global Overview
- 8.1 Global Regional Overview
- 8.1.1 Regional Volume Share (Volume Where Applicable)
- 8.1.2 Regional Revenue Share
- 8.1.3 Regional Volume by Region (Volume Where Applicable)
- 8.1.4 Regional Revenue by Region
- 8.1.5 Regional Forecast Through 2032
- 8.2 Cross-Regional Segment Analysis
- 8.2.1 By Sales & Delivery Channel
- 8.2.2 By Competitive Positioning & Price Tier
Chapter 9. North America Foot Patches Market
- 9.1 United States
- 9.2 Canada
- 9.3 Mexico
Chapter 10. Europe Foot Patches Market
- 10.1 Germany
- 10.2 France
- 10.3 Italy
- 10.4 United Kingdom
- 10.5 Spain
- 10.6 Poland
- 10.7 Russia
- 10.8 Netherlands
- 10.9 Belgium
- 10.10 Sweden
- 10.11 Denmark
- 10.12 Norway
- 10.13 Rest of Europe
Chapter 11. Asia Pacific Foot Patches Market
- 11.1 China
- 11.2 India
- 11.3 Japan
- 11.4 South Korea
- 11.5 Thailand
- 11.6 Indonesia
- 11.7 Vietnam
- 11.8 Malaysia
- 11.9 Australia
- 11.10 Rest of Asia Pacific
Chapter 12. Latin America Foot Patches Market
- 12.1 Brazil
- 12.2 Argentina
- 12.3 Colombia
- 12.4 Chile
- 12.5 Rest of Latin America
Chapter 13. Middle East Foot Patches Market
- 13.1 Saudi Arabia
- 13.2 United Arab Emirates
- 13.3 Turkey
- 13.4 Israel
- 13.5 Iran
- 13.6 Rest of the Middle East
Chapter 14. Africa Foot Patches Market
- 14.1 South Africa
- 14.2 Egypt
- 14.3 Nigeria
- 14.4 Morocco
- 14.5 Rest of Africa
Chapter 15. Foot Patches Company Profiles
- 15.1 [Company 01]
- 15.1.1 Company Overview
- 15.1.2 Key Management Personnel
- 15.1.3 Products & Services Portfolio
- 15.1.4 Financial Performance
- 15.1.5 Key Market Focus & Geographic Presence
- 15.1.6 Recent Developments & Strategic Initiatives
Note: The company profile list is preliminary and may change based on research findings, market developments, data availability, and client requirements.
Chapter 16. Appendices
- Appendix A – List of Abbreviations & Acronyms
- Appendix B – Industry Classification Code Reference – Full Series
- Appendix C – Supply, Output & Operating Capacity Data Tables
- Appendix D – End-Use & Demand Base Tables
- Appendix E – Demand, Adoption & Usage Assumptions
- Appendix F – Pricing & Revenue Metric Reference Tables
- Appendix G – Company Operations & Infrastructure Database
- Appendix H – Cross-Border Trade & Activity Data Tables (Where Applicable)
- Appendix I – Regulatory Summary Tables
- Appendix J – Primary Research Participant List (Anonymized)
- Appendix K – Primary Research Questionnaire Framework
- Appendix L – Data Sources & Bibliography
- Appendix M – Market Size Divergence & Source Comparison
Chapter 17. Research Methodology
- 17.1 Research Framework & Philosophy
- 17.2 Secondary Research – Sources, Hierarchy & Data Extraction
- 17.3 Data Modeling – Bottom-Up & Top-Down Market Sizing
- 17.4 Primary Research – Stakeholder Framework, LOI & Sample Sizes
- 17.5 Forecast Methodology – Regression, Scenario & Sensitivity Analysis
- 17.6 Quality Control – Four-Layer Validation Framework
- 17.7 Limitations & Standard Assumptions
- 17.8 Disclaimer
