Market Overview:
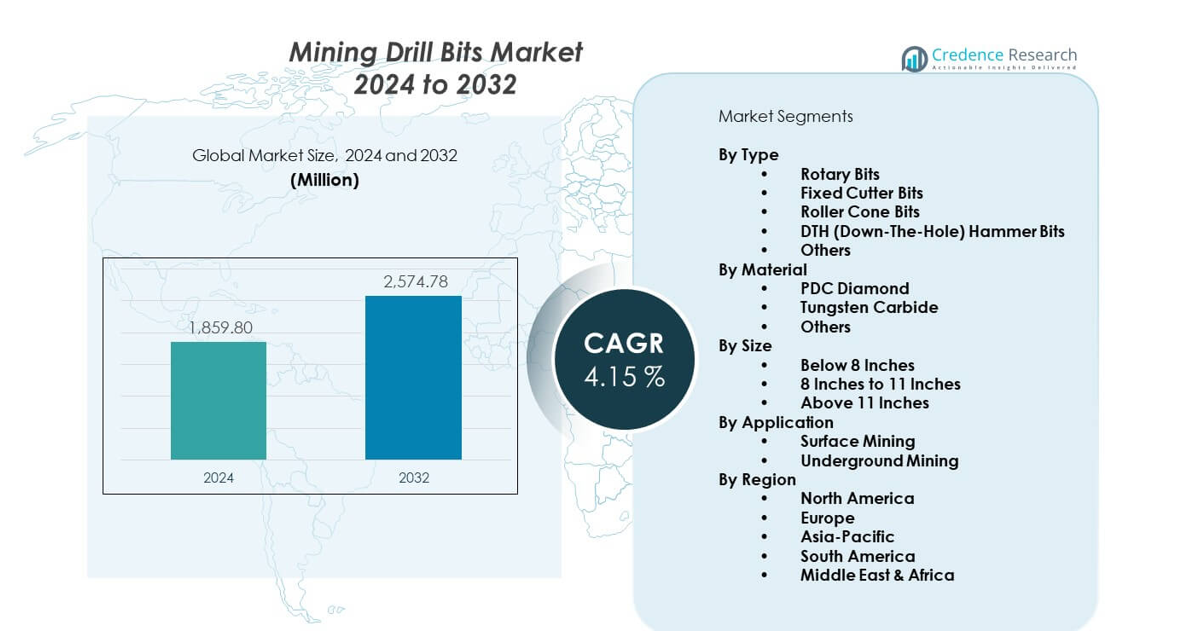
The Mining Drill Bits Market is projected to grow from USD 1,859.8 million in 2024 to an estimated USD 2,574.78 million by 2032, with a compound annual growth rate (CAGR) of 4.15% from 2024 to 2032.
| REPORT ATTRIBUTE |
DETAILS |
| Historical Period |
2020-2023 |
| Base Year |
2024 |
| Forecast Period |
2025-2032 |
| Mining Drill Bits Market Size 2024 |
USD 1,859.8 million |
| Mining Drill Bits Market, CAGR |
4.15% |
| Mining Drill Bits Market Size 2032 |
USD 2,574.78 million |
Rising mineral exploration boosts the need for durable drill bits across global sites. Mining firms invest in stronger tungsten carbide and PDC designs to handle abrasive rock layers. Automation in drilling rigs drives steady demand for precision-engineered bits that support faster cycles. Firms replace outdated tools to reduce downtime and improve drilling accuracy. Growth in coal, metal, and quarrying activities also supports broader adoption of advanced bit types. These improvements help operators raise productivity and maintain stable output across large extraction zones.
North America leads due to strong metal and shale mining activity supported by high equipment adoption. Asia Pacific emerges as a fast-growing region as China, India, and Australia expand exploration for coal, iron ore, and critical minerals. Europe maintains steady demand from quarrying and industrial mineral extraction. Latin America strengthens its position with large copper and lithium projects. The Middle East and Africa gain traction as new mines open across gold, phosphate, and base-metal belts, pushing up need for robust drilling tools.
Market Insights:
- The Mining Drill Bits Market reached USD 1,859.8 million in 2024 and is projected to hit USD 2,574.78 million by 2032, registering a CAGR of 4.15%, supported by deeper drilling targets and stronger demand for high-durability bits.
- North America (32%), Asia-Pacific (29%), and Europe (18%) hold the largest shares due to strong metal extraction, high fleet modernization rates, and stable quarrying activity supported by well-established mining infrastructures.
- Asia-Pacific, holding 29%, ranks as the fastest-growing region driven by expanding coal, copper, and critical mineral exploration in China, India, and Australia.
- Rotary bits account for over 40% of total demand due to broad compatibility and consistent penetration rates across varied formations.
- PDC diamond bits represent nearly 35% of material usage, driven by rising preference for long-life cutting structures in abrasive drilling environments.
Access crucial information at unmatched prices!
Request your sample report today & start making informed decisions powered by Credence Research Inc.!
Download Sample
Market Drivers:
Strong Demand for Higher Penetration Rates in Hard Rock Mining
Mining Drill Bits Market demand rises due to deeper resource extraction across major sites. Operators prefer bits that maintain stable penetration during long drilling cycles. Firms deploy advanced carbide grades to handle abrasive surfaces with consistent performance. It supports lower tool replacement and helps reduce overall downtime for large teams. Producers introduce tougher edge geometries to enhance cut quality during rugged field activity. Growth in metal mining strengthens interest in bits that sustain uniform performance under pressure. Drilling contractors seek tools that maintain accuracy across mixed formations. Expanding exploration programs lift adoption of premium-grade designs.
- For instance, Sandvik’s PowerCarbide grades (e.g., GC80 and SH70) demonstrated up to 30% longer service life in hard-rock DTH drilling during field trials.
Growing Shift Toward Mechanized and Automated Drilling Systems
Automation drives wider use of precision-built bits that match machine-controlled drilling paths. Mining Drill Bits Market suppliers create products that fit automated rigs with high repeat accuracy. Many mines depend on consistent bit quality to support 24-hour fleet cycles across sites. It helps drilling teams maintain smoother workflows under tightened production goals. Remote-operated rigs require bits that handle vibration with stable cutting behaviour. Increased mechanization boosts interest in bits that tolerate thermal shock. Advanced rigs demand tools with predictable behaviour during varied depth levels. Producers refine manufacturing processes to meet rising accuracy standards.
- For instance, Epiroc’s autonomous Pit Viper 271 system uses drill strings paired with optimized bits and has logged more than 5 million autonomous meters with vibration-controlled bit performance.
Rising Adoption of Premium Coatings for Long Service Life and Reduced Wear
Producers use diamond-enhanced coatings that extend bit life under harsh drilling loads. Mining Drill Bits Market operators gain value through longer cycles between replacements. It improves project planning for teams handling multiple boreholes in short windows. Hard coatings support uniform drilling during transitions between soft and hard layers. Companies rely on these upgraded surfaces to limit chipping across complex formations. Coated bits help maintain edge stability for high-speed drilling tasks. Firms use material upgrades to support deeper operations with reduced maintenance demands. Demand strengthens in mines with aggressive expansion programs.
Expansion of Critical Mineral Exploration Across New Geological Zones
Large exploration budgets push operators to adopt bits designed for varied terrain profiles. Mining Drill Bits Market growth links to rising surveys for copper, lithium, and rare earth deposits. It helps geologists collect deeper core samples with high structural accuracy. Firms integrate stronger tool designs to support drilling in remote and hard-to-access belts. Increased mapping activity raises interest in bits that deliver clean cores. Exploration teams depend on durable tools to reduce logistical load across far-reach zones. New mineral policies encourage procurement of high-end drilling components. Demand shifts toward versatile bit types suited for diverse rock behaviour.
Market Trends
Greater Movement Toward Hybrid Bit Designs Supporting Multiple Rock Behaviors
Mining Drill Bits Market trends indicate strong interest in hybrid geometries for mixed formations. Operators choose bits that reduce tool changes across wide sections. It improves workflow speed for contractors managing large drilling zones. Producers design hybrid structures to maintain stable cut paths during depth variation. Mining fleets favour tools that reduce bounce under layered formations. Firms use hybrid tools to adapt quickly to rapid geological shifts. Demand rises for bits offering balance between speed and control. These designs gain traction across exploration and production drills.
- For instance, Robit’s CrossFlow hybrid bit technology showed up to 20% improved flushing efficiency in alternating rock layers, reducing tool change frequency in multi-formation drilling.
Increasing Use of Real-Time Bit Performance Analytics in Drilling Operations
Mining Drill Bits Market vendors offer sensors that track bit wear during deep-hole activity. Digital systems help crews respond faster to vibration changes across heavy rigs. It supports predictive decisions that reduce unplanned stoppage during campaigns. Mines use data dashboards to monitor bit rotation behaviour at high depth levels. Real-time feedback helps refine drilling parameters for better cut stability. Teams use performance logs to adjust future equipment selection. Analytics helps operators evaluate bit life under specific formations. Data-driven insights gain strong acceptance in modern drilling programs.
- For instance, Caterpillar’s MineStar system integrates bit performance telemetry, enabling rigs to reduce unplanned downtime through real-time vibration and rotation data.
Shift Toward Eco-Efficient Manufacturing Processes for Sustainable Bit Production
Mining Drill Bits Market producers redesign factories to reduce waste across tungsten processing. Many suppliers optimize sintering cycles to cut energy load. It lowers environmental burden while improving material yield ratios. Firms adopt recyclable packaging to meet sustainability norms set by global buyers. Production units use cleaner fuel sources to support low-emission operations. Large mines prefer partners that demonstrate clear sustainability benchmarks. Suppliers integrate robotic handling to improve accuracy and reduce scrap. Demand grows for tools produced through verifiable green workflows.
Broader Adoption of High-Torque Drill Bits for Ultra-Deep Mining Activities
Mining Drill Bits Market buyers increase interest in bits designed for extreme torque conditions. High-strength bodies support greater impact load during ultra-deep drilling levels. It enables rigs to maintain full contact under intense formation pressure. Producers reinforce tool shoulders to prevent early damage under heavy torsion. Mines require bits that maintain straight paths despite intense mechanical stress. High-torque designs support advanced drilling programs across iron ore and hard-rock belts. These tools help reduce deviation during directional drilling projects. Adoption expands among contractors operating in deep-level mines.
Market Challenges Analysis:
High Wear Rates and Tool Fatigue Across Abrasive Formations Limiting Operational Efficiency
Mining Drill Bits Market faces pressure due to extreme wear across abrasive zones. High-silica formations erode cutting edges quickly during repeated cycles. It forces drilling contractors to replace tools earlier than planned. Frequent downtime disrupts workflow stability at large mine sites. Bit breakage risk increases when rigs face sudden hardness variation during penetration. Suppliers struggle to balance cost and durability for low-margin mining teams. Wear patterns also differ across regions, complicating inventory planning for service units.
Supply Chain Volatility and Material Cost Pressure Restricting Procurement Flexibility
Mining Drill Bits Market operators experience instability due to tungsten price fluctuation. Many suppliers depend on limited material sources for carbide production. It creates unpredictable procurement cycles that disrupt project timelines. Logistics delays increase downtime for remote mines requiring frequent resupply. Geopolitical shifts influence raw material flow across major manufacturing hubs. Production teams face difficulty maintaining consistent specifications under unstable supply conditions. Contract negotiations often require adjustment to compensate for uncertain cost structures.
Market Opportunities:
Rapid Expansion of Critical Mineral Projects Creating Demand for High-Precision Drilling Tools
Mining Drill Bits Market gains new opportunities through rising activity in lithium, copper, and rare earth projects. Governments promote exploration zones that encourage higher drilling intensity. It supports demand for precision bits able to collect clean cores for analysis. New mineral clusters require rugged tools capable of handling unpredictable formations. Suppliers develop high-accuracy structures to help crews reduce deviations. Many survey teams seek tools that support extended reach across remote belts. Strong exploration pipelines open avenues for premium bit categories.
Growing Replacement Cycles Driven by Automation and Fleet Modernization Initiatives
Mining Drill Bits Market benefits from mine operators upgrading fleets to match automated rigs. Modern systems require bits built for predictable performance under machine-guided motion. It lifts replacement cycles and boosts procurement of advanced designs. Firms seek tools compatible with real-time monitoring systems embedded in rigs. Wider adoption of autonomous drills increases interest in bits with stable vibration response. Manufacturers expand product lines supporting both high-speed and high-torque drilling patterns. These shifts open new revenue streams for premium-grade components.
Market Segmentation Analysis:
By Type
Mining Drill Bits Market growth links to strong use of rotary bits across large drilling fleets due to stable penetration and wide compatibility with multiple rigs. Fixed cutter bits gain demand in hard-rock zones where crews prefer higher durability and fewer tool changes. Roller cone bits hold steady use in mixed formations that require balanced cutting action. DTH hammer bits record strong adoption in deep mining where high-impact force supports faster progress. Other bit types serve niche applications across specialized geological zones.
- For instance, Rockmore International’s ROK series DTH hammers, incorporating patented SonicFlow technology, optimize internal air paths to minimize turbulence and deliver more impact energy, which contributes to higher penetration rates. Similarly, their bits with innovative MultiPoint carbide inserts offer multiple strike points for more efficient rock fracture, with field results showing around a 10% increase in penetration rates and extended bit life compared to standard designs.
By Material
PDC diamond bits lead due to strong wear resistance and long service cycles across abrasive formations. It supports higher productivity for mines with deeper drilling targets. Tungsten carbide remains a key choice for heavy-duty rock sections that require strong edge retention. Other materials maintain limited use in operations focused on low-intensity drilling tasks or cost-sensitive programs.
- For instance, Mitsubishi Materials’ tungsten carbide inserts used in mining bits have shown hardness levels above 1,700 HV, supporting strong resistance in abrasive granite and quartz formations.
By Size
Below 8-inch bits serve compact rigs used in exploration or shallow drilling paths. The 8 to 11-inch range records strong demand from production crews that prefer balanced penetration and cost efficiency. Above 11-inch bits support heavy drilling programs across large open-pit and deep underground sites. It helps operators handle broad borehole requirements with stable performance.
By Application
Surface mining dominates due to large-scale drilling needs across metal, coal, and aggregate operations. Underground mining gains momentum through expanding development drives and deeper resource access. It supports steady demand for durable and high-impact bit designs suited for tight and rugged environments.
Segmentation:
By Type
- Rotary Bits
- Fixed Cutter Bits
- Roller Cone Bits
- DTH (Down-The-Hole) Hammer Bits
- Others
By Material
- PDC Diamond
- Tungsten Carbide
- Others
By Size
- Below 8 Inches
- 8 Inches to 11 Inches
- Above 11 Inches
By Application
- Surface Mining
- Underground Mining
By Region
- North America
- Europe
- Germany
- France
- U.K.
- Italy
- Spain
- Rest of Europe
- Asia Pacific
- China
- Japan
- India
- South Korea
- South-east Asia
- Rest of Asia Pacific
- Latin America
- Brazil
- Argentina
- Rest of Latin America
- Middle East & Africa
- GCC Countries
- South Africa
- Rest of the Middle East and Africa
Regional Analysis:
North America
Mining Drill Bits Market presence remains strong in North America, where the region holds the largest market share due to extensive metal, shale, and aggregate mining activity. Operators invest in high-durability bits that support deep drilling programs across the United States and Canada. It benefits from strong adoption of automated rigs that require precision-engineered tools. Suppliers expand service networks to support large fleets across major mining belts. Growth in copper, gold, and industrial mineral projects sustains steady procurement cycles. The region maintains leadership through advanced drilling technology and consistent capital spending.
Asia-Pacific
Asia-Pacific secures the second-largest market share, driven by high mineral extraction across China, India, and Australia. Mining Drill Bits Market expansion in this region links to rising exploration budgets and deeper drilling targets across coal and metal deposits. It supports strong demand for rotary and DTH hammer bits in heavy-duty operations. Local producers widen their product portfolios to match the needs of large open-pit and underground mines. Strong industrialization rates push operators to upgrade fleets for higher penetration efficiency. The region records fast growth due to expanding resource development programs.
Europe, South America, and Middle East & Africa
Europe holds a moderate market share supported by quarrying, industrial minerals, and selective metal mining projects across Germany, the UK, and Nordic countries. It maintains interest in premium-grade bits that offer stable performance in complex geological zones. South America captures a notable share through rapid development across copper, iron ore, and lithium mines in Chile, Brazil, and Peru. Middle East & Africa secures an emerging share supported by expanding gold, phosphate, and base metal projects. It records rising demand for high-impact and wear-resistant designs suited for tough formations. These regions continue strengthening their positions through new exploration initiatives and rising investment cycles.
Shape Your Report to Specific Countries or Regions & Enjoy 30% Off!
Key Player Analysis:
- Sandvik AB
- Epiroc AB
- Caterpillar Inc.
- Mitsubishi Materials Corporation
- Robit Plc
- Rockmore International
- Changsha Heijingang Industrial Co. Ltd.
- Universal Drilling Technique, LLC
- MICON Drilling GmbH
- Brunner and Lay Inc.
Competitive Analysis:
Mining Drill Bits Market competition features global manufacturers that invest in advanced materials and precision engineering. Leading companies strengthen portfolios with rotary, fixed cutter, and DTH designs that meet deeper and harder drilling requirements. It drives suppliers to focus on wear resistance, thermal stability, and improved bit life to support heavy mining fleets. Firms expand distribution networks to support rapid service needs across remote belts. Strategic focus moves toward premium-grade carbide and PDC technologies that deliver consistent performance. Competitors also integrate digital tools that help users monitor bit health and plan replacement cycles with greater accuracy.
Recent Developments:
- In November 2025, Epiroc AB unveiled its next‑generation PCD (polycrystalline diamond) drill bits, designed for abrasive ground and high‑precision drilling, delivering markedly longer service life, fewer bit changes and lower total drilling cost for surface mining, underground development and construction customers that rely on advanced mining drill bits.
- In October 2025, Mitsubishi Materials Corporation celebrated the opening and first shipment from a new rock‑tools plant at OTEC in Thailand, a facility built to meet growing global demand for mining bits and rods and to eventually double rod manufacturing capacity, thereby strengthening its supply reliability and responsiveness in the mining drill bits market.
- In September 2024, Caterpillar Inc. announced an automation‑focused product update for the Cat MD6310 rotary blasthole drill, integrating Drill Assist and Auto Drill functions that automatically manage mast positioning, hole depth and drill‑string parameters, improving hole quality, productivity and extending the life of rotary drill bits used in large open‑pit mining patterns.
Report Coverage:
The research report offers an in-depth analysis based on Type, Material, Size, and Application. It details leading market players, providing an overview of their business, product offerings, investments, revenue streams, and key applications. Additionally, the report includes insights into the competitive environment, SWOT analysis, current market trends, as well as the primary drivers and constraints. Furthermore, it discusses various factors that have driven market expansion in recent years. The report also explores market dynamics, regulatory scenarios, and technological advancements that are shaping the industry. It assesses the impact of external factors and global economic changes on market growth. Lastly, it provides strategic recommendations for new entrants and established companies to navigate the complexities of the market.
Future Outlook:
- Demand rises for bits that enhance drilling accuracy across deeper deposits.
- Adoption grows for carbide and PDC designs with improved service life.
- Automation pushes need for tools compatible with sensor-enabled drilling rigs.
- Remote mines require durable bits that handle extreme geological shifts.
- Sustainability trends lift interest in energy-efficient manufacturing practices.
- Digital monitoring systems support better maintenance planning.
- Investment increases in minerals used for energy transition.
- Suppliers expand production to match stronger global exploration activity.
- Hybrid geometries gain relevance for mixed formation drilling.
- Service partnerships strengthen to support fleet modernization across regions.


