Market overview
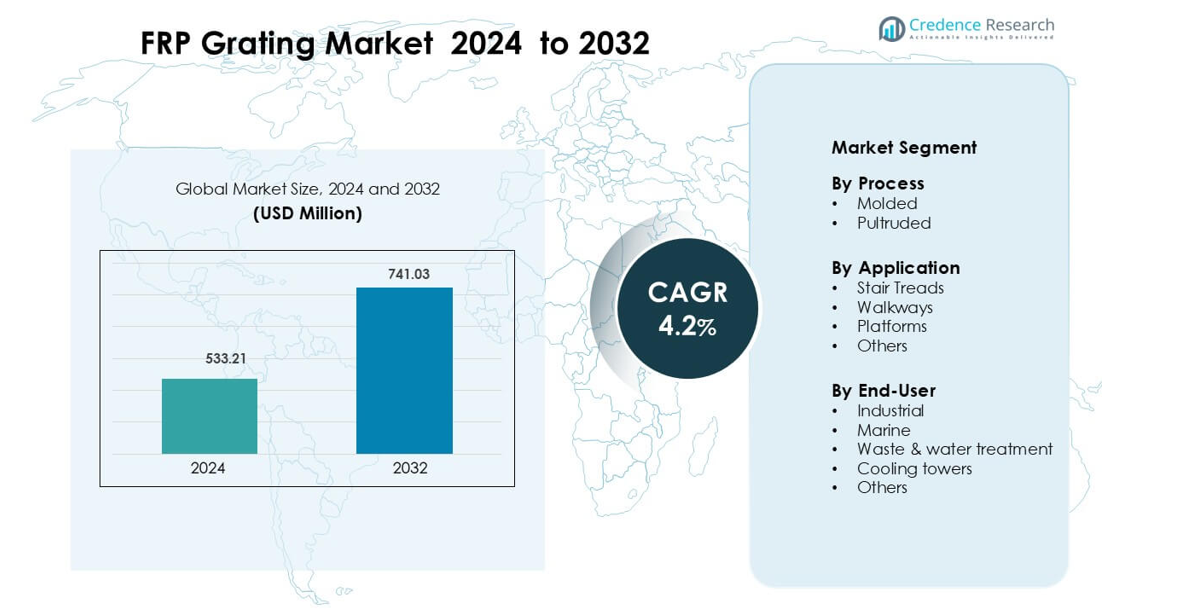
FRP Grating Market was valued at USD 533.21 million in 2024 and is anticipated to reach USD 741.03 million by 2032, growing at a CAGR of 4.2 % during the forecast period.
| REPORT ATTRIBUTE |
DETAILS |
| Historical Period |
2020-2023 |
| Base Year |
2024 |
| Forecast Period |
2025-2032 |
| FRP Grating Market Size 2024 |
USD 533.21 million |
| FRP Grating Market, CAGR |
4.2% |
| FRP Grating Market Size 2032 |
USD 741.03 million |
The FRP grating market is shaped by major companies such as Eurograte Fiberglass Grating, National Grating, Creative Pultrusions, AGC Matex Co. Ltd, Bedford Reinforced Plastics, Fibrolux GmbH, Ferrotech International FZE, Aeron Composite, Delta Composites LLC, and Fibergrate Composite Structures Ltd, all of which compete through corrosion-resistant materials, advanced molding processes, and project-specific customization. These players strengthen their market position by expanding product lines for industrial, marine, and water treatment applications while enhancing distribution networks. North America leads the global market with a 34% share in 2024, driven by strong adoption across chemical plants, wastewater facilities, and offshore infrastructure projects.
Market Insights
- The FRP grating market was valued at USD 533.21 million in 2024 and is projected to reach USD 741.03 million by 2032, growing at a CAGR of about 4.2%.
- Growth is driven by rising demand for corrosion-resistant flooring in chemical plants, marine structures, wastewater facilities, and cooling towers, with molded FRP holding nearly 57% share in 2024.
- Key trends include wider adoption of lightweight platforms, slip-resistant walkways, and fire-retardant grating in modular industrial facilities and offshore wind projects.
- Competition intensifies as major companies enhance pultrusion capabilities, expand global supply networks, and launch customized grating systems for industrial and marine sectors.
- North America leads with a 34% share in 2024, followed by Asia Pacific at 30% and Europe at 28%, while walkways remain the dominant application with about 44% share.
Access crucial information at unmatched prices!
Request your sample report today & start making informed decisions powered by Credence Research Inc.!
Download Sample
Market Segmentation Analysis:
By Process
Molded FRP grating leads this segment with about 57% share in 2024 due to its strong load-bearing strength, uniform resin distribution, and resistance to corrosion in harsh industrial areas. Users choose molded variants for chemical plants, desalination units, and offshore structures because the grating performs well under impact and reduces maintenance needs. Pultruded grating grows at a steady pace as facilities upgrade to high-strength designs for long-span platforms and structural applications where stiffness and directional strength matter.
- For instance, Satyam Composites is an actual manufacturer of FRP grating with a manufacturing facility, and 38mm thickness is a common standard size for such products.
By Application
Walkways dominate this segment with nearly 44% share in 2024 as industries adopt FRP grating for safe, anti-slip access paths across chemical sites, marine decks, and processing plants. Rising safety standards and the need to control corrosion in humid or chemical-exposed zones boost this demand. Stair treads and platforms expand with wider use in elevated structures and modular plant layouts, while other applications grow as infrastructure managers shift from metal to lightweight composite materials.
- For instance, Satyam Composites molded FRP walkway panels of 38 mm thickness weigh just ~18 kg/m² and deliver a uniformly distributed load capacity of 250 kg/m², and these have been installed in chemical-plant access corridors to reduce maintenance in highly acidic process areas.
By End-User
The industrial sector holds the leading position with around 49% share in 2024 driven by heavy adoption in chemical processing, power generation, and manufacturing plants. Operators prefer FRP grating because the material withstands corrosive spills, reduces downtime, and offers long service life. Marine and waste & water treatment facilities show rising uptake as operators replace steel with non-conductive, rust-free alternatives. Cooling towers and other end-users expand with retrofitting projects focused on durability and worker safety.
Key Growth Drivers
Growing Shift Toward Corrosion-Resistant Infrastructure
Demand rises as industries replace steel grating with FRP solutions to improve long-term performance and safety in corrosive environments. Chemical plants, desalination units, offshore platforms, and wastewater facilities adopt FRP because the material withstands saltwater, chemicals, humidity, and UV exposure without rusting. This shift reduces maintenance budgets, extends operational life, and minimizes shutdowns for repairs. Governments and private operators also upgrade aging infrastructure, creating steady adoption for corrosion-resistant materials. The ability of FRP to maintain structural integrity under harsh conditions positions it as a preferred option for modern industrial and marine facilities worldwide.
- For instance, at a chemical-processing plant in Altamira, Mexico, Fibergrate replaced over 250 m² of corroded steel platforms and railings with their molded FRP grating and structural shapes; after five years in service, the FRP system exhibited no measurable loss in structural strength despite constant exposure to acid vapors and salt-laden air.
Rising Focus on Worker Safety and Compliance Standards
Global safety regulations encourage companies to install slip-resistant, fire-retardant, and lightweight materials in operational areas, which drives strong demand for FRP grating. Industrial sites, power plants, and marine platforms adopt FRP walkways, platforms, and stair treads to reduce fall incidents and improve mobility in wet or chemical-exposed zones. The non-conductive nature of FRP also supports safer use near electrical equipment. As enforcement increases across developing economies, organizations invest in durable workplace flooring that aligns with OSHA-equivalent standards. These factors strengthen the long-term growth path of FRP grating across high-risk operational environments.
- For instance, Fibergrate’s pultruded FRP gratings are engineered to a flame-spread rating of 25 or less per ASTM E-84, making them fire-retardant while also being electrically non-conductive.
Increasing Adoption in Water & Wastewater Treatment Projects
Rapid urbanization and rising environmental concerns push governments to expand wastewater and water recycling facilities, fueling greater use of FRP grating. Treatment plants prefer FRP due to its corrosion resistance, ease of installation, and longevity when exposed to chemicals, moisture, and biological agents. The material also supports safe maintenance access around aeration tanks, clarifiers, and chemical dosing areas. Global spending on municipal and industrial wastewater modernization strengthens this trend. As countries invest in sustainable water management, FRP grating becomes a key component for meeting operational reliability, worker safety, and cost-efficient plant upgrades.
Key Trends and Opportunities
Expansion of Modular Industrial Facilities
Industries increase the use of modular structures and prefabricated units, boosting demand for lightweight and easy-to-install FRP grating. These gratings integrate well into modular walkways, elevated platforms, and compact treatment systems due to their portability and low installation labor. Growth in compact chemical plants, skid-mounted equipment, and prefabricated wastewater units strengthens this trend. Companies prefer FRP because it enables faster project completion and reduces onsite fabrication needs, making it valuable for fast-track industrial expansion.
- For instance, in a Canadian chemical-company project, Fibergrate delivered a prefabricated service-platform system using molded and pultruded FRP grating along with Dynaform structural shapes, which were fully test-assembled offsite; when installed, each platform section (measuring ~ 3 m × 1.2 m) was handled manually by two workers, avoiding the need for heavy field welding or cutting.
Growing Marine and Offshore Applications
Marine operators adopt FRP grating at a faster rate due to rising corrosion challenges in offshore wind installations, coastal terminals, and ship decks. The material improves durability against saltwater, wave impact, and UV radiation. Offshore wind projects also favor FRP for maintenance walkways and platform safety upgrades. As global renewable energy investments rise, FRP finds increasing use in harsh marine conditions where metals degrade quickly, creating a strong opportunity for market expansion.
Key Challenges
High Initial Material and Installation Costs
Despite long-term savings, the upfront cost of FRP grating remains higher than traditional steel alternatives. Many small and mid-sized facilities hesitate to adopt FRP due to budget constraints or limited awareness of lifecycle cost benefits. Specialized fabrication, resin systems, and manufacturing processes add to product pricing. Installation often requires trained teams familiar with composite materials. These cost barriers can slow adoption in developing regions, particularly in low-margin industries and public sector projects where initial capital approval is difficult.
- For instance, according to Creative Fibrotech, FRP components (like pultruded panels) cost between ₹150–₹300 per kg, compared to mild steel at ₹80–₹110 per kg, meaning FRP can be up to 150% more expensive at the outset.
Limited Recycling and End-of-Life Handling Infrastructure
FRP grating poses challenges at the end of its service life due to limited recycling options for fiber-reinforced composites. The thermoset resins used in FRP cannot be remelted, requiring specialized recycling processes that are not widely available. As sustainability pressure grows, industries face concerns related to disposal, landfill contribution, and regulatory compliance. The lack of standardized recycling pathways restricts adoption in regions with strict environmental regulations. Manufacturers explore mechanical and chemical recycling methods, but large-scale implementation remains slow.
Regional Analysis
North America
North America holds the largest share in the FRP grating market at about 34% in 2024 due to strong demand from chemical processing, oil and gas, marine docks, and wastewater treatment facilities. Industries adopt FRP grating to replace corroded steel structures and improve workplace safety. Investment in wastewater upgrades across the U.S. and Canada strengthens replacement demand. Offshore wind and coastal infrastructure projects also support wider use of lightweight, corrosion-resistant materials. Strict safety regulations and higher adoption of non-conductive platforms further reinforce the region’s leadership.
Europe
Europe accounts for nearly 28% share in 2024, supported by strong adoption across chemical plants, maritime terminals, and industrial manufacturing sites. EU environmental policies encourage corrosion-resistant and low-maintenance materials, which drives wider use of FRP walkways and platforms. Expansion of offshore wind farms in the U.K., Germany, and the Netherlands boosts demand for durable gratings. Wastewater modernization programs across Southern and Eastern Europe add to growth. Strict worker-safety compliance further increases the preference for slip-resistant and fire-retardant FRP grating.
Asia Pacific
Asia Pacific holds about 30% share in 2024 and grows the fastest due to rapid industrialization, expansion of chemical processing hubs, and rising maritime trade in China, India, Japan, and Southeast Asia. Governments invest heavily in wastewater treatment and desalination projects, increasing FRP adoption in corrosive operating zones. Manufacturers expand local production capacity to meet rising demand for lightweight, low-maintenance infrastructure materials. Growth in cooling towers, power plants, and industrial walkways strengthens the region’s long-term outlook.
Latin America
Latin America captures roughly 5% share in 2024 with steady demand from petrochemical facilities, mining operations, and municipal water treatment plants. Countries such as Brazil, Chile, and Mexico adopt FRP grating to improve durability in humid and corrosive environments. Upgrades in port infrastructure and offshore operations also support incremental demand. Budget constraints and slower industrial modernization limit broader adoption, but rising safety regulations and interest in long-life materials help maintain market expansion.
Middle East & Africa
The Middle East & Africa region holds nearly 3% share in 2024, driven by adoption in desalination plants, oil and gas facilities, and industrial cooling towers. FRP grating is preferred for its resistance to saltwater, high temperatures, and chemical exposure common in regional operations. GCC countries invest in large-scale water treatment and infrastructure upgrades, supporting market penetration. Africa shows gradual growth with mining and energy developments. However, lower awareness and limited local production constrain faster adoption.
Market Segmentations:
By Process
By Application
- Stair Treads
- Walkways
- Platforms
- Others
By End-User
- Industrial
- Marine
- Waste & water treatment
- Cooling towers
- Others
By Geography
- North America
- Europe
- Germany
- France
- U.K.
- Italy
- Spain
- Rest of Europe
- Asia Pacific
- China
- Japan
- India
- South Korea
- South-east Asia
- Rest of Asia Pacific
- Latin America
- Brazil
- Argentina
- Rest of Latin America
- Middle East & Africa
- GCC Countries
- South Africa
- Rest of the Middle East and Africa
Competitive Landscape
The competitive landscape of the FRP grating market features key players such as Eurograte Fiberglass Grating, National Grating, Creative Pultrusions, AGC Matex Co. Ltd, Bedford Reinforced Plastics, Fibrolux GmbH, Ferrotech International FZE, Aeron Composite, Delta Composites LLC, and Fibergrate Composite Structures Ltd, all of which focus on expanding product portfolios and strengthening global supply networks. Manufacturers compete by offering corrosion-resistant, slip-safe, and fire-retardant grating solutions tailored for industrial, marine, and water treatment applications. Many companies invest in automated molding and pultrusion technologies to increase precision and reduce lead times. Partnerships with construction firms, engineering contractors, and infrastructure developers help widen market reach. Several players also prioritize sustainability by introducing lower-emission resins and recyclable composite solutions. Ongoing R&D in high-strength profiles and modular installation systems further intensifies competition
Shape Your Report to Specific Countries or Regions & Enjoy 30% Off!
Key Player Analysis
Recent Developments
- In November 2025, Bedford Reinforced Plastics Introduced a new FRP screenwall panel system for security, containment, and industrial enclosure applications, expanding its PROSeries FRP solutions portfolio.
- In October 2023, AGC Matex Co. Ltd (now known as Molymer Matex Co., Ltd.) was included in an online article titled “Asia’s Top 10 Pultruded Frp Grating Brand List” published on a distributor’s website.
Report Coverage
The research report offers an in-depth analysis based on Process, Application, End-User and Geography. It details leading market players, providing an overview of their business, product offerings, investments, revenue streams, and key applications. Additionally, the report includes insights into the competitive environment, SWOT analysis, current market trends, as well as the primary drivers and constraints. Furthermore, it discusses various factors that have driven market expansion in recent years. The report also explores market dynamics, regulatory scenarios, and technological advancements that are shaping the industry. It assesses the impact of external factors and global economic changes on market growth. Lastly, it provides strategic recommendations for new entrants and established companies to navigate the complexities of the market.
Future Outlook
- Demand will rise as industries replace steel with corrosion-resistant FRP solutions.
- Water and wastewater treatment expansion will strengthen long-term installation needs.
- Offshore wind projects will boost usage in marine walkways and platform structures.
- Modular industrial facilities will adopt lightweight and easy-install FRP grating.
- Safety regulations will increase the need for slip-resistant and fire-retardant products.
- Manufacturers will invest more in automated pultrusion and molding technologies.
- Sustainability efforts will encourage development of low-emission resin systems.
- Customized grating designs will gain traction across chemical and energy sectors.
- Emerging markets in Asia and the Middle East will see faster adoption.
- Replacement demand will grow as older metal structures reach end-of-life.



