
Market overview
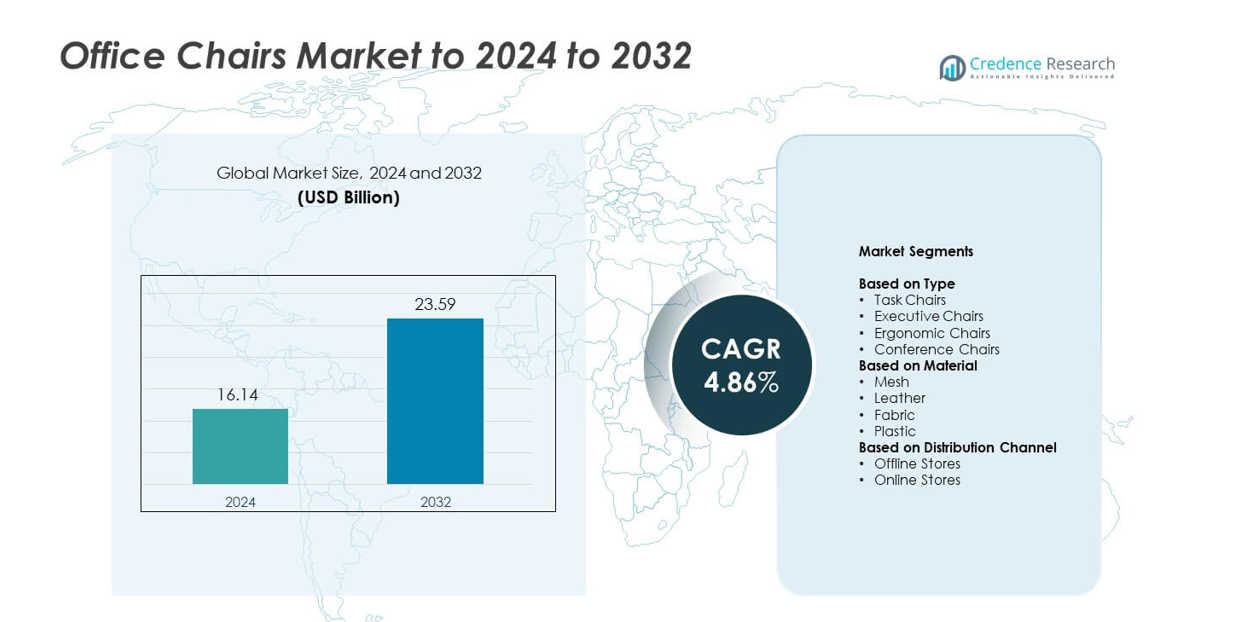
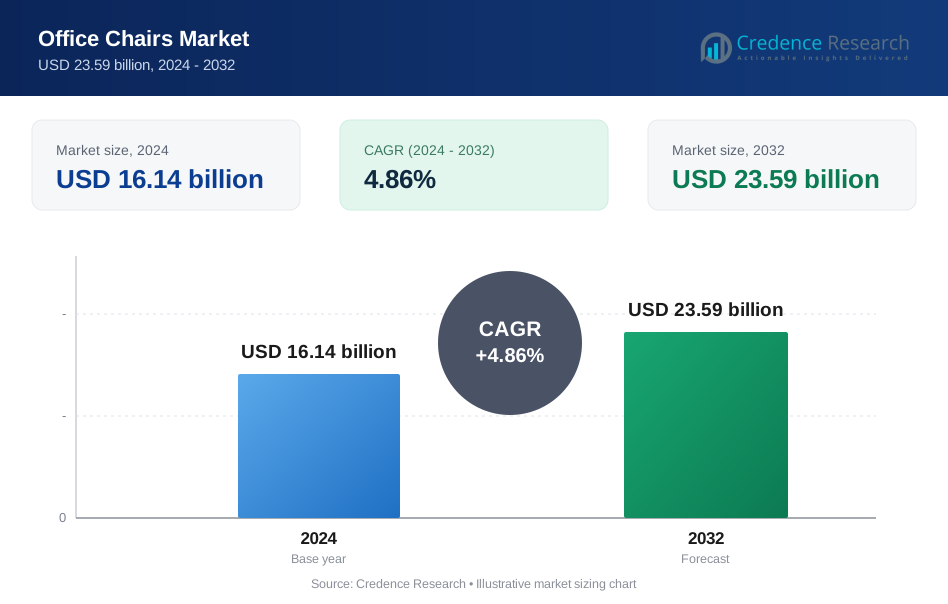
Office chairs market size was valued at USD 16.14 billion in 2024 and is anticipated to reach USD 23.59 billion by 2032, at a CAGR of 4.86% during the forecast period.
| REPORT ATTRIBUTE | DETAILS |
|---|---|
| Historical Period | 2020-2023 |
| Base Year | 2024 |
| Forecast Period | 2025-2032 |
| Office Chairs Market Size 2024 | USD 16.14 billion |
| Office Chairs Market, CAGR | 4.86% |
| Office Chairs Market Size 2032 | USD 23.59 billion |
The office chairs market is driven by leading companies such as Humanscale, Knoll, IKEA, Steelcase, Okamura Corporation, Haworth, HNI Corporation, Herman Miller, Vitra, and Global Furniture Group, each strengthening their position through ergonomic innovation and wider distribution. North America led the global market in 2024 with about 34% share, supported by strong corporate spending and high adoption of ergonomic seating. Europe followed with nearly 29% share as offices modernized workspaces and aligned with workplace safety standards. Asia Pacific accounted for about 27% share, driven by rapid office expansion, rising employment, and growing demand from home-office users.
Market Insights
- The office chairs market was valued at USD 16.14 billion in 2024 and is projected to reach USD 23.59 billion by 2032, growing at a CAGR of 4.86%. • Demand grew as companies upgraded workstations and adopted ergonomic seating, with task chairs leading the type segment at about 46% share due to strong suitability for long working hours. • Trends shifted toward breathable mesh designs, which held nearly 41% share, and rising adoption of ergonomic features that support posture health in both offices and home work setups. • Competition intensified as global and regional brands expanded product lines, enhanced durability, and leveraged online channels, while high prices of premium ergonomic models remained a restraint for cost-sensitive buyers. • North America led the market with about 34% share, followed by Europe at 29% and Asia Pacific at 27%, supported by strong office expansion, hybrid work trends, and steady home-office purchases across key economies.
Market Segmentation Analysis:
By Type
Task chairs dominated the office chairs market in 2024 with about 46% share. Their lead grew due to strong demand in corporate offices and shared workspaces. Companies preferred task chairs because these models support long sitting hours and offer adjustable features. Ergonomic designs boosted comfort for employees and reduced posture-related issues. Executive chairs expanded in premium setups, while conference chairs saw steady use in meeting rooms. Ergonomic chairs also gained traction as firms focused on wellness, yet task chairs stayed dominant due to affordability and wide suitability across job roles.
- For instance, the HON Ignition 2.0 Mid-Back Mesh Task Chair features an adjustable seat height range of 17 inches to 21 inches, as confirmed by various product specifications.
By Material
Mesh chairs held the largest share in 2024 with nearly 41% of the market. Buyers preferred mesh because the material supports airflow, reduces heat buildup, and offers flexible back support. Offices adopted mesh chairs to improve employee comfort during long working hours. Leather chairs grew in premium zones, while fabric models served mid-range demand. Plastic chairs gained traction in budget-focused setups. The shift toward breathable seating, hybrid workstations, and ergonomic comfort sustained mesh dominance, supported by rising purchases from technology firms and startup environments.
- For instance, the Herman Miller Aeron chair is available in three sizes to accommodate a wide range of body types. The most common Size B chair offers a standard seat height range of approximately 41 to 52 centimeters (16 to 20.5 inches) and is warranted for users up to 159 kilograms (350 pounds).
By Distribution Channel
Offline stores led the distribution channel in 2024 with around 63% share. Buyers favored offline channels because these outlets allow physical testing of comfort, height, and lumbar support. Large retailers and specialty furniture stores offered wide model availability and quick delivery. Online stores grew fast with rising e-commerce use and wider discounts. Digital channels also expanded through virtual trials and easy comparison features. Despite online growth, offline stores stayed dominant as corporate buyers preferred bulk procurement, in-store trials, and customized installation services.
Key Growth Drivers
Rising Corporate Expansion and Workspace Modernization
Global office expansion increased demand for high-quality seating as companies upgraded work environments. Firms invested in modern workstations to support hybrid schedules and boost productivity. Growing employment in IT, finance, and shared office spaces further strengthened the need for durable task and ergonomic chairs. Startups and coworking hubs also contributed to steady bulk purchases. This modernization wave pushed organizations to replace outdated models with chairs offering better comfort, adjustable features, and long-term support. The shift toward high-performance work culture kept corporate demand strong across developed and emerging markets.
- For instance, Haworth's Fern task chair offers standard ergonomic adjustments, including a seat height adjustment range from 420 to 540 millimeters and a total seat depth adjustment travel of 88 millimeters.
Growing Focus on Employee Health and Ergonomic Adoption
Businesses prioritized ergonomic seating to reduce back strain, posture issues, and fatigue among employees. Employers adopted advanced adjustable chairs to support wellness programs and reduce absenteeism. Height-adjustable seats, lumbar support, and breathable materials gained strong acceptance. Hybrid work culture also encouraged individuals to invest in healthier home workstations. Rising awareness of musculoskeletal risks prompted organizations to adopt ergonomic standards across departments. This push toward preventive health measures sustained high demand for ergonomic designs and reshaped long-term procurement strategies for large corporations.
- For instance, The Humanscale Freedom Headrest chair, in its standard configuration, has a maximum weight capacity of 300 pounds (approximately 136 kg) and weighs approximately 17 kg (38 pounds) with arms.
Rising Home Office Setups Driven by Remote and Hybrid Work
Remote and hybrid work trends significantly boosted home office chair purchases. Workers sought comfortable and supportive seating to replace basic household chairs, driving strong retail demand. E-commerce platforms expanded product visibility and offered easy comparisons, increasing consumer adoption. Tech workers, freelancers, and students contributed to rising volumes. The shift to full-time or part-time home working encouraged households to upgrade long-term work setups. This structural change in work culture positioned home offices as a major growth channel for well-designed, ergonomic, and affordable seating options.
Key Trends & Opportunities
Growth of Smart and Customizable Seating Solutions
Manufacturers introduced smart seating features that track posture, adjust resistance, and support personalized comfort settings. Adjustable lumbar systems and multi-position armrests grew popular as buyers looked for more tailored seating. The opportunity expanded as employers sought workplace analytics to monitor wellness. Brands used digital tools to offer configuration options for color, fabric, and support level. These innovations helped companies attract premium buyers and differentiate product lines. The rising focus on adaptive seating created a strong path for advanced product development.
- For instance, Steelcase’s Gesture chair features arms that are designed to mimic the movement of the human arm and shoulder, allowing them to rotate through a full 360 degrees and adjust across multiple dimensions.
Sustainable Materials and Eco-Friendly Manufacturing
Demand for chairs made with recycled plastics, low-emission foam, and responsibly sourced fabrics increased across major markets. Buyers preferred environmentally certified products as firms strengthened sustainability commitments. This trend opened opportunities for manufacturers to reduce waste and adopt greener production methods. Governments also promoted low-impact furniture purchases for offices. Sustainable materials enhanced brand image and appealed to conscious consumers building home workstations. The push toward eco-friendly designs supported long-term product innovation and helped suppliers gain competitive advantage.
- For instance, Knoll's ReGeneration chair is a high-performance, chair meets BIFMA standards and is rated for users up to 300 pounds (approximately 136 kg).
Key Challenges
High Cost of Advanced Ergonomic and Premium Models
Premium ergonomic chairs require sophisticated mechanisms, high-grade materials, and advanced adjustable components. These factors raise production costs, limiting adoption among small businesses and price-sensitive buyers. Many consumers still choose lower-priced alternatives despite comfort concerns. Corporate buyers often delay upgrades due to budget constraints during economic downturns. This price gap slows the shift toward fully ergonomic workstations and creates barriers for premium brands seeking wider market penetration.
Intense Competition and Low Product Differentiation
The market faces strong competition from regional and global manufacturers offering similar designs and features. Many products appear interchangeable, making price the main deciding factor for buyers. This reduces margins for mid-range suppliers and increases pressure on brands to innovate. Frequent launches by online-first companies add further competition. Limited differentiation also makes long-term customer loyalty harder to maintain. As new models flood the market, companies struggle to stand out without major investment in design or technology.
Regional Analysis
North America
North America held the largest share of the office chairs market in 2024 at about 34%. Strong adoption of ergonomic seating in corporate offices supported steady replacement cycles across the U.S. and Canada. Hybrid work models encouraged employees to upgrade home setups, boosting retail demand. Large enterprises invested in modern workstations that improved posture and supported longer work hours. Rising purchases from technology, consulting, and financial service firms strengthened overall volumes. Growing awareness of workplace wellness also pushed companies to adopt chairs with better lumbar support and breathable materials.
Europe
Europe accounted for nearly 29% of the market in 2024. Demand grew as countries modernized office infrastructure and upgraded aging furniture across corporate and public sectors. Strict workplace safety rules encouraged businesses to shift toward ergonomic seating. Germany, the U.K., and France led sales as companies focused on high-quality materials and long-term durability. The region also benefited from rising hybrid work adoption, which increased consumer purchases for home offices. Sustainability-focused buyers preferred chairs made from recycled materials, supporting growth in environmentally responsible product lines across major European manufacturers.
Asia Pacific
Asia Pacific held about 27% share in 2024 and remained the fastest-growing regional market. Expanding office construction, rapid growth of IT hubs, and rising employment in service industries supported higher procurement volumes. China, India, and Southeast Asia recorded strong demand from coworking spaces and startups. Increasing awareness of posture health encouraged firms to adopt ergonomic designs. The rise of online furniture platforms improved accessibility for small businesses and home users. Competitive pricing from regional manufacturers also boosted adoption across developing cities, supporting sustained long-term market expansion.
Latin America
Latin America captured around 6% of the market in 2024. Growth improved as companies upgraded office spaces in Brazil, Mexico, and Chile. Rising adoption of hybrid work encouraged mid-income households to create functional home workstations. Corporate investments in ergonomic seating remained moderate but continued to rise as organizations sought to enhance employee comfort. Economic uncertainties limited rapid expansion, yet demand for affordable and mid-range models stayed stable. The region showed gradual improvement as awareness of workplace health increased and e-commerce platforms enhanced product availability.
Middle East & Africa
Middle East and Africa held nearly 4% share in 2024. Demand grew with ongoing commercial development in the UAE, Saudi Arabia, and South Africa. Corporate offices upgraded to ergonomic and premium models as part of workspace modernization initiatives. Government investments in business parks and service industries supported additional purchases. However, adoption remained slower in price-sensitive areas, where buyers preferred basic and durable seating options. E-commerce expansion improved access to a wider product range, supporting moderate growth across both residential and commercial buyers.
Market Segmentations:
By Type
- Task Chairs
- Executive Chairs
- Ergonomic Chairs
- Conference Chairs
By Material
- Mesh
- Leather
- Fabric
- Plastic
By Distribution Channel
- Offline Stores
- Online Stores
By Geography
- North America
- U.S.
- Canada
- Mexico
- Europe
- Germany
- France
- U.K.
- Italy
- Spain
- Rest of Europe
- Asia Pacific
- China
- Japan
- India
- South Korea
- South-east Asia
- Rest of Asia Pacific
- Latin America
- Brazil
- Argentina
- Rest of Latin America
- Middle East & Africa
- GCC Countries
- South Africa
- Rest of the Middle East and Africa
Competitive Landscape
The office chairs market is shaped by leading companies such as Humanscale, Knoll, IKEA, Steelcase, Okamura Corporation, Haworth, HNI Corporation, Herman Miller, Vitra, and Global Furniture Group. Competition intensified as manufacturers introduced ergonomic designs, breathable materials, and adjustable mechanisms tailored for long working hours. Brands focused on developing models that support hybrid work needs and deliver comfort for both corporate and home offices. Companies expanded product lines with mesh backs, improved lumbar systems, and lightweight frames to attract broader buyers. Sustainability also became a key priority, encouraging the use of recycled plastics and low-emission foams. Digital channels increased pressure as online-first sellers offered competitive pricing and wider choices. Many suppliers strengthened global reach through distribution networks and regional warehousing. Enhanced design aesthetics, durability, and customization options helped firms maintain strong brand positioning in a market driven by rising comfort expectations and continuous workspace modernization.
Key Player Analysis
- Humanscale
- Knoll
- IKEA
- Steelcase
- Okamura Corporation
- Haworth
- HNI Corporation
- Herman Miller
- Vitra
- Global Furniture Group
Recent Developments
- In 2025, HNI Corporation agreed to acquire Steelcase in a cash-and-stock deal. The move aims to leverage rising return-to-office demand for workstations and task chairs worldwide.
- In 2024, Haworth launched the Breck task chair, focused on active, flexible sitting for modern offices. The chair targets agile workspaces with a compact form and responsive ergonomics.
- In 2024, Herman Miller and Studio 7.5 introduced the Zeph Side Chair for shared workspaces. The side chair extends the Zeph family, giving offices a colorful ergonomic option for collaborative zones.
Report Coverage
The research report offers an in-depth analysis based on Type, Material, Distribution Channel and Geography. It details leading market players, providing an overview of their business, product offerings, investments, revenue streams, and key applications. Additionally, the report includes insights into the competitive environment, SWOT analysis, current market trends, as well as the primary drivers and constraints. Furthermore, it discusses various factors that have driven market expansion in recent years. The report also explores market dynamics, regulatory scenarios, and technological advancements that are shaping the industry. It assesses the impact of external factors and global economic changes on market growth. Lastly, it provides strategic recommendations for new entrants and established companies to navigate the complexities of the market.
Future Outlook
- Demand will rise as companies continue upgrading workspaces for hybrid teams.
- Ergonomic chairs will gain wider adoption due to growing focus on employee health.
- Home office setups will remain a strong purchase driver across major markets.
- Smart seating features will expand as brands integrate posture and comfort sensors.
- Eco-friendly materials will grow in use as firms push sustainability goals.
- Premium models will see higher demand in corporate zones and tech clusters.
- Online sales will expand as buyers prefer easy comparison and faster delivery.
- Customizable designs will increase as workplaces seek more flexible seating.
- Competition will intensify as regional players introduce affordable ergonomic models.
- Long-term replacement cycles will shorten as companies adopt modern designs.
Request a Free Sample
Fill in your details and we'll send you a free sample report.
- Sample data tables & charts
- Research methodology
Need a Custom Version of This Report?
Tailor the scope, geography, or segments to your exact requirements.
- Custom geography or segment scope
- Direct access to our analyst team
Frequently Asked Questions
What is the current market size for office chairs market, and what is its projected size in 2032?
At what Compound Annual Growth Rate is the office chairs market projected to grow between 2025 and 2032?
Which is the leading region of the market for office chairs?
What are the key drivers for the growth of the office chairs market?
What are the primary factors fueling the growth of the office chairs market?
Who are the leading companies in the office chairs market?
Table of Content
Chapter 1. Report Introduction
- 1.1 Report Description & Purpose
- 1.1.1 Report Title & Market Definition
- 1.1.2 Unique Selling Propositions (USP) & Key Differentiators
- 1.1.3 Value Proposition for Stakeholders
- 1.2 Research Objectives
- 1.2.1 Market Sizing Objectives (Volume & Revenue) (Volume Where Applicable)
- 1.2.2 Segmentation Objectives
- 1.2.3 Competitive Intelligence Objectives
- 1.2.4 Forecast & Scenario Objectives
- 1.3 Report Scope
- 1.3.1 Office Chairs Scope – Segments & Subsegments Covered
- 1.3.2 Geographic Scope – Regions & Countries Covered
- 1.3.3 Historical Period, Base Year & Forecast Period (2024; forecast to 2032)
- 1.3.4 Inclusions & Exclusions
- 1.4 Industry Classification & Applicable Codes
- 1.5 Currency, Measurement Units & Valuation Basis
- 1.6 Target Stakeholders
- 1.7 Limitations & Assumptions
Chapter 2. Executive Summary
- 2.1 Global Office Chairs Market Snapshot
- 2.1.1 Market Size – Historical (2024) & Forecast (2024-2032) (2024: USD 16.14 billion → 2032: USD 23.59 billion)
- 2.1.2 Volume & Revenue – Global Totals (Volume Where Applicable)
- 2.1.3 Key Market Highlights – Top Five Facts
- 2.2 Office Chairs Market Segmentation Snapshot
- 2.2.1 Market Split by Region – 2024 vs. 2032
- 2.3 Competitive Snapshot
- 2.3.1 Top 10 Players by Revenue Share – 2024
- 2.3.2 Top 10 Players by Volume Share – 2024 (Volume Where Applicable)
- 2.3.3 Recent Strategic Developments (18-Month Summary)
- 2.4 Key Investment Highlights & Strategic Conclusions
Chapter 3. Office Chairs Market Dynamics & Industry Analysis
- 3.1 Market Overview & Context
- 3.1.1 Office Chairs Market Position in the Broader Industry Value Chain
- 3.1.2 Demand Structure & Purchasing Dynamics
- 3.1.3 Market Maturity & Development Stage by Region
- 3.2 Office Chairs Market Drivers
- 3.3 Office Chairs Market Restraints & Challenges
- 3.4 Office Chairs Market Opportunities
- 3.5 Porter's Five Forces Analysis
- 3.5.1 Threat of New Entrants
- 3.5.2 Bargaining Power of Suppliers
- 3.5.3 Bargaining Power of Buyers
- 3.5.4 Threat of Substitutes
- 3.5.5 Competitive Rivalry – Intensity Assessment
- 3.6 Office Chairs Value Chain Analysis
- 3.6.1 Upstream – Key Inputs, Resources & Suppliers
- 3.6.1.1 Key Input/Resource 1
- 3.6.1.2 Key Input/Resource 2
- 3.6.1.3 Key Input/Resource 3
- 3.6.2 Midstream – Core Operations & Value Creation
- 3.6.2.1 Operating Model & Process Overview
- 3.6.2.2 Key Operating Locations & Capabilities by Company
- 3.6.3 Downstream – Market Channels & End Users
- 3.6.3.1 Direct Sales & Customer Engagement Channels
- 3.6.3.2 Indirect Sales, Intermediaries & Partner Channels
- 3.6.4 Value Chain Profitability Analysis
- 3.6.1 Upstream – Key Inputs, Resources & Suppliers
- 3.7 PESTEL Analysis
- 3.7.1 Political Factors
- 3.7.2 Economic Factors
- 3.7.3 Social Factors
- 3.7.4 Technological Factors
- 3.7.5 Environmental Factors
- 3.7.6 Legal Factors
- 3.8 Office Chairs Supply Chain Analysis
- 3.8.1 Critical Input & Resource Availability Risk Assessment
- 3.8.2 Supplier & Operational Concentration Risk (Geographic Exposure)
- 3.8.3 Supply & Service Disruption Impact Analysis
- 3.9 Regulatory & Policy Landscape
Note: The regulatory and policy landscape section covers regulations based on their applicability to the market, Office Chairs category, geography, and scope of the study. Only regulatory frameworks with a material impact on operations, compliance, trade, sustainability, or market access are analyzed in detail.
Chapter 4. Key Investment Pockets & Opportunity Analysis
- 4.1 Office Chairs Market Attractiveness Analysis
- 4.1.1 By Region – Investment Attractiveness Matrix (Market Size × CAGR)
- 4.2 Absolute Revenue Growth Opportunity
- 4.2.1 By Region – Absolute Revenue Growth Through 2032
- 4.3 Incremental Demand Opportunity
- 4.3.1 By Region – Incremental Demand Through 2032
- 4.3.2 Segment – Incremental Demand
- 4.4 Emerging Submarket Opportunity Deep Dive (Subject to Applicability)
- 4.5 Priority Market Opportunity Scorecards
- 4.5.1 United States
- 4.5.2 Europe
- 4.5.3 Asia
- 4.5.4 Middle East & Africa
Note: Priority market opportunity scorecards reflect the geographic scope and strategic relevance of the study. Listed markets are indicative and may be adapted to the industry.
Chapter 5. Office Chairs Cross-Border Trade & Market Access Analysis
- 5.1 International Trade & Cross-Border Activity Overview
- 5.1.1 Global Export Value by Country (2024)
- 5.1.2 Global Export Volume by Country (2024) (Volume Where Applicable)
- 5.1.3 Global Import Value by Country (2024)
- 5.1.4 Global Import Volume by Country (2024) (Volume Where Applicable)
- 5.1.5 Net Trade Balance by Country (2024)
- 5.2 Export Analysis – Segment
- 5.2.1 Category 1 (Applicable Classification Code)
- 5.2.2 Category 2 (Applicable Classification Code)
- 5.2.3 Category 3 (Applicable Classification Code)
- 5.2.4 Category 4 (Applicable Classification Code)
- 5.2.5 Category 5 (Applicable Classification Code)
- 5.3 Import Analysis – Segment
- 5.3.1 Category 1 (Applicable Classification Code)
- 5.3.2 Category 2 (Applicable Classification Code)
- 5.3.3 Category 3 (Applicable Classification Code)
- 5.3.4 Category 4 (Applicable Classification Code)
- 5.3.5 Category 5 (Applicable Classification Code)
- 5.4 Cross-Border Pricing & Transaction Benchmarks
- 5.4.1 Export Pricing – Segment & Country
- 5.4.2 Import Pricing – Segment & Source Country
- 5.4.3 Price Trends (2024)
- 5.5 Key Cross-Border Trade & Delivery Routes
- 5.5.1 Cross-Border Trade/Delivery Route 1
- 5.5.2 Cross-Border Trade/Delivery Route 2
- 5.5.3 Cross-Border Trade/Delivery Route 3
- 5.5.4 Cross-Border Trade/Delivery Route 4
- 5.5.5 Cross-Border Trade/Delivery Route 5
- 5.6 Trade Policy & Market Access Impact Assessment
- 5.6.1 Tariff & Non-Tariff Barriers
- 5.6.2 Regional Trade & Economic Integration Frameworks
- 5.6.3 Bilateral & Multilateral Trade Agreements
- 5.6.4 Cross-Border Operating, Licensing & Localization Requirements
Note: This chapter applies where cross-border trade or delivery is relevant to Office Chairs. Goods, services, and digital offerings are assessed using applicable classifications and transaction measures. Import-export volumes, trade balances, and route analyses are included only where meaningful to the market.
Chapter 6. Competitive Landscape & Company Benchmarking
- 6.1 Office Chairs Market Concentration & Structure
- 6.1.1 Herfindahl-Hirschman Index (HHI) – the historical period vs. 2024
- 6.1.2 Leading, Mid-Sized & Emerging Player Structure
- 6.1.3 Global, Regional & Local Player Dynamics
- 6.2 Office Chairs Market Share Analysis – 2024
- 6.2.1 Global Revenue Share by Company
- 6.2.2 Global Volume Share by Company (Volume Where Applicable)
- 6.2.3 Regional Revenue Share
- 6.2.4 Market Share Evolution (the historical period vs. 2024)
- 6.2.5 Company Market Share by Key Segment
- 6.2.6 Company Market Share by Customer Group
- 6.3 Operating Scale, Capacity & Infrastructure Analysis
- 6.3.1 Global Operating Scale & Supply Capacity
- 6.3.2 Resource Utilization & Operating Efficiency
- 6.3.3 Output, Service Delivery & Activity Metrics
- 6.3.4 Operating Footprint & Infrastructure Map
- 6.3.5 Planned Operational & Capacity Expansion
- 6.4 Office Chairs Competitive Benchmarking Matrix
- 6.4.1 Revenue, Growth, Profitability & Operating Metric Comparison
- 6.4.2 Channel Revenue Mix
- 6.4.3 Geographic Revenue Exposure
- 6.4.4 R&D Intensity
- 6.4.5 Sustainability Maturity
- 6.5 Strategic Developments in Office Chairs (Last 24 Months)
- 6.5.1 Mergers, Acquisitions & Divestments
- 6.5.2 New Products, Services & Solutions in Office Chairs
- 6.5.3 Operational & Infrastructure Expansions
- 6.5.4 Strategic Alliances, Joint Ventures & Partnerships
- 6.5.5 Distribution Expansion & Market Entry
- 6.5.6 Sustainability & ESG Initiatives
- 6.6 Competitive Strategy Mapping
- 6.6.1 Leader, Challenger, Follower & Niche Classification
- 6.6.2 Pricing Strategy Comparison
- 6.6.3 Channel Strategy Matrix
Note: Strategic developments are included based on their materiality and the availability of reliable information.
Chapter 7. Global Office Chairs Market – By Sales & Delivery Channel
- 7.1 Segment Overview
- 7.1.1 Volume & Revenue Split by Channel (2024 & 2032) (Volume Where Applicable)
- 7.1.2 Channel Mix Evolution (2024-2032)
Chapter 8. Regional Market Analysis – Global Overview
- 8.1 Global Regional Overview
- 8.1.1 Regional Volume Share (Volume Where Applicable)
- 8.1.2 Regional Revenue Share
- 8.1.3 Regional Volume by Region (Volume Where Applicable)
- 8.1.4 Regional Revenue by Region
- 8.1.5 Regional Forecast Through 2032
- 8.2 Cross-Regional Segment Analysis
- 8.2.1 By Sales & Delivery Channel
- 8.2.2 By Competitive Positioning & Price Tier
Chapter 9. North America Office Chairs Market
- 9.1 United States
- 9.2 Canada
- 9.3 Mexico
Chapter 10. Europe Office Chairs Market
- 10.1 Germany
- 10.2 France
- 10.3 Italy
- 10.4 United Kingdom
- 10.5 Spain
- 10.6 Poland
- 10.7 Russia
- 10.8 Netherlands
- 10.9 Belgium
- 10.10 Sweden
- 10.11 Denmark
- 10.12 Norway
- 10.13 Rest of Europe
Chapter 11. Asia Pacific Office Chairs Market
- 11.1 China
- 11.2 India
- 11.3 Japan
- 11.4 South Korea
- 11.5 Thailand
- 11.6 Indonesia
- 11.7 Vietnam
- 11.8 Malaysia
- 11.9 Australia
- 11.10 Rest of Asia Pacific
Chapter 12. Latin America Office Chairs Market
- 12.1 Brazil
- 12.2 Argentina
- 12.3 Colombia
- 12.4 Chile
- 12.5 Rest of Latin America
Chapter 13. Middle East Office Chairs Market
- 13.1 Saudi Arabia
- 13.2 United Arab Emirates
- 13.3 Turkey
- 13.4 Israel
- 13.5 Iran
- 13.6 Rest of the Middle East
Chapter 14. Africa Office Chairs Market
- 14.1 South Africa
- 14.2 Egypt
- 14.3 Nigeria
- 14.4 Morocco
- 14.5 Rest of Africa
Chapter 15. Office Chairs Company Profiles
- 15.1 [Company 01]
- 15.1.1 Company Overview
- 15.1.2 Key Management Personnel
- 15.1.3 Products & Services Portfolio
- 15.1.4 Financial Performance
- 15.1.5 Key Market Focus & Geographic Presence
- 15.1.6 Recent Developments & Strategic Initiatives
Note: The company profile list is preliminary and may change based on research findings, market developments, data availability, and client requirements.
Chapter 16. Appendices
- Appendix A – List of Abbreviations & Acronyms
- Appendix B – Industry Classification Code Reference – Full Series
- Appendix C – Supply, Output & Operating Capacity Data Tables
- Appendix D – End-Use & Demand Base Tables
- Appendix E – Demand, Adoption & Usage Assumptions
- Appendix F – Pricing & Revenue Metric Reference Tables
- Appendix G – Company Operations & Infrastructure Database
- Appendix H – Cross-Border Trade & Activity Data Tables (Where Applicable)
- Appendix I – Regulatory Summary Tables
- Appendix J – Primary Research Participant List (Anonymized)
- Appendix K – Primary Research Questionnaire Framework
- Appendix L – Data Sources & Bibliography
- Appendix M – Market Size Divergence & Source Comparison
Chapter 17. Research Methodology
- 17.1 Research Framework & Philosophy
- 17.2 Secondary Research – Sources, Hierarchy & Data Extraction
- 17.3 Data Modeling – Bottom-Up & Top-Down Market Sizing
- 17.4 Primary Research – Stakeholder Framework, LOI & Sample Sizes
- 17.5 Forecast Methodology – Regression, Scenario & Sensitivity Analysis
- 17.6 Quality Control – Four-Layer Validation Framework
- 17.7 Limitations & Standard Assumptions
- 17.8 Disclaimer
