Market Overview
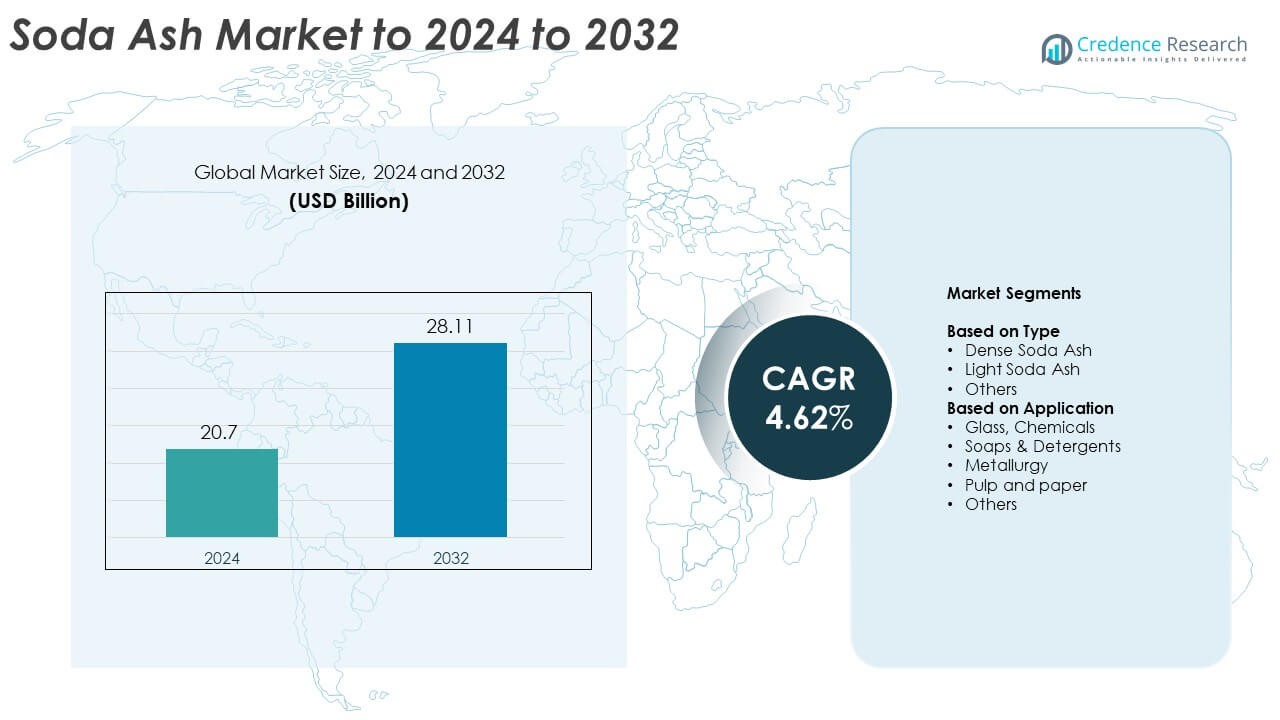
Soda Ash Market size was valued at USD 20.7 Billion in 2024 and is anticipated to reach USD 28.11 Billion by 2032, at a CAGR of 4.62% during the forecast period.
| REPORT ATTRIBUTE |
DETAILS |
| Historical Period |
2020-2023 |
| Base Year |
2024 |
| Forecast Period |
2025-2032 |
| Soda Ash Market Size 2024 |
USD 20.7 Billion |
| Soda Ash Market, CAGR |
4.62% |
| Soda Ash Market Size 2032 |
USD 28.11 Billion |
The Soda Ash Market features leading companies such as Solvay, Tata Chemicals Ltd., Ciner Group, Şişecam, NIRMA, DCW Ltd., Shandong Haihua Group, Angel Chemicals, Radhe Enterprise, InoChem and Sudarshan Mineral, which drive global supply, production efficiency and technology development. These players compete through capacity expansion, lower-energy processes and strong distribution networks serving glass, detergents and chemical industries. Asia Pacific remained the dominant region in 2024 with about 45.7% share due to large-scale glass and detergent consumption, followed by Europe at 22.5%, North America at 18%, and Latin America and Middle East & Africa together accounting for under 10% of global demand.
Access crucial information at unmatched prices!
Request your sample report today & start making informed decisions powered by Credence Research Inc.!
Download Sample
Market Insights
- The Soda Ash Market reached USD 20.7 Billion in 2024 and is projected to hit USD 28.11 Billion by 2032, growing at a CAGR of 4.62%.
- Demand grows due to expanding flat and container glass production, with the glass segment holding about 52% share in 2024.
- Rising adoption of energy-efficient production methods and increasing solar glass manufacturing shape key market trends across major economies.
- Global competition includes large integrated producers and regional suppliers focusing on cost efficiency, capacity expansion and improved product purity.
- Asia Pacific led the market with nearly 45.7% share in 2024, followed by Europe at 22.5%, North America at 18%, while Latin America and Middle East & Africa together contributed under 10% to global demand.
Market Segmentation Analysis:
By Type
Dense soda ash dominated the type segment in 2024 with about 63% share due to its strong use in flat glass, container glass, and detergent production. Manufacturers favored dense grade because it offers higher bulk density, better handling, and improved product consistency for large-scale industrial processes. Light soda ash held a smaller share and grew steadily across chemical and pulp applications where solubility needs differ. The others category covered specialty grades that met niche industrial requirements but remained limited in overall demand.
- For instance, XRD Chemical specifies bulk density for light soda ash in the range of approximately 0.5 to 0.6 g/cm³, while the bulk density for the dense grade is listed in the typical industry range of 1.1 to 1.3 g/cm³.
By Application
Glass, chemicals led the application segment in 2024 with nearly 52% share as soda ash remained a core ingredient in glass melting and chemical processing. Strong demand from construction, automotive, and packaging industries supported steady consumption. Soaps and detergents followed due to rising household product use, while metallurgy and pulp and paper maintained moderate shares tied to process-specific needs. Other applications grew slowly and served dispersed end-use industries with smaller volume requirements.
- For instance, Şişecam reported in its 2022 Annual Report and investor presentations that it produced approximately 4.9 million metric tons of soda ash that year, a large share of which supports its global glass manufacturing operations.
Key Growth Drivers
Rising Demand from Glass Manufacturing
Growing construction and automotive production boosted glass demand, which strengthened soda ash consumption. Flat glass and container glass sectors expanded due to rising building activity, increased window installations, and higher beverage packaging output. Countries in Asia and the Middle East increased furnace capacity, creating steady volume growth. Soda ash remained essential for reducing melting temperatures and improving glass quality, which kept the material in strong demand across both established and emerging markets.
- For instance, Tata Chemicals North America mines more than 5 million tonnes of trona ore each year in Wyoming and processes it into soda ash used in flat and container glass.
Expanding Use in Detergents and Cleaning Products
Household and industrial detergent consumption increased as hygiene awareness rose worldwide. Soda ash served as a key builder in many formulations, improving cleaning efficiency and stabilizing product performance. Urbanization, higher living standards, and wider access to packaged cleaning goods supported consistent demand. Manufacturers enhanced production lines in fast-growing economies, which sustained bulk procurement of soda ash. Growth in laundry care and surface cleaners continued to reinforce the material’s importance in the chemical supply chain.
- For instance, Nirma Limited is one of the largest soda ash producers in India and globally, operating major production facilities at Kalatalav and Porbandar in the state of Gujarat. As of 2019, Nirma was planning an expansion at its Kalatalav facility to increase capacity from 2,800 tonnes per day (TPD) to 4,300 TPD.
Growth in Chemicals and Industrial Applications
Soda ash usage expanded across chemicals such as sodium silicates, sodium bicarbonate, and other industrial intermediates. These materials supported diverse end uses, including water treatment, flue gas cleaning, and various manufacturing operations. Increased focus on pollution control and industrial process efficiency strengthened the use of soda ash derivatives. Production upgrades in chemical plants across Asia helped maintain steady volume growth. Broad industrial reliance made this category an important driver in the overall market.
Key Trends & Opportunities
Shift Toward Energy-Efficient Production Technologies
Producers explored low-energy technologies to reduce emissions and improve operational efficiency. Modernization of calcination systems and optimization of furnace operations gained attention due to rising energy costs. Companies evaluated alternative heating methods and process automation to limit waste and boost productivity. Markets with strong regulatory pressure witnessed faster adoption of updated equipment. These improvements created opportunities for sustainable soda ash solutions, especially in regions aiming to cut industrial carbon footprints.
- For instance, Solvay and ENOWA plan a carbon-neutral soda ash plant at NEOM with an initial nameplate capacity of 500,000 tons by 2030, rising to 1.5 million tons by 2035 using a renewable-powered process.
Investment in Capacity Expansion Across Emerging Markets
Developing countries increased investment in soda ash facilities to meet internal demand and expand export capabilities. Rapid industrial growth in Asia and the Middle East made capacity additions attractive. New plants supported glass, detergents, and chemical industries that continued to scale. Governments encouraged industrial self-reliance, which strengthened local manufacturing. These expansions opened doors for new suppliers and enabled long-term supply security in regions with rising consumption needs.
- For instance, InoChem’s soda ash plant at the Ras Al-Khair Industrial City in Saudi Arabia has an annual production capacity of 300,000 metric tons of soda ash, making it the first soda ash manufacturer in the Gulf region (GCC countries) and the largest in the Middle East and North Africa.
Rising Demand for High-Purity Grades
High-purity soda ash found increased use in specialty chemicals, pharmaceuticals, and high-quality glass applications. Tighter quality standards encouraged manufacturers to improve refining methods. Growth in solar glass and advanced electronics supported this trend, as these industries required higher clarity and material stability. Producers enhanced quality control systems and upgraded processing lines to meet premium requirements. Demand for consistent and high-purity grades created new market opportunities in advanced manufacturing sectors.
Key Challenges
Volatility in Raw Material and Energy Costs
Producers faced fluctuating prices for key inputs such as limestone, salt, and fuel. Rising energy expenses increased production costs and pressured margins, particularly in regions dependent on imported fuel. Companies struggled to maintain stable pricing while meeting customer demand. Volatility also affected long-term planning for capacity expansions and modernization. These uncertainties created operational challenges for both established and emerging producers.
Environmental Regulations and Sustainability Pressures
Stricter environmental rules required producers to invest in emission control systems and improved waste-management practices. Compliance costs rose as governments enforced limits on CO₂ output, wastewater discharge, and particulate emissions. Older facilities faced retrofitting challenges, which increased operational burdens. Sustainability expectations from customers added further pressure for cleaner production. Meeting regulatory and market requirements remained a major challenge for the industry.
Regional Analysis
North America
North America held close to 18% share of the soda ash market in 2024, supported mainly by strong U.S. production from natural trona deposits. The region benefited from reliable supply, competitive operating costs and steady demand from glass, chemicals and detergent industries. Flat glass and container glass applications remained major contributors, while water treatment and industrial formulations added consistent volume. Growth stayed moderate due to the market’s mature structure, but export capability and ongoing industrial upgrades helped maintain stable regional demand.
Asia Pacific
Asia Pacific led the global soda ash market with about 45.7% share in 2024, driven by rapid growth in China, India and Southeast Asia. The region’s expanding construction, automotive and packaging industries increased glass consumption, which boosted soda ash demand. Rising detergent usage and chemical production also supported strong growth. China remained the largest producer and consumer, while India posted rising imports due to supply gaps. Industrialization, investment in solar glass and expanding manufacturing capacity kept Asia Pacific the dominant regional contributor.
Europe
Europe accounted for nearly 22.5% of the soda ash market in 2024, anchored by stable demand from automotive glass, building materials and industrial chemicals. The region’s emphasis on recycling and sustainable production supported steady soda ash use in flat and container glass output. Countries such as Germany, France and the UK remained key markets with mature but reliable consumption patterns. Growth stayed moderate due to sector maturity, yet higher adoption of high-purity grades and specialty glass applications continued to reinforce regional demand.
Middle East & Africa
The Middle East & Africa region captured around 3–4% share of the soda ash market in 2024. Demand increased through expanding construction projects, growing glass manufacturing investments and rising water treatment needs. Gulf nations supported consumption through infrastructure development, while parts of Africa relied heavily on imports to meet industrial and household product requirements. Limited local production and high logistics costs slowed broader expansion, but planned industrial growth and improving supply networks offered gradual opportunities for market development.
Latin America
Latin America held under 5% share of the soda ash market in 2024, driven by demand from container glass, detergents and agricultural processing. Brazil and Mexico remained the largest consumers, supported by rising household product use and moderate industrial growth. The region depended on imports due to limited domestic production capacity, which influenced pricing and supply stability. Expanding construction, food and beverage packaging and improved manufacturing output created incremental demand, though structural constraints kept overall regional growth comparatively modest.
Market Segmentations:
By Type
- Dense Soda Ash
- Light Soda Ash
- Others
By Application
- Glass, Chemicals
- Soaps & Detergents
- Metallurgy
- Pulp and paper
- Others
By Geography
- North America
- Europe
- Asia Pacific
- Latin America
- Middle East
- Africa
Competitive Landscape
The competitive landscape of the soda ash market features Solvay, NIRMA, Şişecam, Angel Chemicals, Ciner Group, Radhe Enterprise, Tata Chemicals, InoChem, DCW Ltd., Shandong Haihua and Sudarshan Mineral in the first line as major participants shaping global supply dynamics. The market remains moderately consolidated, with established producers benefiting from integrated operations, long-term customer relationships and strong regional distribution networks. Companies focus on expanding capacity, improving process efficiency and reducing energy consumption to maintain cost competitiveness. Producers also work to enhance product quality to serve high-purity applications in glass, detergents and chemicals. Strategic investments in sustainable technologies and emission control systems influence differentiation in mature markets, while emerging regions attract capacity additions to meet rising industrial demand. Competition intensifies through pricing strategies, export capabilities and access to natural reserves. Market participants continue to strengthen supply reliability, operational scalability and environmental compliance to secure their position in a steadily expanding global industry.
Shape Your Report to Specific Countries or Regions & Enjoy 30% Off!
Key Player Analysis
Recent Developments
- In 2025, Solvay is advancing its sustainability efforts by reinventing its soda ash production process with the proprietary e.Solvay technology.
- In 2024, Şişecam acquired additional shares in its U.S. soda ash operations, reinforcing its position as a leading global soda ash producer.
- In 2022, Tata Chemicals announced plans to expand its soda ash plant in Mithapur, Gujarat, India, as part of a capital expenditure plan to increase the facility’s capacity from 875,000 tonnes per year to 1 million tonnes per year (an increase of approximately 125,000 tonnes).
Report Coverage
The research report offers an in-depth analysis based on Type, Application and Geography. It details leading market players, providing an overview of their business, product offerings, investments, revenue streams, and key applications. Additionally, the report includes insights into the competitive environment, SWOT analysis, current market trends, as well as the primary drivers and constraints. Furthermore, it discusses various factors that have driven market expansion in recent years. The report also explores market dynamics, regulatory scenarios, and technological advancements that are shaping the industry. It assesses the impact of external factors and global economic changes on market growth. Lastly, it provides strategic recommendations for new entrants and established companies to navigate the complexities of the market.
Future Outlook
- The market is expected to grow steadily as glass production expands worldwide.
- Demand will rise with construction growth and increased use of flat and container glass.
- Detergent and cleaning product consumption will continue to support stable volume gains.
- Solar glass manufacturing will create new long-term opportunities for high-purity soda ash.
- Asia Pacific will remain the dominant regional consumer due to strong industrial growth.
- Producers will invest in energy-efficient technologies to reduce operating costs.
- Environmental rules will push manufacturers toward cleaner and lower-emission processes.
- Capacity expansions in emerging markets will strengthen supply security.
- Specialty chemical applications will shape new demand segments.
- Market competition will increase as new producers enter high-growth regions.


