Market Overview:
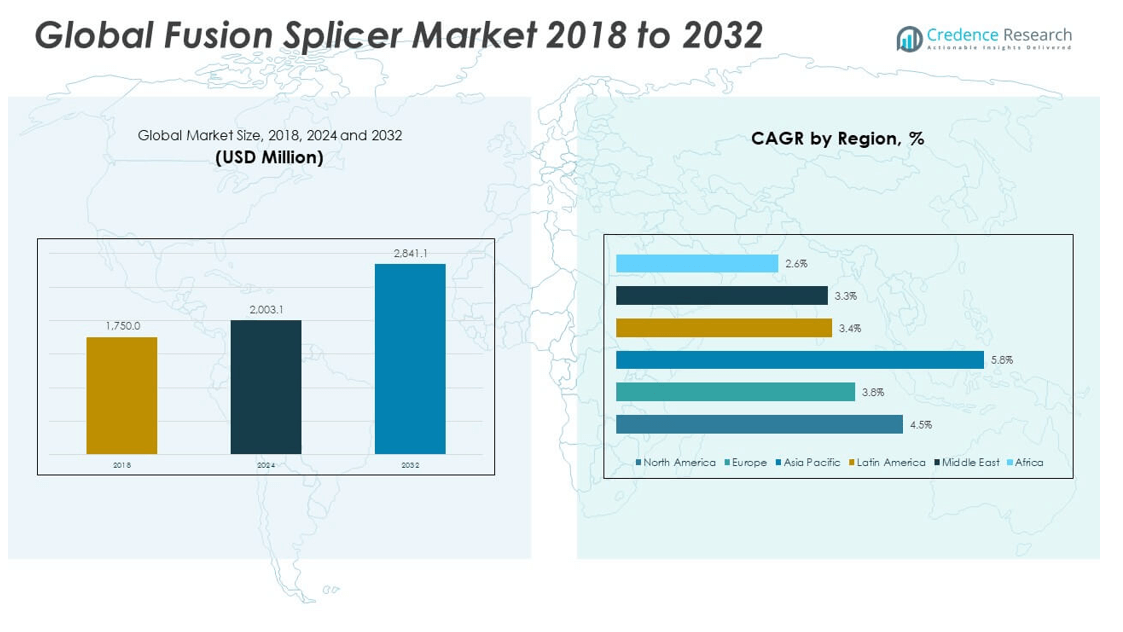
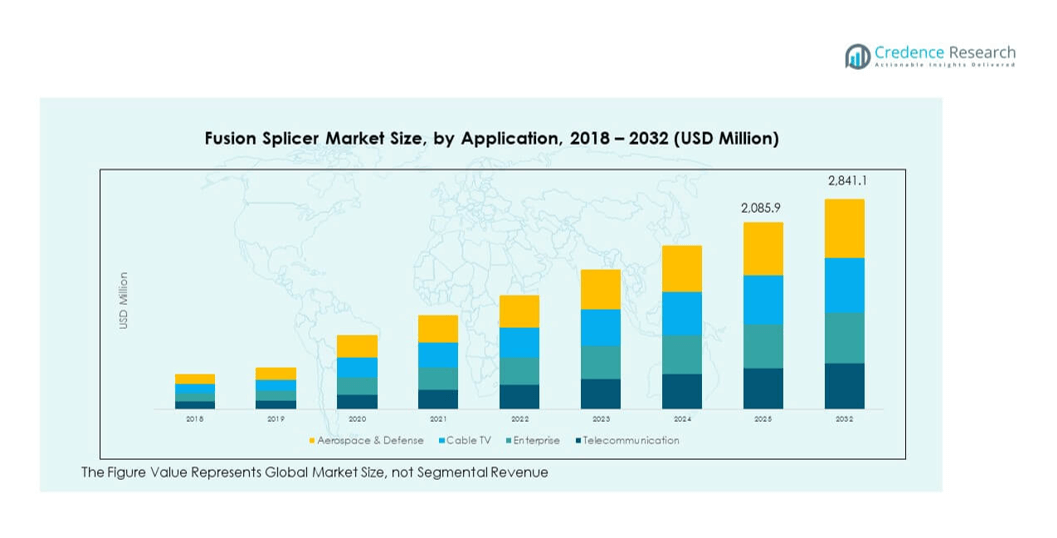
The Fusion Splicer Market size was valued at USD 1,750.00 million in 2018 to USD 2,003.10 million in 2024 and is anticipated to reach USD 2,841.14 million by 2032, at a CAGR of 4.51% during the forecast period.
| REPORT ATTRIBUTE |
DETAILS |
| Historical Period |
2020-2023 |
| Base Year |
2024 |
| Forecast Period |
2025-2032 |
| Fusion Splicer Market Size 2024 |
USD 2,003.10 million |
| Fusion Splicer Market, CAGR |
4.51% |
| Fusion Splicer Market Size 2032 |
USD 2,841.14 million |
The market growth is driven by the rising demand for high-speed broadband connectivity, fueled by the rapid expansion of fiber optic networks in telecommunications, data centers, and enterprise IT infrastructure. Advancements in fiber optic technology, coupled with government initiatives to enhance digital infrastructure, are boosting the adoption of fusion splicers. Furthermore, the increasing deployment of 5G networks and the need for low-loss, high-performance fiber connections in industrial automation, healthcare, and defense sectors are accelerating product demand globally.
Geographically, Asia-Pacific dominates the fusion splicer market due to extensive fiber optic network rollouts in countries such as China, Japan, and India, supported by large-scale telecom and 5G infrastructure projects. North America follows closely, driven by upgrades in broadband and data center connectivity. Europe remains a significant market, supported by digitalization initiatives across industries. Emerging regions such as Latin America and the Middle East & Africa are experiencing steady growth, fueled by expanding telecom penetration, smart city projects, and investments in modernizing communication networks.
Market Insights:
- The Fusion Splicer Market was valued at USD 2,003.10 million in 2024 and is projected to reach USD 2,841.14 million by 2032, growing at a CAGR of 4.51%.
- Expansion of global fiber optic networks for 5G, cloud, and IoT applications is driving steady demand for advanced fusion splicing solutions.
- Technological advancements such as AI-powered alignment and portable, rugged designs enhance efficiency and broaden adoption across sectors.
- High initial investment costs and the need for skilled technicians remain key restraints, particularly in cost-sensitive and emerging markets.
- North America leads the market with 36.94% share in 2024, supported by extensive telecom infrastructure and large-scale 5G rollouts.
- Asia Pacific is the fastest-growing region with strong government-backed fiber expansion programs in China, Japan, and India.
- Europe maintains significant demand due to national broadband projects, regulatory quality standards, and multi-industry fiber adoption.
Access crucial information at unmatched prices!
Request your sample report today & start making informed decisions powered by Credence Research Inc.!
Download Sample
Market Drivers:
Expanding Fiber Optic Network Deployments Across Telecommunications and IT Infrastructure
The growing global demand for high-speed internet connectivity drives extensive fiber optic network deployments in both developed and emerging economies. Governments and private operators are investing heavily in broadband expansion projects to support digital transformation, Industry 4.0 adoption, and smart city development. The Fusion Splicer Market benefits directly from this surge in fiber installations, as precise splicing ensures low signal loss and reliable performance. The rising adoption of cloud computing, streaming services, and IoT-based applications requires high-capacity networks, further boosting demand. Telecommunication service providers prioritize upgrading infrastructure to meet increasing data traffic needs. Data center expansions also contribute to a higher requirement for fusion splicing solutions. The integration of next-generation optical technologies creates a consistent replacement cycle for advanced splicing tools. Global initiatives to bridge the digital divide sustain long-term demand for high-quality fusion splicing equipment.
- For instance, in Q1 2023, AT&T added 272,000 net new AT&T Fiber subscribers, marking its 13th consecutive quarter with over 200,000 net additions. At that time, the company’s fiber network passed approximately 19.7 million customer locations.
Rising Adoption of 5G Networks Requiring Advanced Fiber Connectivity Solutions
The global rollout of 5G networks is accelerating the need for precise, low-loss fiber connections in both urban and rural deployments. Telecom operators are expanding fiber-to-the-antenna and fiber-to-the-home networks to meet the ultra-low latency requirements of 5G services. The Fusion Splicer Market gains from this expansion as splicers provide the accuracy needed for high-bandwidth applications. Industrial automation, autonomous vehicles, and advanced healthcare solutions also depend on robust 5G infrastructure. Network providers seek high-performance splicing equipment to reduce maintenance costs and enhance network uptime. The growing adoption of private 5G networks in manufacturing and logistics further stimulates demand. Enterprises are investing in secure and high-speed communication systems to remain competitive. Large-scale fiber backbone upgrades remain a central focus for mobile operators. Government policies supporting 5G expansion ensure sustained growth for fiber optic technologies.
Technological Advancements Enhancing Splicing Accuracy and Efficiency
Continuous innovation in splicing technology has led to more compact, efficient, and user-friendly devices. Modern fusion splicers integrate automated alignment systems, AI-based image processing, and improved battery efficiency, enabling faster and more precise operations. The Fusion Splicer Market benefits from these advancements as they reduce operational errors and improve productivity for field technicians. Equipment with enhanced environmental resistance supports outdoor and harsh-condition deployments. Manufacturers focus on developing multi-fiber splicers to handle high-density cable installations in data centers and telecom hubs. Portable splicing units are increasingly preferred for remote or temporary network expansions. Technological improvements also reduce the skill level required for operation, expanding the user base. Service providers adopt advanced splicers to minimize downtime and ensure consistent service delivery. The combination of speed, accuracy, and durability strengthens market adoption.
Government Initiatives Supporting Broadband and Digital Infrastructure Expansion
National broadband plans and public-private partnerships are key drivers in expanding fiber optic coverage worldwide. Governments are funding large-scale projects to improve digital access in underserved regions. The Fusion Splicer Market experiences growth as these initiatives require reliable fiber installations to meet quality standards. Rural connectivity programs create substantial opportunities for splicing equipment suppliers. Regulatory bodies set stringent network performance requirements, further pushing the adoption of advanced splicers. Education, healthcare, and e-governance projects depend on stable high-speed networks, increasing fiber deployment. International development agencies also contribute to financing connectivity projects in emerging economies. The rising demand for public Wi-Fi networks adds pressure on telecom infrastructure upgrades. Policy frameworks supporting competition in the telecom sector encourage rapid infrastructure investment.
- For instance, the U.S. government’s Broadband Equity, Access, and Deployment (BEAD) program allocated $42.45 billion to expand high-speed internet, prioritizing unserved and underserved areas.
Market Trends:
Integration of AI and Automation for Enhanced Splicing Performance
The adoption of AI-powered alignment and diagnostic features is reshaping operational efficiency in the splicing process. Automated systems reduce human error, improve consistency, and accelerate installation timelines. The Fusion Splicer Market is witnessing increased demand for smart devices capable of self-calibration and predictive maintenance. AI-driven analytics help technicians identify potential splice faults before they cause network issues. Automation also enables faster training for new technicians, reducing skill gaps in the workforce. Cloud-connected splicers support remote monitoring and performance optimization. Enhanced software capabilities allow better integration with network management systems. The combination of AI and automation is driving a new era of precision in fiber connectivity.
Growing Demand for Rugged and Weather-Resistant Splicing Equipment
The expansion of fiber networks into challenging terrains has increased the need for durable, weatherproof splicing devices. Equipment designed to operate under extreme temperatures, humidity, and dust conditions is gaining popularity. The Fusion Splicer Market is responding with models that offer reinforced casings and moisture protection. Field technicians prefer devices that maintain performance in remote rural areas and urban outdoor environments. The construction of long-haul networks often requires splicing in variable weather conditions. Rugged equipment ensures lower maintenance frequency and extended service life. Manufacturers are prioritizing shock-resistant designs for transportation over rough terrains. The demand for outdoor-compatible splicers is set to remain strong due to ongoing rural connectivity projects.
- For instance, the FITEL S179 Hand-Held Core Alignment Fusion Splicer by Furukawa Electric is ruggedly designed for harsh environments, featuring an IK07 mechanical impact rating (protecting against a 500 g force dropped from 40 cm), IPX2 water resistance (withstanding 3 mm/min drips for 10 minutes at a 15° tilt), and IP5X dust resistance (operational in particle sizes between 0.1 µm and 25 µm).
Adoption of Compact and Portable Splicing Solutions for Field Applications
Compact and lightweight splicing devices are becoming increasingly important for on-site network installations. Technicians prefer portable models that can be easily transported to multiple work locations in a single day. The Fusion Splicer Market is seeing strong uptake of handheld models with high battery capacity and quick operation cycles. These devices enable faster deployment in high-rise buildings, remote sites, and emergency network restoration. Portable units are also popular for temporary event infrastructure and military communication setups. Advances in miniaturization have not compromised performance, ensuring precision comparable to larger units. The shift toward mobility aligns with telecom companies’ need for flexible workforce operations. Compact devices also appeal to small-scale service providers.
Rising Popularity of Multi-Fiber and Ribbon Splicing Technologies
The increase in high-capacity network installations has driven demand for splicers capable of handling multiple fibers simultaneously. Ribbon splicing significantly reduces installation time in dense cable environments. The Fusion Splicer Market is benefiting from operators upgrading to multi-fiber technologies to support large data center expansions. These systems optimize cable management and reduce labor costs for large-scale projects. Enterprises implementing fiber-rich internal networks are also adopting ribbon splicing. Manufacturers are introducing models that switch between single and multi-fiber modes for flexibility. This trend is particularly strong in metropolitan fiber deployments where capacity requirements are high. Multi-fiber splicing continues to evolve with better alignment mechanisms and lower loss rates.
- For example, INNO’s ribbon fusion splicing technology such as found in the VIEW12R and VIEW12R Pro models enables the simultaneous splicing of up to 12 fibers via a motorized clamp alignment system, dramatically cutting both installation time and labor compared to traditional single-fiber fusion methods.
Market Challenges Analysis:
High Initial Costs and Maintenance Requirements Limiting Adoption
The advanced technology and precision engineering of fusion splicers contribute to high upfront costs, which can deter smaller service providers and contractors. Maintenance expenses and calibration requirements further add to operational budgets. The Fusion Splicer Market faces challenges in reaching cost-sensitive markets, particularly in developing regions. Limited budgets in small-scale network projects often result in the use of lower-cost alternatives. High repair costs in case of equipment damage also impact total ownership value. The need for specialized training to operate advanced splicers increases labor costs. Some operators opt for leasing models to manage expenses, which affects outright sales. Price competitiveness remains a key challenge for market expansion.
Skill Gaps and Availability of Trained Technicians Impacting Efficiency
Operating fusion splicers requires technical expertise, and a shortage of trained personnel affects installation quality. The Fusion Splicer Market faces delays in deployment timelines due to this skills gap. Inaccurate splicing caused by unskilled handling can lead to signal loss and network performance issues. Training programs take time and resources, which slows the integration of new technologies. Remote or rural areas often have limited access to skilled technicians, complicating network expansion. Service providers sometimes resort to outsourcing, which increases operational complexity. This shortage of expertise impacts large-scale fiber deployment schedules. Long-term solutions require consistent investment in workforce development.
Market Opportunities:
Expansion of Fiber Networks in Emerging Economies Creating High Demand
Rapid urbanization and digital transformation initiatives in emerging economies present significant growth potential for the Fusion Splicer Market. Governments in Asia, Africa, and Latin America are investing in broadband expansion to support economic development. It benefits from large-scale infrastructure projects focused on improving internet penetration rates. Increasing adoption of e-commerce, digital banking, and remote work models boosts demand for reliable fiber connectivity. Telecom operators are upgrading backbone networks to accommodate rising data consumption. These regions also offer untapped opportunities for affordable, portable splicing solutions. International funding agencies are backing projects to close the digital divide. Market players introducing cost-effective solutions can secure long-term growth in these areas.
Growing Role of Fiber Optics in Non-Telecom Applications
Fiber optic technology is expanding beyond telecom into industries such as healthcare, defense, energy, and transportation. The Fusion Splicer Market stands to gain from projects requiring secure, high-speed data transmission in these sectors. Hospitals adopt fiber networks for telemedicine, medical imaging, and data storage systems. Defense agencies use fiber for secure communication and surveillance systems. Smart grids in the energy sector rely on fiber networks for real-time monitoring. Transportation infrastructure integrates fiber for signaling and communication in railways and smart roads. These new applications diversify revenue sources for manufacturers. Vendors developing specialized splicers for these sectors can capture niche market segments.
Market Segmentation Analysis:
The Fusion Splicer Market is segmented
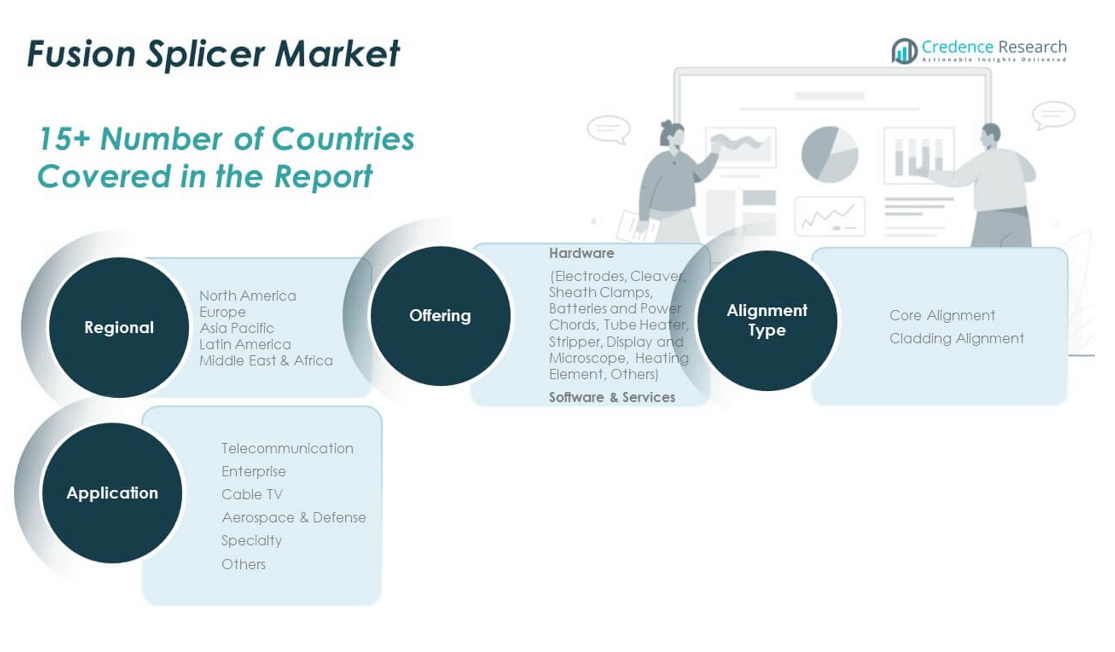
By offering into hardware and software & services. Hardware dominates revenue generation, with key components such as electrodes, cleavers, sheath clamps, batteries and power chords, tube heaters, strippers, display and microscope units, heating elements, and other accessories driving adoption. High replacement frequency of consumables like electrodes and cleavers supports recurring sales. Software & services play a growing role in enhancing device functionality, enabling predictive maintenance, and offering training and technical support to improve operational efficiency.
- For instance, in March 2023, AFL introduced a new range of specialty fusion splicing accessories, including the FSR-116 and CT-115 cleavers, specifically designed for high-reliability applications.
By application, the market covers telecommunication, enterprise, cable TV, aerospace & defense, specialty, and others. Telecommunication remains the largest segment due to large-scale fiber network expansions and 5G deployments. Enterprises invest in fusion splicing for secure, high-capacity internal networks, while cable TV operators upgrade infrastructure to deliver high-definition and streaming services. Aerospace & defense applications rely on splicers for secure communication and mission-critical systems. Specialty uses include industrial automation and healthcare networks.
By alignment type, the market is categorized into core alignment and cladding alignment. Core alignment holds the dominant share due to its high precision, low splice loss, and suitability for backbone network installations. Cladding alignment remains relevant for cost-sensitive projects and quick field deployments where ultra-high precision is not mandatory. The diverse applicability of both alignment types ensures broad adoption across varied network requirements.
- For example, Fujikura’s core alignment splicers achieve typical splice losses of just 0.02dB, suitable for backbone and long-haul network installations demanding ultra-low signal loss.
Segmentation:
By Offering
- Hardware
- Electrodes
- Cleaver
- Sheath Clamps
- Batteries and Power Chords
- Tube Heater
- Stripper
- Display and Microscope
- Heating Element
- Others
- Software & Services
By Application
- Telecommunication
- Enterprise
- Cable TV
- Aerospace & Defense
- Specialty
- Others
By Alignment Type
- Core Alignment
- Cladding Alignment
By Region
- North America
- Europe
- UK
- France
- Germany
- Italy
- Spain
- Russia
- Belgium
- Netherlands
- Austria
- Sweden
- Poland
- Denmark
- Switzerland
- Rest of Europe
- Asia Pacific
- China
- Japan
- South Korea
- India
- Australia
- Thailand
- Indonesia
- Vietnam
- Malaysia
- Philippines
- Taiwan
- Rest of Asia Pacific
- Latin America
- Brazil
- Argentina
- Peru
- Chile
- Colombia
- Rest of Latin America
- Middle East
- UAE
- KSA
- Israel
- Turkey
- Iran
- Rest of Middle East
- Africa
- Egypt
- Nigeria
- Algeria
- Morocco
- Rest of Africa
Regional Analysis:
North America
The North America Fusion Splicer Market size was valued at USD 654.50 million in 2018 to USD 740.33 million in 2024 and is anticipated to reach USD 1,048.67 million by 2032, at a CAGR of 4.5% during the forecast period. Holding 36.94% of the global market share in 2024, the region leads adoption due to advanced telecom infrastructure and large-scale 5G rollouts. It benefits from extensive fiber-to-the-home (FTTH) deployments and upgrades in data centers. Strong investments in broadband expansion programs in the U.S. and Canada support consistent demand. Enterprises prioritize high-performance fiber connectivity to enhance digital operations. The aerospace and defense sector also contributes to adoption through secure communication networks. Growing demand for low-loss, high-precision splicing solutions sustains market momentum. Continuous product innovation and vendor presence strengthen regional competitiveness.
Europe
The Europe Fusion Splicer Market size was valued at USD 451.50 million in 2018 to USD 496.31 million in 2024 and is anticipated to reach USD 664.12 million by 2032, at a CAGR of 3.8% during the forecast period. Accounting for 24.77% of the global market share in 2024, Europe experiences growth from national broadband initiatives and fiber upgrades in metro networks. The region’s emphasis on sustainable, high-speed connectivity drives splicer adoption. Leading economies such as Germany, the UK, and France focus on integrating advanced splicing technologies in large-scale infrastructure projects. The enterprise segment expands with increased cloud adoption and IoT deployments. Regulations mandating network quality push telecom operators to invest in precision splicing tools. Demand extends into healthcare, transportation, and industrial sectors. Regional manufacturers also enhance competitiveness with advanced and durable product lines.
Asia Pacific
The Asia Pacific Fusion Splicer Market size was valued at USD 426.83 million in 2018 to USD 510.28 million in 2024 and is anticipated to reach USD 798.93 million by 2032, at a CAGR of 5.8% during the forecast period. With a 25.48% share of the global market in 2024, it is the fastest-growing region, driven by extensive telecom infrastructure projects in China, Japan, and India. Government-backed fiber rollout programs aim to improve broadband penetration and support 5G deployment. The region benefits from cost-effective manufacturing and strong local vendor presence. Rapid urbanization fuels demand for high-capacity networks in residential and commercial spaces. Data center expansion in emerging economies further increases the need for precision splicing. Technological advancements in local production enhance accessibility for small and medium service providers. Continuous investments in rural connectivity strengthen long-term growth prospects.
Latin America
The Latin America Fusion Splicer Market size was valued at USD 95.90 million in 2018 to USD 108.55 million in 2024 and is anticipated to reach USD 141.12 million by 2032, at a CAGR of 3.4% during the forecast period. Representing 5.41% of the global market share in 2024, the region is expanding fiber networks to meet rising internet penetration. Countries like Brazil and Mexico lead investments in broadband infrastructure. Telecom operators focus on upgrading networks to deliver high-quality streaming and digital services. Growth in enterprise connectivity and cloud adoption boosts demand for splicing tools. Limited skilled workforce in rural areas challenges large-scale deployments, creating opportunities for automated splicer solutions. Cable TV operators also invest in fiber upgrades to compete with OTT platforms. Regional growth is supported by international funding for digital inclusion programs.
Middle East
The Middle East Fusion Splicer Market size was valued at USD 74.03 million in 2018 to USD 79.91 million in 2024 and is anticipated to reach USD 103.43 million by 2032, at a CAGR of 3.3% during the forecast period. Holding a 3.98% share of the global market in 2024, it benefits from smart city initiatives and high-speed connectivity projects in GCC countries. Investments in 5G infrastructure in the UAE and Saudi Arabia drive fiber demand. Enterprises adopt advanced network systems to support digital transformation in finance, healthcare, and manufacturing. Regional governments prioritize technology adoption to diversify economies. Data center expansions in major hubs enhance the need for reliable splicing solutions. Harsh climatic conditions push demand for ruggedized equipment. Local partnerships with global vendors help improve technology transfer and service capabilities.
Africa
The Africa Fusion Splicer Market size was valued at USD 47.25 million in 2018 to USD 67.71 million in 2024 and is anticipated to reach USD 84.86 million by 2032, at a CAGR of 2.6% during the forecast period. With a 3.42% share of the global market in 2024, growth is supported by international funding for broadband expansion. Countries like South Africa, Egypt, and Kenya lead regional deployments. Rising mobile internet adoption drives telecom operators to expand fiber backbone networks. Limited infrastructure in rural areas creates strong opportunities for portable, easy-to-use splicing devices. Government-backed digital inclusion programs aim to improve access in underserved communities. Emerging enterprise adoption in banking and education further supports demand. Partnerships with foreign technology providers enable faster deployment of advanced solutions.
Shape Your Report to Specific Countries or Regions & Enjoy 30% Off!
Key Player Analysis:
- Fujikura Ltd. (Japan)
- Sumitomo Electric Industries, Ltd. (Japan)
- Precision Rated Optics (United States)
- Inno Instrument Inc. (South Korea)
- Corning Inc. (United States)
- Fiberfox (South Korea)
- Signal Fire Technology (China)
- Furukawa Electric Co., Ltd. (Japan)
- China Electronics Technology Instruments Co., Ltd. (China)
- Ilsintech Co., Ltd. (South Korea)
Competitive Analysis:
The Fusion Splicer Market features a competitive landscape dominated by established players such as Fujikura Ltd., Sumitomo Electric Industries, Ltd., Corning Inc., and Furukawa Electric Co., Ltd., alongside emerging manufacturers from Asia. It is characterized by strong product differentiation, driven by technological innovation, rugged design enhancements, and integration of AI-based alignment systems. Leading companies focus on expanding global distribution networks, entering strategic partnerships, and investing in R&D to improve efficiency and precision. Competitive strategies include targeted acquisitions, introduction of portable high-performance models, and tailored solutions for telecom, enterprise, and defense applications. Intense competition encourages continuous product upgrades and competitive pricing. Companies also emphasize after-sales support to build customer loyalty. Market leaders invest in training programs to expand the skilled workforce and improve operational efficiency for end-users.
Recent Developments:
- In April 2025, Furukawa Electric, in collaboration with Lightera, introduced the FITEL S185EVROF fusion splicer, combining Ring of Fire® and End View (EDV) technologies in one compact device. Designed for precision splicing of hollow-core and multi-core fibers, it delivers rotational alignment accuracy, low-loss performance, and enhanced operator control, setting a new standard in optical network infrastructure.
- In September 2024, Trend Networks launched the FiberMaster Fusion Splicer, a new tool designed to enhance both efficiency and precision in fiber optic installations. This splicer offers faster splicing times and improved accuracy, ensuring higher performance and minimized downtime for network deployments. Its reliability and cost-effectiveness make it especially well-suited to meet the fast-growing demands of telecom operators and field engineers.
Market Concentration & Characteristic
The Fusion Splicer Market demonstrates moderate concentration, with a few multinational companies holding a significant share while regional vendors compete in price-sensitive segments. It is defined by high technological entry barriers, reliance on precision engineering, and a strong emphasis on product reliability. The market favors manufacturers with extensive service networks and technical support capabilities. Demand is sustained by recurring sales of consumables such as electrodes and cleavers, creating long-term client relationships. Innovation speed and brand reputation play critical roles in sustaining market position. Regional players often focus on affordability to compete with established brands. Long-term growth depends on balancing cost efficiency with advanced technological integration.
Report Coverage:
The research report offers an in-depth analysis based on Offering, Application and Alignment Type. It details leading market players, providing an overview of their business, product offerings, investments, revenue streams, and key applications. Additionally, the report includes insights into the competitive environment, SWOT analysis, current market trends, as well as the primary drivers and constraints. Furthermore, it discusses various factors that have driven market expansion in recent years. The report also explores market dynamics, regulatory scenarios, and technological advancements that are shaping the industry. It assesses the impact of external factors and global economic changes on market growth. Lastly, it provides strategic recommendations for new entrants and established companies to navigate the complexities of the market.
Future Outlook:
- Increasing deployment of fiber networks for 5G, cloud computing, and IoT will sustain demand for advanced splicing solutions.
- Rising adoption of AI-enabled and automated splicers will improve operational efficiency and reduce skill dependency.
- Expansion of data centers and high-capacity backbone networks will drive the need for precision splicing technologies.
- Growing investments in rural and underserved region connectivity projects will create new opportunities for portable and cost-effective models.
- Enhanced durability and weather-resistant designs will gain traction for outdoor and harsh-environment installations.
- Integration of remote monitoring and predictive maintenance features will strengthen product value propositions.
- Broader application in non-telecom sectors such as defense, healthcare, and industrial automation will diversify revenue streams.
- Strategic collaborations between global and regional vendors will improve technology accessibility and market reach.
- Rising competition will accelerate innovation cycles and expand the range of mid-priced, high-performance models.
- Government-backed digital infrastructure programs will support steady long-term market expansion.


