Market Overview
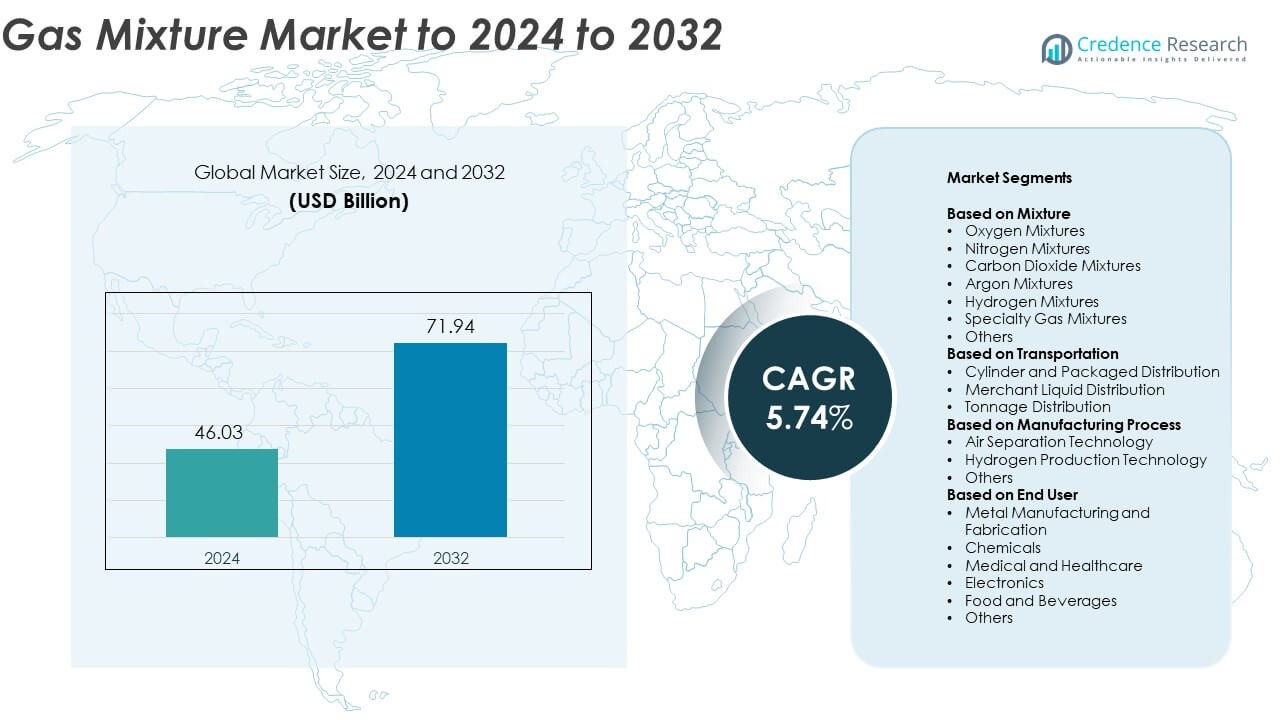
Gas Mixture Market size was valued at USD 46.03 Billion in 2024 and is anticipated to reach USD 71.94 Billion by 2032, at a CAGR of 5.74% during the forecast period.
| REPORT ATTRIBUTE |
DETAILS |
| Historical Period |
2020-2023 |
| Base Year |
2024 |
| Forecast Period |
2025-2032 |
| Gas Mixture Market Size 2024 |
USD 46.03 Billion |
| Gas Mixture Market, CAGR |
5.74% |
| Gas Mixture Market Size 2032 |
USD 71.94 Billion |
The gas mixture market is led by key players including Linde Plc, Air Products Inc., Air Liquide, Messer, Praxair Technology, Inc., AGC Inc., Matheson Tri-Gas, Inc., Hangzhou Hangyang Co. LTD, Guangdong Huate Gas Co., Ltd, and SCG. These companies dominate through extensive production networks, strong R&D capabilities, and diversified product portfolios catering to industrial, medical, and specialty applications. North America leads the global market with a 34.6% share in 2024, supported by advanced industrial infrastructure and high adoption in healthcare and manufacturing. Europe follows with 27.8%, while Asia-Pacific holds 29.5%, driven by rapid industrialization and expanding electronics production.
Access crucial information at unmatched prices!
Request your sample report today & start making informed decisions powered by Credence Research Inc.!
Download Sample
Market Insights
- The gas mixture market was valued at USD 46.03 Billion in 2024 and is projected to reach USD 71.94 Billion by 2032, growing at a CAGR of 5.74%.
• Rising demand from medical, metal fabrication, and chemical industries drives global market expansion, with oxygen mixtures holding 29.4% share as the leading segment.
• Increasing adoption of specialty and customized gas mixtures for high-precision applications marks a key market trend, supported by automation and IoT integration in production.
• The market remains moderately consolidated, with global players investing in advanced gas technologies and regional collaborations to strengthen supply chains.
• North America leads with 34.6% share, followed by Asia-Pacific at 29.5% and Europe at 27.8%, reflecting strong industrialization and healthcare demand across these key regions.
Market Segmentation Analysis:
By Mixture
The oxygen mixtures segment dominates the gas mixture market with around 29.4% share in 2024. Its leadership stems from widespread use in medical, metal fabrication, and chemical industries for combustion enhancement and oxidation processes. The rising demand from healthcare facilities for respiratory therapies and surgical procedures supports consistent growth. Expanding steel and glass manufacturing also boosts adoption due to oxygen’s role in improving process efficiency and product quality. Continuous industrialization and increased demand for high-purity gases in electronics manufacturing further strengthen this segment’s position globally.
- For instance, Linde has deployed over 160 oxy-fuel glass and metal reheating installations worldwide, supporting oxygen-rich combustion in fabrication lines.
By Transportation
The cylinder and packaged distribution segment leads the market, accounting for nearly 47.6% share in 2024. This dominance is driven by its flexibility in small- and medium-scale industrial applications, including laboratories, medical facilities, and manufacturing plants. Packaged gases are easier to handle and ensure purity, making them suitable for controlled environments. Growing adoption across healthcare, food processing, and welding industries increases the need for reliable cylinder-based distribution systems. The rise of portable medical gas cylinders and improved logistics infrastructure continues to support segment expansion.
- For instance, Air Products supplies non-refillable “quad-gas” calibration cylinders, including 110 L packages used for multi-gas field testing and safety checks.
By Manufacturing Process
Air separation technology dominates the gas mixture market, representing about 55.2% share in 2024. Its leadership is attributed to the ability to produce large volumes of high-purity oxygen, nitrogen, and argon efficiently. Industries such as steelmaking, chemicals, and electronics rely heavily on these gases for controlled manufacturing conditions. Increasing investments in cryogenic air separation units and advancements in membrane separation systems further enhance efficiency and cost-effectiveness. The global shift toward energy-efficient production processes also supports adoption of modern air separation methods across industrial gas facilities.
Key Growth Drivers
Rising Industrial and Manufacturing Applications
The growing use of gas mixtures across metal fabrication, chemical processing, and electronics manufacturing drives market expansion. Oxygen, nitrogen, and argon mixtures are essential in welding, cutting, and refining operations, improving efficiency and product quality. Increasing industrialization in emerging economies and the rise in steel and chemical production fuel demand for consistent gas supplies. Advanced production techniques and automation further enhance gas consumption across manufacturing sectors, supporting long-term market growth.
- For instance, Messer’s OXIPYR LEAF air-oxy fuel system enabled an aluminum recycler to lift throughput by >15% while cutting natural-gas use by 15% (and reducing oxygen consumption by 25-30%) in production.
Expanding Healthcare and Medical Usage
The medical and healthcare sector significantly contributes to the gas mixture market’s growth. Demand for high-purity oxygen, nitrous oxide, and specialty mixtures has surged due to growing hospital infrastructure and advanced respiratory care systems. Widespread use in anesthesia, diagnostics, and life-support equipment further strengthens this trend. Increasing chronic disease prevalence and healthcare investments across developed and emerging regions boost consumption. The growing focus on home healthcare and emergency medical applications also sustains market demand.
- For instance, Messer delivers 30,000+ medical-gas orders each month in the U.S., with a 99.9% on-time rate supporting hospitals and homecare.
Growing Semiconductor and Electronics Industry
Rising adoption of gas mixtures in semiconductor manufacturing and electronics fabrication acts as a key market driver. Nitrogen, hydrogen, and specialty gas mixtures ensure clean processing environments and high-quality component production. The ongoing expansion of semiconductor fabrication plants, especially in Asia-Pacific, fuels strong demand. Technological advances such as miniaturization and high-performance chip production increase the need for precise gas compositions. The global push for digital transformation and electric mobility further accelerates consumption in the electronics sector.
Key Trends & Opportunities
Shift Toward Specialty and Custom Gas Mixtures
There is a growing trend toward specialty and custom gas mixtures tailored for high-precision industrial and research applications. Industries such as pharmaceuticals, environmental monitoring, and food packaging increasingly rely on specific blend ratios to meet regulatory and quality standards. Manufacturers are investing in advanced mixing technologies and automated filling systems to ensure accuracy and consistency. This shift toward high-value specialty products presents lucrative opportunities for suppliers focusing on innovation and precision gas solutions.
- For instance, Air Liquide offers calibration mixtures containing 2 to 40 components, enabling precise, regulation-grade analytical setups.
Integration of Automation and IoT in Gas Management
Automation and Internet of Things (IoT) technologies are transforming gas mixture production and distribution. Smart monitoring systems enable real-time tracking of gas purity, pressure, and usage across facilities. Digital platforms help optimize inventory, reduce waste, and enhance safety. The adoption of predictive maintenance and automated control in gas plants improves operational efficiency. As industries move toward Industry 4.0 standards, integrating IoT-enabled systems creates strong growth prospects for gas mixture suppliers.
- For instance, Linde signed 59 new small on-site agreements in 2024 to build, own and operate 64 plants, expanding digitally monitored supply at customer sites.
Key Challenges
High Production and Storage Costs
The gas mixture market faces significant challenges due to high production, storage, and transportation costs. Maintaining gas purity and stability requires specialized equipment, controlled environments, and continuous monitoring. Cryogenic storage systems and complex handling processes add further operational expenses. Smaller suppliers often face difficulties meeting quality standards while remaining cost-competitive. Volatile energy prices and logistics constraints also impact overall profitability, particularly in regions with limited infrastructure for industrial gas distribution.
Stringent Safety and Regulatory Compliance
Strict safety and environmental regulations create hurdles for gas mixture producers and distributors. Compliance with standards such as ISO 14175 and regional safety norms requires rigorous testing, certification, and documentation. Improper handling or leakage can lead to hazardous conditions, raising liability risks. Companies must invest heavily in training, monitoring systems, and safe storage infrastructure to meet compliance requirements. These regulatory pressures increase operational costs and slow expansion in smaller markets with evolving safety frameworks.
Regional Analysis
North America
North America accounts for around 34.6% share of the global gas mixture market in 2024. The region benefits from a strong presence of established industrial gas manufacturers and advanced healthcare infrastructure. High demand from the medical, semiconductor, and metal fabrication industries supports steady market expansion. The United States dominates regional growth due to robust chemical and electronics production. Increasing investments in clean energy and hydrogen technologies also contribute to the growing adoption of gas mixtures. Stringent safety regulations and continuous innovation in gas distribution systems further strengthen regional leadership.
Europe
Europe holds about 27.8% share of the gas mixture market in 2024, driven by strong industrial and environmental policies. The region’s emphasis on decarbonization and sustainable manufacturing boosts demand for gas mixtures in metal processing, healthcare, and food industries. Germany, the United Kingdom, and France lead consumption owing to advanced industrial automation and renewable energy initiatives. Expanding semiconductor and medical equipment manufacturing sectors also add to growth. Continuous innovation in specialty gas production and increased use of green hydrogen mixtures support market advancement across the region.
Asia-Pacific
Asia-Pacific represents approximately 29.5% share of the global gas mixture market in 2024. Rapid industrialization, expanding healthcare infrastructure, and the rise of electronics manufacturing hubs drive strong demand. China, Japan, South Korea, and India lead regional adoption due to high consumption in steelmaking, semiconductors, and medical applications. Investments in air separation units and energy-efficient production systems further accelerate growth. The growing automotive and renewable energy sectors are also major contributors. Increasing government initiatives promoting industrial modernization and clean technologies enhance long-term market prospects.
Latin America
Latin America captures around 4.7% share of the gas mixture market in 2024. The region’s growth is supported by expanding chemical, healthcare, and metal fabrication industries. Brazil and Mexico lead adoption due to rising demand for oxygen, nitrogen, and carbon dioxide mixtures in manufacturing and food processing. Growing investments in energy infrastructure and healthcare modernization stimulate gas consumption. However, inconsistent regulatory frameworks and supply chain challenges limit rapid expansion. Strengthening industrial production and regional partnerships with global gas suppliers are expected to enhance market penetration in coming years.
Middle East and Africa
The Middle East and Africa account for nearly 3.4% share of the global gas mixture market in 2024. Rising industrial diversification efforts, particularly in Saudi Arabia, the UAE, and South Africa, fuel demand across healthcare, metal fabrication, and chemical industries. The growing focus on oil and gas processing and renewable energy projects further drives usage. Infrastructure development and expansion of industrial gas plants contribute to market progress. However, limited technological adoption and dependency on imports pose challenges. Increasing collaboration with international gas producers supports capacity enhancement and regional supply reliability.
Market Segmentations:
By Mixture
- Oxygen Mixtures
- Nitrogen Mixtures
- Carbon Dioxide Mixtures
- Argon Mixtures
- Hydrogen Mixtures
- Specialty Gas Mixtures
- Others
By Transportation
- Cylinder and Packaged Distribution
- Merchant Liquid Distribution
- Tonnage Distribution
By Manufacturing Process
- Air Separation Technology
- Hydrogen Production Technology
- Others
By End User
- Metal Manufacturing and Fabrication
- Chemicals
- Medical and Healthcare
- Electronics
- Food and Beverages
- Others
By Geography
- North America
- Europe
- Germany
- France
- U.K.
- Italy
- Spain
- Rest of Europe
- Asia Pacific
- China
- Japan
- India
- South Korea
- South-east Asia
- Rest of Asia Pacific
- Latin America
- Brazil
- Argentina
- Rest of Latin America
- Middle East & Africa
- GCC Countries
- South Africa
- Rest of the Middle East and Africa
Competitive Landscape
The competitive landscape of the gas mixture market is shaped by major global players such as Linde Plc (Ireland), Air Products Inc. (U.S.), Guangdong Huate Gas Co., Ltd (China), AGC Inc. (Japan), Praxair Technology, Inc. (U.S.), SCG (Thailand), Air Liquide (France), Hangzhou Hangyang Co. LTD (China), Matheson Tri-Gas, Inc. (U.S.), and Messer (Germany). The market is characterized by high technological advancement, strategic collaborations, and capacity expansions to meet growing industrial and medical gas demand. Companies are focusing on developing advanced specialty gas mixtures and enhancing production efficiency through automation and digital control systems. Strategic mergers, joint ventures, and regional partnerships are common approaches to strengthen global supply networks. Continuous investment in research for sustainable and energy-efficient gas production further drives competition. The rising emphasis on customized gas solutions and compliance with stringent purity and safety standards continues to differentiate market leaders from regional and emerging participants.
Shape Your Report to Specific Countries or Regions & Enjoy 30% Off!
Key Player Analysis
- Linde Plc (Ireland)
- Air Products Inc. (U.S.)
- Guangdong Huate Gas Co.,Ltd (China)
- AGC Inc. (Japan)
- Praxair Technology, Inc. (U.S.)
- SCG (Thailand)
- Air Liquide (France)
- Hangzhou Hangyang CO. LTD (China)
- Matheson Tri-Gas, Inc. (U.S.)
- Messer (Germany)
Recent Developments
- In 2025, Air Liquide secured new long-term hydrogen supply agreements with two major U.S. refiners in Texas and is investing close to 50 million.
- In 2025, Linde plc Expanded ultra-high-purity atmospheric, process, and specialty gas supply to Samsung’s Pyeongtaek complex.
- In 2023, Messer introduced the MegaPack D series, a digital cylinder bundle version that allows for remote monitoring of fill levels and integration into Industry 4.0 applications.
Report Coverage
The research report offers an in-depth analysis based on Mixture, Transportation, Manufacturing Process, End-User and Geography. It details leading market players, providing an overview of their business, product offerings, investments, revenue streams, and key applications. Additionally, the report includes insights into the competitive environment, SWOT analysis, current market trends, as well as the primary drivers and constraints. Furthermore, it discusses various factors that have driven market expansion in recent years. The report also explores market dynamics, regulatory scenarios, and technological advancements that are shaping the industry. It assesses the impact of external factors and global economic changes on market growth. Lastly, it provides strategic recommendations for new entrants and established companies to navigate the complexities of the market.
Future Outlook
- Rising demand from healthcare and medical sectors will continue to drive global consumption.
- Increasing adoption of specialty gas mixtures will support high-value industrial applications.
- Growth in semiconductor and electronics manufacturing will strengthen long-term market prospects.
- Expanding renewable energy and hydrogen production projects will boost gas usage.
- Technological advancements in air separation and cryogenic systems will enhance production efficiency.
- Greater focus on sustainability will encourage development of eco-friendly gas mixtures.
- Industrial automation and IoT integration will improve gas management and monitoring accuracy.
- Expansion of industrial infrastructure in emerging economies will create new growth opportunities.
- Stringent quality and safety standards will push manufacturers to upgrade production systems.
- Strategic partnerships and capacity expansions by key players will shape the competitive landscape.


