
| REPORT ATTRIBUTE | DETAILS |
|---|---|
| Historical Period | 2020-2023 |
| Base Year | 2024 |
| Forecast Period | 2025-2032 |
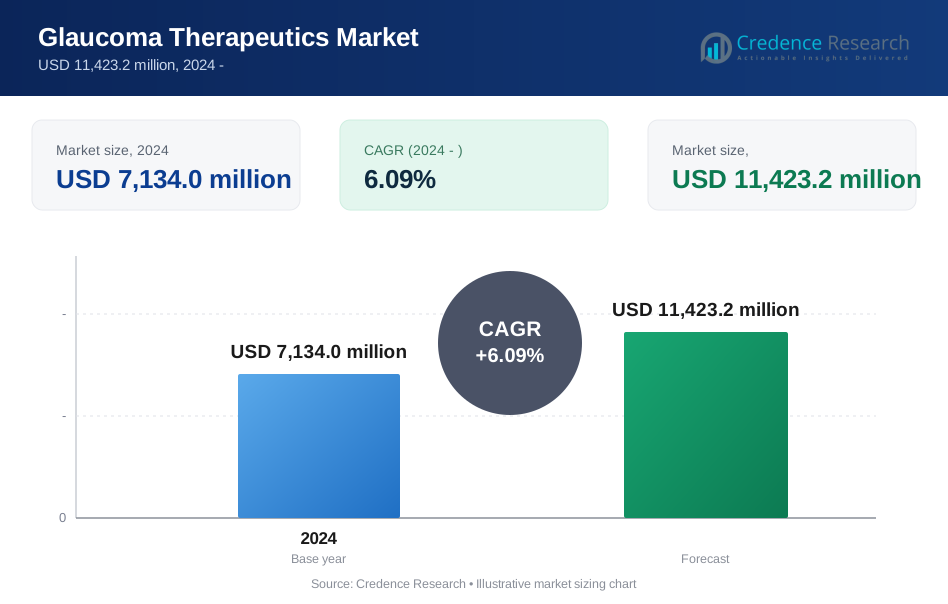
| Glaucoma Therapeutics Market Size 2024 | USD 7,134.0 million |
| Glaucoma Therapeutics Market, CAGR | 6.09% |
| Glaucoma Therapeutics Market Size 2032 | USD 11,423.2 million |
Market Overview:
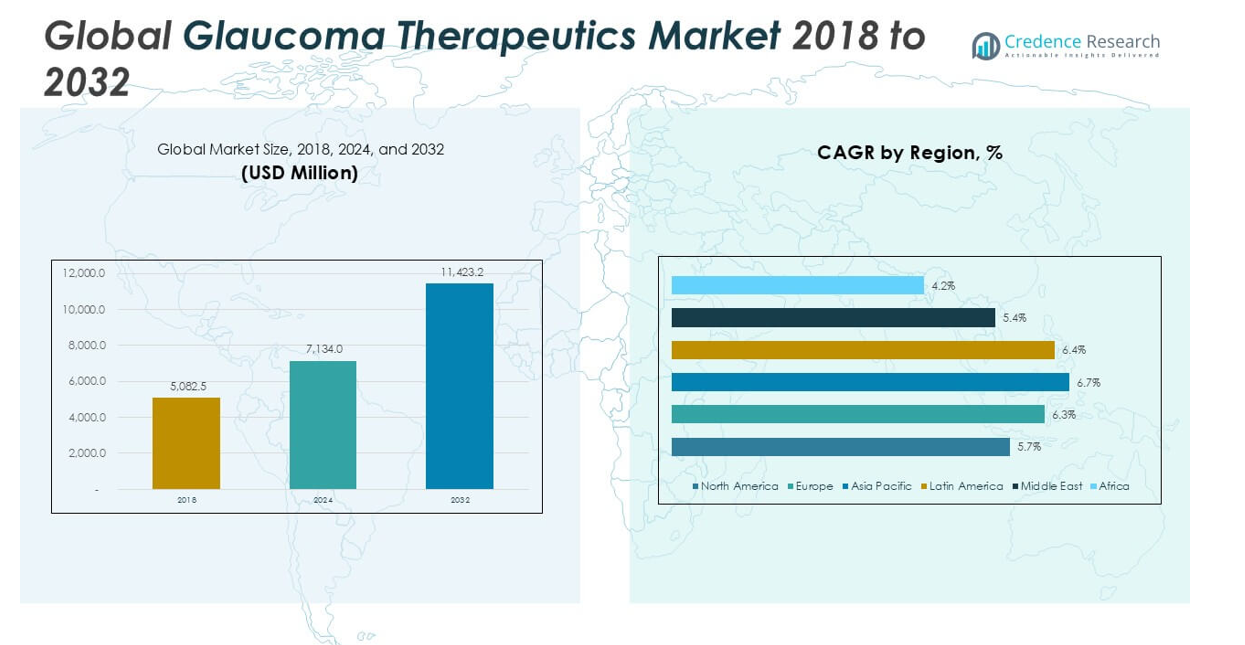
The Glaucoma Therapeutics market was valued at USD 5,082.5 million in 2018, reached USD 7,134.0 million in 2024, and is anticipated to reach USD 11,423.2 million by 2032, at a CAGR of 6.09% during the forecast period.
The Glaucoma Therapeutics market is dominated by top players such as Allergan plc., Novartis AG, Pfizer Inc., Merck & Co., Inc., Bausch & Lomb Incorporated, Teva Pharmaceuticals, and Santen Pharmaceuticals Co. Ltd. These companies maintain leadership through strong product portfolios, significant investments in R&D, and broad global reach. North America stands as the leading region, capturing 31.9% of the global market share in 2024, supported by advanced healthcare infrastructure and high rates of disease awareness and diagnosis. Europe and Asia Pacific follow, with substantial market shares driven by expanding patient populations, improved access to eye care, and the introduction of innovative therapies.
Market Insights
- The Glaucoma Therapeutics market was valued at USD 7,134.0 million in 2024 and is projected to reach USD 11,423.2 million by 2032, registering a CAGR of 6.09% over the forecast period.
- Increasing prevalence of glaucoma, especially among aging populations, and greater awareness of early diagnosis are key drivers supporting market expansion worldwide.
- Major trends include a shift toward fixed-dose combination therapies and innovative sustained-release drug delivery systems, which improve treatment adherence and clinical outcomes.
- The market is highly competitive, with leading players such as Allergan plc., Novartis AG, Pfizer Inc., and Bausch & Lomb Incorporated focusing on product innovation, while price pressures and regulatory hurdles restrain growth.
- North America holds the largest regional share at 31.9%, followed by Asia Pacific at 27.4% and Europe at 22.1%; prostaglandin analogs lead the drug class segment with the highest market share due to strong efficacy and patient compliance.
Market Segmentation Analysis:
By Drug Class:
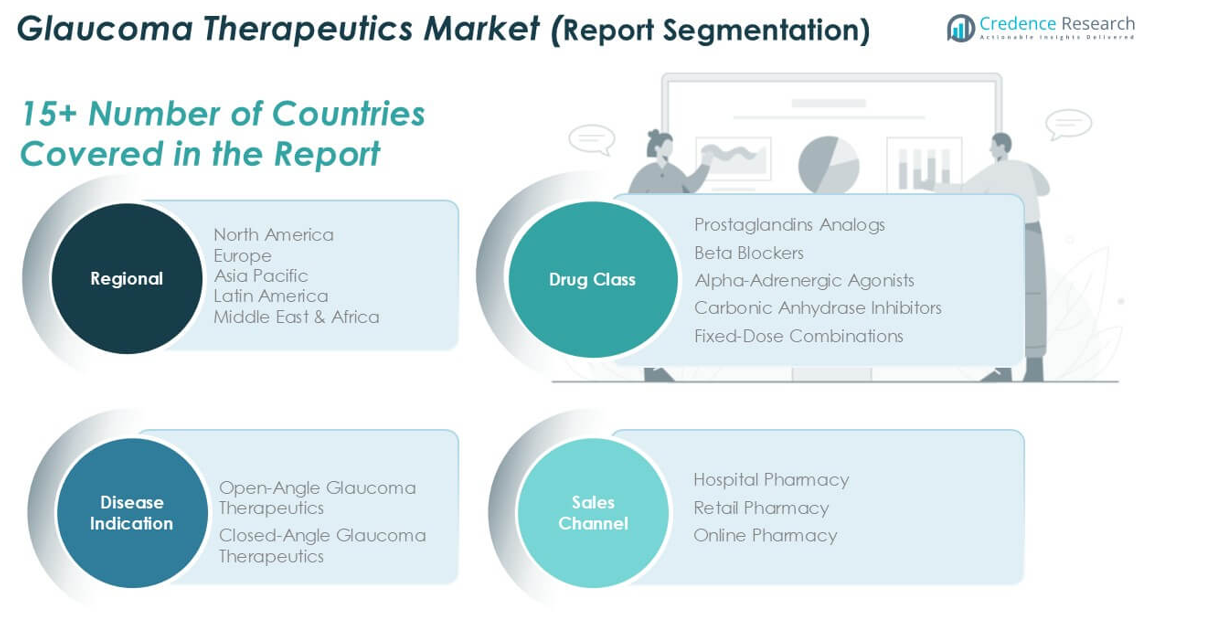
In the Glaucoma Therapeutics market, Prostaglandin Analogs represent the dominant drug class, accounting for the largest market share. Their widespread adoption stems from their proven efficacy in lowering intraocular pressure, convenient once-daily dosing, and favorable safety profile. The strong preference for Prostaglandin Analogs is further driven by clinical guidelines that recommend them as a first-line therapy for most glaucoma patients. Beta Blockers and Alpha-Adrenergic Agonists also contribute significant shares, but their use is generally limited by potential systemic side effects and lower efficacy compared to prostaglandins.
- For instance, Allergan’s LUMIGAN (bimatoprost ophthalmic solution 0.01%) demonstrated a mean reduction in intraocular pressure of 7.0 to 8.0 mmHg from baseline after 12 weeks in Phase III clinical trials.
By Disease Indication:
Open-Angle Glaucoma Therapeutics hold the largest share within the disease indication segment, supported by the high global prevalence of open-angle glaucoma. This form of the disease is more common, especially among older adults, and typically requires long-term medical management. Market growth is driven by rising awareness, early diagnosis, and expanding geriatric populations, all of which increase demand for effective long-term treatment options. Closed-Angle Glaucoma Therapeutics, while essential, comprise a smaller portion of the market due to the relatively lower incidence of this condition.
- For instance, Novartis AG’s TRAVATAN Z (travoprost ophthalmic solution 0.004%) is approved for open-angle glaucoma management in over 90 countries, with more than 25 million bottles dispensed worldwide since launch.
By Sales Channel:
Hospital Pharmacies dominate the sales channel segment of the Glaucoma Therapeutics market, holding the highest revenue share. This leadership is attributed to the regular need for prescription renewals and ongoing specialist consultations, which are often facilitated in hospital settings. Retail Pharmacies follow, serving as accessible points for prescription fulfillment and patient counseling. Online Pharmacies are witnessing steady growth, supported by the rising preference for digital health solutions and home delivery services, but they remain a smaller segment in terms of overall market share.
Market Overview
Rising Prevalence of Glaucoma
The global increase in glaucoma cases, particularly among aging populations, acts as a primary driver for market growth. As the risk of glaucoma rises with age, countries with expanding elderly demographics experience higher diagnostic rates and greater demand for long-term therapeutic management. Heightened awareness initiatives and routine eye screening programs contribute to early disease detection, leading to a larger patient pool seeking effective pharmaceutical solutions and supporting sustained expansion of the glaucoma therapeutics market.
- For instance, Santen Pharmaceutical’s 2022 outreach initiatives facilitated screening for over 150,000 individuals across Asia and Europe, resulting in more than 8,000 newly diagnosed glaucoma cases.
Advancements in Drug Formulation and Delivery
Continuous innovation in drug formulation, such as sustained-release implants and fixed-dose combination therapies, is improving treatment efficacy and patient compliance. Pharmaceutical companies are investing in novel delivery mechanisms that reduce dosing frequency and minimize side effects, addressing key barriers to long-term adherence. These advancements not only enhance clinical outcomes but also drive product differentiation and market adoption, creating robust growth opportunities within the glaucoma therapeutics landscape.
- For instance, Bausch & Lomb’s DURYSTA (bimatoprost implant) provides sustained intraocular pressure reduction for up to 12 weeks with a single 10-mcg biodegradable implant, according to FDA approval data.
Expansion of Healthcare Access and Infrastructure
Growing investments in healthcare infrastructure and expanding access to ophthalmology care in emerging economies are fueling market growth. Government initiatives to provide affordable eye care, increased availability of prescription medications, and rising insurance coverage are making glaucoma management more accessible to broader populations. Enhanced diagnostic capabilities and integration of eye health services in primary care settings further support increased diagnosis and treatment rates, propelling market demand.
Key Trends & Opportunities
Shift Toward Minimally Invasive Therapies
A major trend shaping the glaucoma therapeutics market is the growing preference for minimally invasive treatment options. Developments in micro-dosing devices and biodegradable implants allow for targeted drug delivery with fewer side effects, improving both efficacy and patient experience. This shift is opening new revenue streams for companies that focus on innovative, less invasive therapies, while supporting long-term patient retention.
- For instance, more than 250,000 Hydrus Microstent devices (Alcon/Ivantis) have been implanted globally for minimally invasive glaucoma surgery since its market introduction, according to company reports in 2023.
Digital Health Integration and Telemedicine
The integration of digital health platforms and telemedicine is transforming patient management and follow-up care in glaucoma. Remote monitoring tools, mobile applications for medication reminders, and teleophthalmology consultations improve adherence and enable early intervention for disease progression. These digital solutions not only enhance patient outcomes but also offer pharmaceutical companies new channels for patient engagement and real-world data collection.
- For instance, in 2023, the Glaukos iStent Connected Care platform tracked and supported medication compliance for more than 17,000 glaucoma patients through remote monitoring in the United States.
Key Challenges
Patient Non-Adherence to Treatment Regimens
One of the primary challenges in the glaucoma therapeutics market is patient non-adherence to prescribed medication schedules. Complex dosing regimens, side effects, and the asymptomatic nature of early-stage glaucoma often result in poor compliance, reducing treatment effectiveness. Addressing this issue requires continued investment in patient education, simplified therapies, and technologies that facilitate better adherence.
Regulatory Hurdles and Market Access Barriers
Stringent regulatory requirements and lengthy drug approval processes can delay the introduction of novel therapies. Variations in healthcare regulations across countries, coupled with reimbursement challenges, hinder the swift adoption of advanced treatments in many markets. Companies must navigate complex approval pathways and collaborate with stakeholders to accelerate access and streamline commercialization efforts.
High Cost of Advanced Therapies
The rising cost of innovative glaucoma treatments and novel drug delivery systems poses affordability challenges, particularly in low- and middle-income regions. Limited insurance coverage for specialty drugs and the financial burden on patients may restrict access to advanced therapeutics. This challenge underscores the need for pricing strategies, partnerships, and public health initiatives to make effective glaucoma care more accessible and equitable.
Regional Analysis
North America
North America leads the global glaucoma therapeutics market, accounting for the largest share at 31.9% in 2024. The market grew from USD 1,660.46 million in 2018 to USD 2,279.61 million in 2024, and is projected to reach USD 3,541.20 million by 2032, at a CAGR of 5.7%. The region’s dominance is underpinned by high disease awareness, advanced healthcare infrastructure, and early adoption of innovative therapeutics. Continuous investment in ophthalmology research and strong insurance coverage further support sustained market expansion across the United States and Canada.
Europe
Europe holds a substantial share of 22.1% in the glaucoma therapeutics market in 2024. The market advanced from USD 1,113.58 million in 2018 to USD 1,579.56 million in 2024 and is expected to reach USD 2,564.52 million by 2032, registering a CAGR of 6.3%. The growth in Europe is attributed to well-established eye care services, increasing prevalence of glaucoma in aging populations, and expanding reimbursement for novel treatments. Regulatory initiatives and public health campaigns continue to drive early diagnosis and improve patient access to effective glaucoma medications.
Asia Pacific
Asia Pacific emerges as a rapidly growing market, representing a 27.4% share in 2024. The market expanded from USD 1,344.32 million in 2018 to USD 1,954.81 million in 2024, and is forecasted to reach USD 3,275.04 million by 2032, growing at a CAGR of 6.7%. Rising healthcare investment, large elderly populations, and improving access to ophthalmology care drive demand. The region also benefits from increasing awareness, government health initiatives, and adoption of new drug delivery technologies, supporting strong market expansion across China, India, Japan, and Southeast Asia.
Latin America
Latin America comprises 8.3% of the global glaucoma therapeutics market in 2024. The market increased from USD 412.70 million in 2018 to USD 590.90 million in 2024 and is expected to reach USD 970.98 million by 2032, at a CAGR of 6.4%. Expanding urban populations, greater access to healthcare, and growing awareness about the importance of early glaucoma detection contribute to market growth. Local and multinational pharmaceutical firms are strengthening their presence, improving drug availability and supporting the region’s market momentum.
Middle East
The Middle East represents a 6.0% share of the global glaucoma therapeutics market in 2024. The market advanced from USD 313.59 million in 2018 to USD 424.88 million in 2024, and is projected to reach USD 647.70 million by 2032, growing at a CAGR of 5.4%. Improved healthcare spending, investments in specialist eye care facilities, and increasing glaucoma diagnosis rates are driving growth. Regional governments and private providers are working to address the burden of eye disease, fostering market expansion through better access and awareness initiatives.
Africa
Africa accounts for 4.3% of the glaucoma therapeutics market in 2024, with the market growing from USD 237.86 million in 2018 to USD 304.21 million in 2024, and expected to reach USD 423.80 million by 2032, at a CAGR of 4.2%. While access to advanced therapeutics remains limited, ongoing public health programs and non-governmental initiatives are raising awareness and improving diagnosis rates. The market outlook remains positive as healthcare infrastructure develops, gradually increasing patient access to essential glaucoma treatments across the continent.
Market Segmentations:
By Drug Class:
- Prostaglandins Analogs
- Beta Blockers
- Alpha-Adrenergic Agonists
- Carbonic Anhydrase Inhibitors
- Fixed-Dose Combinations
By Disease Indication:
- Open-Angle Glaucoma Therapeutics
- Closed-Angle Glaucoma Therapeutics
By Sales Channel:
- Hospital Pharmacy
- Retail Pharmacy
- Online Pharmacy
By Geography:
- North America
- U.S.
- Canada
- Mexico
- Europe
- Germany
- France
- U.K.
- Italy
- Spain
- Rest of Europe
- Asia Pacific
- China
- Japan
- India
- South Korea
- South-east Asia
- Rest of Asia Pacific
- Latin America
- Brazil
- Argentina
- Rest of Latin America
- Middle East & Africa
- GCC Countries
- South Africa
- Rest of the Middle East and Africa
Competitive Landscape
The competitive landscape of the Glaucoma Therapeutics market is characterized by the presence of several global and regional pharmaceutical companies actively investing in innovation, product portfolio expansion, and strategic partnerships. Leading players such as Allergan plc., Novartis AG, Pfizer Inc., Merck & Co., Inc., and Bausch & Lomb Incorporated maintain strong market positions through extensive R&D, robust drug pipelines, and established distribution networks. Mergers, acquisitions, and collaborations are common strategies to broaden therapeutic offerings and accelerate market penetration, especially in emerging economies. Competitive dynamics are further shaped by the introduction of novel formulations, increasing patent expirations, and a growing focus on personalized medicine. This intense competition continues to drive innovation, ultimately benefiting patients through greater access to effective glaucoma treatments.
Key Player Analysis
- Aerie Pharmaceuticals
- Akorn, Inc.
- Allergan plc.
- Bausch & Lomb Incorporated
- Inotek Pharmaceuticals
- Merck & Co., Inc.
- Novartis AG
- Pfizer Inc.
- Santen Pharmaceuticals Co. Ltd
- Teva Pharmaceuticals
Recent Developments
- In May 2024, Merck announced the acquisition of EyeBio for up to $3 billion, with an upfront payment of $1.3 billion. While EyeBio’s lead candidate EYE103 is currently focused on retinal diseases like diabetic macular edema and neovascular AMD, the acquisition significantly expands Merck’s ophthalmology pipeline and infrastructure, positioning it for future innovation in glaucoma therapeutics.
- In November 2024, Santen Pharmaceutical Korea expanded the availability Rhopressa, a Rho-kinase inhibiting drug in South Korea. Rhopressa is used in the treatment of enhancing intraocular pressure amongst patients suffering from open angle glaucoma and ocular hypertension. This new product launch is likely to increase market expansion by further improving the treatment alternatives and access to modern treatment in the region.
- In July 2023, Bausch Health Companies Inc. announced that Bausch Receivables Funding LP, an Ontario limited partnership and wholly-owned subsidiary of Bausch Health, has entered into a $600 million non-recourse financing facility with KKR and its credit funds and accounts. The facility will be collateralized by certain accounts receivables originated by a wholly-owned subsidiary of Bausch Health.
- In November 2022, Aerie Pharmaceuticals, Inc. was acquired by Alcon, the global leader in eye care. Through the transaction, Alcon has added the commercial products Rocklatan (netarsudil and latanoprost ophthalmic solution) 0.02%/0.005% and Rhopressa (netarsudil ophthalmic solution) 0.02%, AR-15512, a Phase 3 product candidate for dry eye disease and also a pipeline of ophthalmic pharmaceutical product candidates.
- In May 2022, Aerie Pharmaceuticals announced updates regarding its clinical trials, particularly focusing on Rocklatan (netarsudil and latanoprost ophthalmic solution), a once-daily eye drop for glaucoma. The company initiated a Phase 4 program to further evaluate Rocklatan's efficacy as a potent once-daily treatment. Additionally, Aerie partnered with Research to Prevent Blindness (RPB) to establish the RPB / David L. Epstein Career Advancement Award in Glaucoma Research.
Market Concentration & Characteristics
The Glaucoma Therapeutics market exhibits a moderate to high level of concentration, with a handful of multinational pharmaceutical companies accounting for a significant portion of global sales. It features established players such as Allergan plc., Novartis AG, Pfizer Inc., Merck & Co., Inc., Bausch & Lomb Incorporated, and Santen Pharmaceuticals, who leverage strong brand recognition, broad product portfolios, and extensive R&D resources. Companies maintain competitive advantages through continual drug innovation, robust pipelines, and effective life-cycle management strategies. The market reflects a mix of branded and generic therapies, with fixed-dose combinations and sustained-release formulations gaining traction. It is characterized by stringent regulatory requirements, patent expirations, and a persistent need for improved patient adherence. North America, Europe, and Asia Pacific collectively capture the majority of market value, influenced by high disease prevalence and healthcare investments. The market’s competitive intensity drives ongoing advancements, ensuring diverse treatment options for glaucoma patients globally.
Report Coverage
The research report offers an in-depth analysis based on Drug Class, Disease Indication, Sales Channel and Geography. It details leading market players, providing an overview of their business, product offerings, investments, revenue streams, and key applications. Additionally, the report includes insights into the competitive environment, SWOT analysis, current market trends, as well as the primary drivers and constraints. Furthermore, it discusses various factors that have driven market expansion in recent years. The report also explores market dynamics, regulatory scenarios, and technological advancements that are shaping the industry. It assesses the impact of external factors and global economic changes on market growth. Lastly, it provides strategic recommendations for new entrants and established companies to navigate the complexities of the market.
Future Outlook
- Innovative sustained-release therapies will gain traction by reducing dosing frequency and enhancing patient adherence.
- Biologic and gene-based treatments will emerge, offering longer-term disease control and addressing unmet needs.
- Fixed-dose combination products will expand, improving convenience and simplifying treatment regimens.
- Teleophthalmology and remote patient monitoring will integrate with treatment plans to support adherence and early intervention.
- Regulatory agencies will streamline approval pathways, accelerating access to novel therapies.
- Partnerships between pharma and tech firms will deliver digital health tools tailored for glaucoma management.
- Growth in emerging markets will outpace mature regions due to rising awareness and improving healthcare infrastructure.
- Patent expirations on key branded drugs will drive generic competition and expand affordable access.
- Real-world evidence studies will shape therapy adoption and guide clinical decision-making.
- Value-based pricing models will evolve, linking treatment reimbursement to clinical outcomes and cost-effectiveness.
Request a Free Sample
Fill in your details and we'll send you a free sample report.
- Sample data tables & charts
- Research methodology
Need a Custom Version of This Report?
Tailor the scope, geography, or segments to your exact requirements.
- Custom geography or segment scope
- Direct access to our analyst team
Frequently Asked Questions
What is the current size of the Glaucoma Therapeutics Market?
What factors are driving the growth of the Glaucoma Therapeutics Market?
What are some challenges faced by the Glaucoma Therapeutics Market?
Who are the major players in the Glaucoma Therapeutics Market?
Who are the major players in this market?
Table of Content
Chapter 1. Report Introduction
- 1.1 Report Description & Purpose
- 1.1.1 Report Title & Market Definition
- 1.1.2 Unique Selling Propositions (USP) & Key Differentiators
- 1.1.3 Value Proposition for Stakeholders
- 1.2 Research Objectives
- 1.2.1 Market Sizing Objectives (Volume & Revenue)
- 1.2.2 Segmentation Objectives
- 1.2.3 Competitive Intelligence Objectives
- 1.2.4 Forecast & Scenario Objectives
- 1.3 Report Scope
- 1.3.1 Glaucoma Therapeutics Scope – Types & Subtypes Covered
- 1.3.2 Geographic Scope – Regions & Countries Covered
- 1.3.3 Historical Period, Base Year & Forecast Period (2024; forecast to the forecast period)
- 1.3.4 Inclusions & Exclusions
- 1.4 HS Code & Classification Framework
- 1.5 Currency, Units & Pricing Basis
- 1.6 Target Stakeholders
- 1.7 Limitations & Assumptions
Chapter 2. Executive Summary
- 2.1 Global Glaucoma Therapeutics Market Snapshot
- 2.1.1 Market Size – Historical (2024) & Forecast (the forecast period) (2024: USD 7,134.0 million → forecast year: USD 11,423.2 million)
- 2.1.2 Volume & Revenue – Global Totals
- 2.1.3 Key Market Highlights – Top Five Facts
- 2.2 Glaucoma Therapeutics Market Segmentation Snapshot
- 2.2.1 Market Split by Region – 2024 vs.
- 2.3 Competitive Snapshot
- 2.3.1 Top 10 Players by Revenue Share – 2024
- 2.3.2 Top 10 Players by Volume Share – 2024
- 2.3.3 Recent Strategic Developments (18-Month Summary)
- 2.4 Key Investment Highlights & Strategic Conclusions
Chapter 3. Glaucoma Therapeutics Market Dynamics & Industry Analysis
- 3.1 Market Overview & Context
- 3.1.1 Glaucoma Therapeutics Market Position in the Broader Automotive Value Chain
- 3.1.2 OEM vs. Replacement Market Dynamics
- 3.1.3 Market Maturity & Development Stage by Region
- 3.2 Glaucoma Therapeutics Market Drivers
- 3.3 Glaucoma Therapeutics Market Restraints & Challenges
- 3.4 Glaucoma Therapeutics Market Opportunities
- 3.5 Porter's Five Forces Analysis
- 3.5.1 Threat of New Entrants
- 3.5.2 Bargaining Power of Suppliers
- 3.5.3 Bargaining Power of Buyers
- 3.5.4 Threat of Substitutes
- 3.5.5 Competitive Rivalry – Intensity Assessment
- 3.6 Glaucoma Therapeutics Value Chain Analysis
- 3.6.1 Upstream – Raw Material/Input Suppliers
- 3.6.1.1 Raw Material/Input 1
- 3.6.1.2 Raw Material/Input 2
- 3.6.1.3 Raw Material/Input 3
- 3.6.2 Midstream – Production/Manufacturing/Service Delivery
- 3.6.2.1 Production/Process Overview
- 3.6.2.2 Key Facility Locations & Capacity by Manufacturer
- 3.6.3 Downstream – Distribution & End Consumer
- 3.6.3.1 Primary Channel – B2B/OEM
- 3.6.3.2 Secondary Channels – Dealer, Retail, Online, Direct
- 3.6.4 Value Chain Profitability Analysis
- 3.6.1 Upstream – Raw Material/Input Suppliers
- 3.7 PESTEL Analysis
- 3.7.1 Political Factors
- 3.7.2 Economic Factors
- 3.7.3 Social Factors
- 3.7.4 Technological Factors
- 3.7.5 Environmental Factors
- 3.7.6 Legal Factors
- 3.8 Glaucoma Therapeutics Supply Chain Analysis
- 3.8.1 Raw Material/Input Supply Risk Assessment
- 3.8.2 Manufacturing Concentration Risk (Geographic Exposure)
- 3.8.3 Trade Disruption Impact Analysis
- 3.9 Regulatory & Policy Landscape
Note: The regulatory and policy landscape section covers regulations based on their applicability to the market, Glaucoma Therapeutics category, geography, and scope of the study. Only regulatory frameworks with a material impact on operations, compliance, trade, sustainability, or market access are analyzed in detail.
Chapter 4. Key Investment Pockets & Opportunity Analysis
- 4.1 Glaucoma Therapeutics Market Attractiveness Analysis
- 4.1.1 By Region – Investment Attractiveness Matrix (Volume × CAGR)
- 4.2 Absolute Revenue Growth Opportunity
- 4.2.1 By Region – Absolute USD Growth Through the forecast period
- 4.3 Incremental Volume Opportunity
- 4.3.1 By Region – Incremental Volume Through the forecast period
- 4.3.2 Segment – Incremental Volume
- 4.4 Emerging Submarket Opportunity Deep Dive (Subject to Applicability)
- 4.5 Emerging Market Opportunity Scorecards
- 4.5.1 United States
- 4.5.2 Europe
- 4.5.3 Asia
- 4.5.4 Middle East & Africa
Note: Emerging Market Opportunity Scorecards will be included based on relevance and strategic importance. Regions listed are indicative and may vary depending on data availability and market dynamics.
Chapter 5. Glaucoma Therapeutics Import-Export Analysis & Trade Flows
- 5.1 Global Trade Overview
- 5.1.1 Global Export Value by Country (2024)
- 5.1.2 Global Export Volume by Country (2024)
- 5.1.3 Global Import Value by Country (2024)
- 5.1.4 Global Import Volume by Country (2024)
- 5.1.5 Net Trade Balance by Country (2024)
- 5.2 Export Analysis – Segment
- 5.2.1 Type 1 (HS Code)
- 5.2.2 Type 2 (HS Code)
- 5.2.3 Type 3 (HS Code)
- 5.2.4 Type 4 (HS Code)
- 5.2.5 Type 5 (HS Code)
- 5.3 Import Analysis – Segment
- 5.3.1 Type 1 (HS Code)
- 5.3.2 Type 2 (HS Code)
- 5.3.3 Type 3 (HS Code)
- 5.3.4 Type 4 (HS Code)
- 5.3.5 Type 5 (HS Code)
- 5.4 Average Unit Trade Prices
- 5.4.1 Average Export Price – Segment & Country
- 5.4.2 Average Import Price – Segment & Source Country
- 5.4.3 Price Trends (2024)
- 5.5 Key Trade Route Analysis
- 5.5.1 Trade Route 1
- 5.5.2 Trade Route 2
- 5.5.3 Trade Route 3
- 5.5.4 Trade Route 4
- 5.5.5 Trade Route 5
- 5.6 Trade Policy Impact Assessment
- 5.6.1 US Anti-Dumping & Section 301 Tariffs
- 5.6.2 EU Customs Union Impact
- 5.6.3 Major Free Trade Agreements
- 5.6.4 USMCA Rules of Origin
Note: Trade policy analysis will be included only where relevant to the Glaucoma Therapeutics market.
Chapter 6. Competitive Landscape & Company Benchmarking
- 6.1 Glaucoma Therapeutics Market Concentration & Structure
- 6.1.1 Herfindahl-Hirschman Index (HHI) – vs. 2024
- 6.1.2 Tier 1, Tier 2 & Tier 3 Market Structure
- 6.1.3 Global, Regional & Local Player Dynamics
- 6.2 Glaucoma Therapeutics Market Share Analysis – 2024
- 6.2.1 Global Revenue Share by Company
- 6.2.2 Global Volume Share by Company
- 6.2.3 Regional Revenue Share
- 6.2.4 Market Share Evolution ( vs. 2024)
- 6.2.5 OEM Segment Share by Company
- 6.2.6 Replacement Segment Share by Company
- 6.3 Production/Delivery Capacity & Facility Analysis
- 6.3.1 Global Installed Capacity
- 6.3.2 Capacity Utilization Rates
- 6.3.3 Production/Output Volume
- 6.3.4 Facility Locations & Capacity Map
- 6.3.5 Planned Capacity Additions
- 6.4 Glaucoma Therapeutics Competitive Benchmarking Matrix
- 6.4.1 Revenue, Volume, CAGR & Profitability Comparison
- 6.4.2 Channel Revenue Mix
- 6.4.3 Geographic Revenue Exposure
- 6.4.4 R&D Intensity
- 6.4.5 Sustainability Maturity
- 6.5 Strategic Developments in Glaucoma Therapeutics (Last 24 Months)
- 6.5.1 Mergers, Acquisitions & Divestments
- 6.5.2 New Glaucoma Therapeutics Launches
- 6.5.3 Facility Expansions
- 6.5.4 Strategic Alliances, Joint Ventures & Partnerships
- 6.5.5 Distribution Expansion & Market Entry
- 6.5.6 Sustainability & ESG Initiatives
- 6.6 Competitive Strategy Mapping
- 6.6.1 Leader, Challenger, Follower & Niche Classification
- 6.6.2 Pricing Strategy Comparison
- 6.6.3 Channel Strategy Matrix
Note: Strategic developments are included based on their materiality and the availability of reliable information.
Chapter 7. Global Glaucoma Therapeutics Market – By Distribution Channel
- 7.1 Segment Overview
- 7.1.1 Volume & Revenue Split by Channel (2024 & )
- 7.1.2 Channel Mix Evolution (the forecast period)
Chapter 8. Regional Market Analysis – Global Overview
- 8.1 Global Regional Overview
- 8.1.1 Regional Volume Share
- 8.1.2 Regional Revenue Share
- 8.1.3 Regional Volume by Region
- 8.1.4 Regional Revenue by Region
- 8.1.5 Regional Forecast Through the forecast period
- 8.2 Cross-Regional Segment Analysis
- 8.2.1 By Distribution Channel
- 8.2.2 By Brand/Price Tier
Chapter 9. North America Glaucoma Therapeutics Market
- 9.1 United States
- 9.2 Canada
- 9.3 Mexico
Chapter 10. Europe Glaucoma Therapeutics Market
- 10.1 Germany
- 10.2 France
- 10.3 Italy
- 10.4 United Kingdom
- 10.5 Spain
- 10.6 Poland
- 10.7 Russia
- 10.8 Netherlands
- 10.9 Belgium
- 10.10 Sweden
- 10.11 Denmark
- 10.12 Norway
- 10.13 Rest of Europe
Chapter 11. Asia Pacific Glaucoma Therapeutics Market
- 11.1 China
- 11.2 India
- 11.3 Japan
- 11.4 South Korea
- 11.5 Thailand
- 11.6 Indonesia
- 11.7 Vietnam
- 11.8 Malaysia
- 11.9 Australia
- 11.10 Rest of Asia Pacific
Chapter 12. Latin America Glaucoma Therapeutics Market
- 12.1 Brazil
- 12.2 Argentina
- 12.3 Colombia
- 12.4 Chile
- 12.5 Rest of Latin America
Chapter 13. Middle East Glaucoma Therapeutics Market
- 13.1 Saudi Arabia
- 13.2 United Arab Emirates
- 13.3 Turkey
- 13.4 Israel
- 13.5 Iran
- 13.6 Rest of the Middle East
Chapter 14. Africa Glaucoma Therapeutics Market
- 14.1 South Africa
- 14.2 Egypt
- 14.3 Nigeria
- 14.4 Morocco
- 14.5 Rest of Africa
Chapter 15. Glaucoma Therapeutics Company Profiles
- 15.1 [Company 01]
- 15.1.1 Company Overview
- 15.1.2 Key Management Personnel
- 15.1.3 Products & Services Portfolio
- 15.1.4 Financial Performance
- 15.1.5 Key Market Focus & Geographic Presence
- 15.1.6 Recent Developments & Strategic Initiatives
Note: The company profile list is preliminary and may change based on research findings, market developments, data availability, and client requirements.
Chapter 16. Appendices
- Appendix A – List of Abbreviations & Acronyms
- Appendix B – Industry Classification Code Reference – Full Series
- Appendix C – Production & Capacity Data Tables
- Appendix D – End-Use & Demand Base Tables
- Appendix E – Consumption & Replacement Rate Assumptions
- Appendix F – ASP Reference Tables
- Appendix G – Manufacturing & Facility Database
- Appendix H – Import-Export Data Tables
- Appendix I – Regulatory Summary Tables
- Appendix J – Primary Research Participant List (Anonymized)
- Appendix K – Primary Research Questionnaire Framework
- Appendix L – Data Sources & Bibliography
- Appendix M – Market Size Divergence & Source Comparison
Chapter 17. Research Methodology
- 17.1 Research Framework & Philosophy
- 17.2 Secondary Research – Sources, Hierarchy & Data Extraction
- 17.3 Data Modeling – Bottom-Up & Top-Down Market Sizing
- 17.4 Primary Research – Stakeholder Framework, LOI & Sample Sizes
- 17.5 Forecast Methodology – Regression, Scenario & Sensitivity Analysis
- 17.6 Quality Control – Four-Layer Validation Framework
- 17.7 Limitations & Standard Assumptions
- 17.8 Disclaimer
