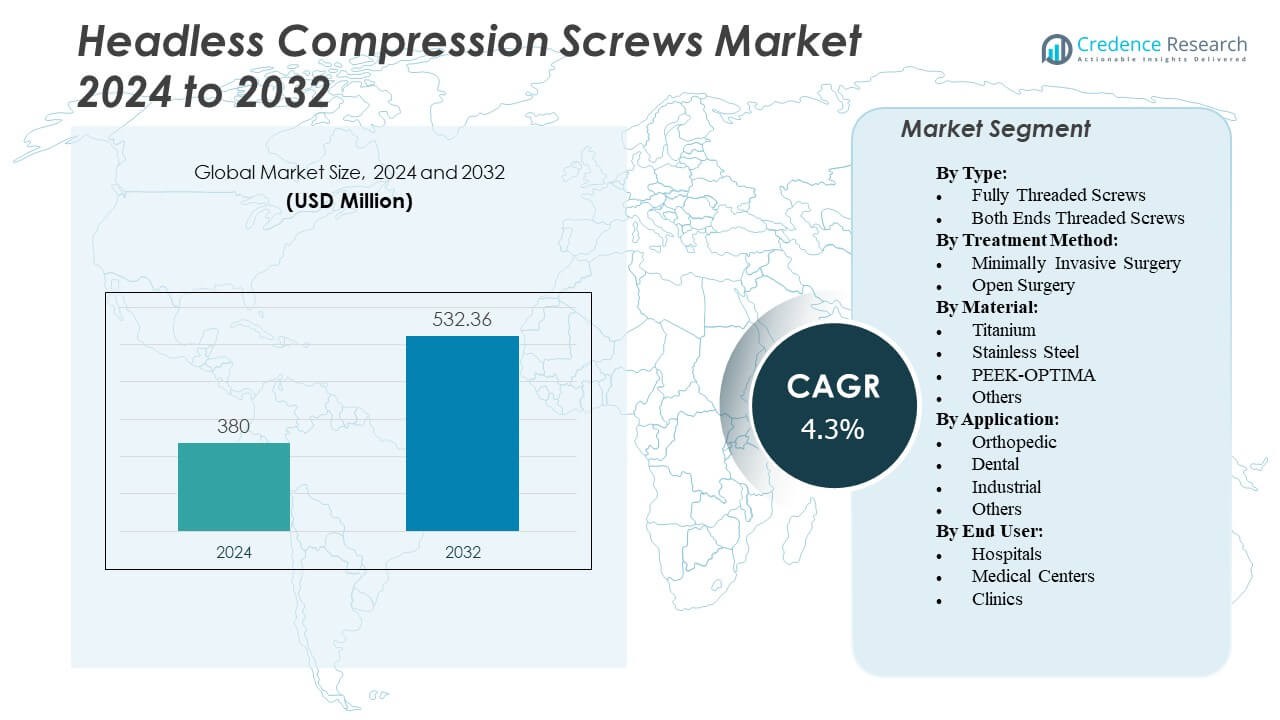
Home » Automation & Process Control » Headless Compression Screws Market

Headless Compression Screws Market By Product Types (Both Ends Threaded Screw, Fully Threaded Screw) By Application (Foot, Wrist, Hand) By Application (Orthopedic Procedures, Dental Procedures, Veterinary Medicine, Others), By Type (Fully Threaded Screws, Partially Threaded Screws, Variable Angle Screws, Solid Core Screws), By End-Users Hospitals and Clinics, Ambulatory Surgical Centers (ASCs), Orthopedic Clinics, Dental Clinics), By Price Range (Low, Medium, High) – Growth, Future Prospects & Competitive Analysis, 2016 – 2030

Price: $4999

Published: | Report ID: 7126 | Report Format : PDF

Market Insights

  • The Headless Compression Screws market has demonstrated steady growth over the years.
  • Revenues increased from USD 307.98 million in 2022 to USD 412.56 million in 2030.
  • This growth represents a Compound Annual Growth Rate (CAGR) of 4.26% from 2023 to 2030.
  • Headless Compression Screws are integral in various orthopedic and dental applications.
  • Fully Threaded Screws are a dominant product type, accounting for over 30% of the market.
  • Hand and Foot procedures constitute a significant portion of the market’s applications.
  • North America leads in market share, with over 30% attributed to this region.

Executive Summary

Headless Compression Screws are widely used in orthopedic and dental procedures because they provide stable and durable fixation. This report delves into the key drivers, restraints, and opportunities shaping this market’s landscape.

Market Definition

Headless Compression Screws are specialized medical devices for surgical fixation in orthopedic and dental applications. They are characterized by their threadless head, which minimizes the risk of tissue irritation and facilitates precise implant placement.

Market Overview

In 2022, the Headless Compression Screws market experienced significant growth, driven by several factors. Fully Threaded Screws held a dominant market share of over 30%, reflecting their versatility in various surgical applications. Hand and Foot procedures accounted for the largest application market share, highlighting the importance of these devices in reconstructive surgeries. Geographically, North America led the market, with a share of over 30%.

Design Element 2

Access crucial information at unmatched prices!

Request your free sample report today & start making informed decisions powered by Credence Research!

Download Free Sample
CTA Design Element 3

Market Segmentation 

Segmentation by Application

  • Headless Compression Screws find extensive use in orthopedic procedures such as fracture fixation, joint reconstruction, and spinal surgeries. These screws offer the advantage of minimal tissue disruption and reduced post-operative pain, making them suitable for orthopedic applications. Orthopedic procedures represent a significant portion of the market, driven by the aging population and the need for effective fracture management.
  • Headless Compression Screws are used in dentistry for applications like maxillofacial surgery, dental implantology, and orthodontic treatments. They provide secure and stable fixation in dental surgeries, ensuring proper alignment and healing. Dental procedures account for a substantial share of the market, particularly as dental implant surgeries become more common.
  • Headless Compression Screws are also utilized in veterinary medicine for procedures involving the fixation of fractures and joint stabilization in animals. The veterinary segment represents a niche market within the broader medical field, contributing to the demand for these screws.
  • Apart from orthopedic, dental, and veterinary applications, Headless Compression Screws may find use in specialized surgical procedures or research projects. The “Others” category encompasses diverse applications contributing to the market’s growth.

Segmentation by Type

  • Fully threaded Headless Compression Screws have threads that extend along their entire length. These screws offer enhanced stability and compression, making them suitable for applications requiring strong fixation. Fully threaded screws held a significant market share in 2022, primarily due to their versatility in various orthopedic and dental procedures.
  • Partially threaded Headless Compression Screws have threads that cover only a portion of their length. They are often used in cases where a combination of compression and stability is required. These screws find applications in specific orthopedic and dental procedures, offering surgeons flexibility in fixation techniques.
  • Variable-angle Headless Compression Screws feature a design that allows surgeons to choose the angle at which the screw enters the bone. They are particularly valuable when anatomical variations or complex fractures require precise screw placement. Variable angle screws cater to the demand for customized and patient-specific fixation solutions.
  • Solid core Headless Compression Screws are known for their robustness and durability. They provide a stable anchor point for fixation and are often used in load-bearing applications. Solid core screws are favored in cases where long-term structural integrity is critical.

Segmentation by End-Users

  • Hospitals and clinics represent a significant segment of end-users for Headless Compression Screws. Orthopedic and dental procedures, for which these screws are commonly used, are often performed in hospital settings. These institutions require a steady supply of headless compression screws to meet patients’ needs.
  • Ambulatory surgical centers are specialized healthcare facilities that focus on outpatient surgical procedures. Headless Compression Screws are valuable in ASCs, where minimally invasive surgeries are performed to reduce hospital stays. The versatility and effectiveness of these screws make them suitable for various procedures in ASCs.
  • Orthopedic clinics specialize in musculoskeletal care and often perform surgeries and treatments related to bone and joint disorders. Headless Compression Screws are a staple in orthopedic clinics, used for fracture fixation, joint reconstruction, and other orthopedic procedures. Orthopedic surgeons rely on these screws to provide stable and reliable fixation.
  • Dental clinics offer a range of oral and maxillofacial procedures, including implant surgeries and jaw reconstructions. Headless Compression Screws find applications in dental clinics, particularly oral and maxillofacial surgeries. They are used for fixation in facial bone fractures or dental implant placement cases.

Segmentation by Region

  • North America holds a significant share of the Headless Compression Screws market, accounting for over 30% of the revenue. The region’s strong market presence can be attributed to advanced healthcare infrastructure and a high prevalence of orthopedic and dental procedures. The aging population in North America contributes to the demand for these screws due to age-related orthopedic issues.
  • Europe is another key market for Headless Compression Screws, with a considerable share. The region benefits from technological advancements in surgical techniques and a growing demand for minimally invasive procedures. European countries prioritize patient care and are receptive to innovative medical devices, driving market growth.
  • The Asia Pacific region is witnessing rapid growth in the Headless Compression Screws market, with a CAGR above 5%. Emerging economies like China and India are experiencing a surge in orthopedic and dental procedures due to population growth and rising healthcare awareness. Expansion into these lucrative markets presents substantial opportunities for market players.
  • Latin America holds a smaller share of the market, around 2%. While the market presence is relatively modest, there is potential for growth as healthcare infrastructure and access to advanced medical devices improve in the region. Sports-related injuries and age-related orthopedic conditions contribute to the market’s growth.
  • The Middle East and Africa region demonstrate a CAGR of 6.5%, indicating significant growth potential. High-quality healthcare facilities and an increasing emphasis on medical tourism are driving the adoption of advanced medical devices, including Headless Compression Screws. The region’s orthopedic and dental procedures market is expanding steadily.

The Headless Compression Screws market is geographically segmented into several key regions, each contributing uniquely to its growth dynamics. North America is a dominant player, commanding a share of over 30% in the market. In 2022, North America held a substantial share, and it continues to be a frontrunner, projected to experience the fastest growth during the forecast period.

The region’s prominence is attributed to its advanced healthcare infrastructure, a high prevalence of orthopedic and dental procedures, and a rapidly aging population, all of which fuel the demand for these screws. Meanwhile, Europe maintains a steady growth trajectory with a CAGR of approximately 4%, driven by technological advancements in surgical techniques and a growing preference for minimally invasive procedures.

The Asia Pacific region, with a CAGR exceeding 5.25%, is witnessing significant expansion, primarily due to emerging economies like China and India, where orthopedic and dental procedures are on the rise alongside population growth and increased healthcare awareness. Latin America, although holding a more modest share at around 4.0%, demonstrates potential for growth as healthcare infrastructure and access to advanced medical devices improve.

Lastly, the Middle East and Africa region, with a CAGR of 2.5%, is gradually embracing advanced medical devices, including Headless Compression Screws, supported by high-quality healthcare facilities and an emerging focus on medical tourism. Together, these regions present a diverse landscape for the Headless Compression Screws market, each with unique growth opportunities and challenges.

Key Highlights of the Report

The growing demand for orthopedic and dental surgeries, driven by factors such as an aging population and sports-related injuries, has led to a substantial increase in the use of Headless Compression Screws. Technological advancements in surgical techniques have made procedures more minimally invasive and precise, increasing the demand for specialized fixation devices like Headless Compression Screws.

The aging population is more susceptible to musculoskeletal issues, increasing the need for orthopedic procedures that often require these screws. Sports-related injuries, particularly in professional and recreational athletes, drive the demand for orthopedic procedures, contributing to the market’s growth.

One significant restraint in the market is the high cost associated with Headless Compression Screws, limiting their accessibility to some patients and healthcare systems. Limited reimbursement options for these specialized devices can create financial challenges for patients and healthcare providers.

Headless Compression Screws face competition from alternative fixation methods, such as traditional screws and plates, which can affect their market share. Expanding the market into emerging regions offers growth opportunities as these areas witness an increase in healthcare infrastructure and surgical procedures.

Tailoring Headless Compression Screws to match the specific anatomical needs of patients can enhance their efficacy and reduce complications.

Continuous research and development efforts to improve screw design and materials can enhance surgical outcomes and market growth. Collaborations and partnerships between medical device companies can facilitate the development of innovative headless compression screw solutions and broaden market reach.

What Are the Main Drivers of the Headless Compression Screws Market?

The main drivers of the Headless Compression Screws Market include the increasing number of orthopedic and dental procedures, advancements in surgical techniques, aging population, and sports-related injuries.

What Are The Major Challenges Faced By the Headless Compression Screws Market?

The Headless Compression Screws Market’s major challenges include the high cost, limited reimbursement, and competition from alternative fixation methods.

What Are The Growth Opportunities In the Headless Compression Screws Market?

The growth opportunities in the Headless Compression Screws Market include the expansion into emerging markets, tailoring headless compression screws to patient-specific anatomical needs, ongoing research and development, and partnerships between medical device companies.

Market Drivers

Several factors drive the Headless Compression Screws market. The following are the key drivers of the Headless Compression Screws market:

Increasing Orthopedic and Dental Procedures:

The rising number of orthopedic and dental procedures is a significant driver for the Headless Compression Screws market. These screws are commonly used in fracture fixation, joint reconstruction, and spinal surgeries. As the global population ages and the prevalence of musculoskeletal disorders increases, the demand for orthopedic and dental procedures and headless compression screws is expected to grow steadily.

Advancements in Surgical Techniques:

Advances in surgical techniques have revolutionized the field of orthopedics and dentistry. Minimally invasive procedures have become more common, guided by technologies like fluoroscopy and computer-assisted surgery. Headless compression screws, known for their precision and minimal tissue disruption, align perfectly with these modern techniques. Surgeons can achieve greater accuracy and reduce patient recovery times, driving the adoption of headless compression screws.

Aging Population:

The global demographic shift toward an aging population is a key driver for the Headless Compression Screws market. As people age, the likelihood of orthopedic issues such as fractures, osteoporosis, and joint degeneration increases. Older individuals often require surgical interventions to maintain mobility and quality of life. Consequently, the demand for headless compression screws is expected to rise, as they are vital in addressing these age-related orthopedic conditions.

Sports-Related Injuries:

Sports and physical activities are an integral part of modern lifestyles. However, they also risk injuries, including fractures, dislocations, and ligament tears. Headless compression screws play a crucial role in the treatment of such injuries. Athletes and active individuals require effective surgical solutions that offer stability and a quicker return to their activities. As sports-related injuries continue to be prevalent, the market for headless compression screws is anticipated to grow in response to this demand.

Market Restraints 

The Headless Compression Screws market faces some challenges that may hinder its growth. These include the following:

High Cost:

One of the primary restraints in the Headless Compression Screws market is the relatively high cost associated with these specialized medical devices. The manufacturing processes involved in producing precision-engineered screws and using biocompatible materials can result in elevated production costs. The need for rigorous quality control and regulatory compliance also adds to the overall expenses. These higher costs can put pressure on healthcare budgets and limit access to headless compression screws for some patients and healthcare facilities.

Limited Reimbursement:

Reimbursement policies and coverage by healthcare payers can significantly impact the adoption of headless compression screws. In some regions, reimbursement may only partially cover the cost of these devices, leaving patients and healthcare providers to bear a substantial financial burden. This limitation can deter patients and healthcare institutions from opting for headless compression screws, especially when more cost-effective alternatives are available.

Competition from Alternative Fixation Methods: 

Headless compression screws face competition from alternative fixation methods and devices, such as traditional screws, plates, pins, and external fixation systems. While headless compression screws offer advantages like reduced tissue damage and improved patient outcomes, these alternatives remain in use, especially in cases where cost considerations are paramount.

The presence of established fixation methods and devices in the market can restrain the widespread adoption of headless compression screws. Healthcare providers and surgeons must weigh the benefits of headless screws against the cost and familiarity of these alternatives.

Market Opportunities

The Headless Compression Screws market faces some challenges that may hinder its growth. These include the following:

Expansion into Emerging Markets: 

The Headless Compression Screws market has significant growth potential in emerging markets. The demand for advanced orthopedic and dental procedures is rising as healthcare infrastructure improves in these regions. Expanding into emerging markets not only opens up new revenue streams but also helps address unmet medical needs.

To capitalize on this opportunity, medical device companies can establish a strong presence in these markets, collaborate with local healthcare providers, and adapt their marketing and distribution strategies to suit the specific requirements of each region.

Tailoring Headless Compression Screws to Patient-Specific Anatomical Needs:

Personalized medicine is gaining prominence in healthcare; the orthopedic sector is no exception. Tailoring headless compression screws to match a patient’s unique anatomical needs can enhance surgical outcomes. This customization involves precise measurements and designs that ensure an optimal fit, reducing the risk of complications and post-operative discomfort.

Medical device manufacturers can invest in advanced manufacturing technologies and software tools that enable the creation of patient-specific implants. This improves patient care and differentiates their products in the market.

Ongoing Research and Development:

Continuous research and development efforts are crucial to innovation in headless compression screws. Manufacturers should invest in R&D to improve these devices’ design, materials, and manufacturing processes. Innovations could include enhanced biocompatible materials, designs that minimize surgical trauma, and improvements in ease of use. Staying at the forefront of technology and design can give companies a competitive edge and contribute to market growth.

Partnerships between Medical Device Companies:

Collaborations and partnerships between medical device companies can drive innovation and market expansion. These partnerships can involve sharing expertise, research findings, and resources to develop new, improved headless compression screw systems.

Additionally, collaborations can extend to marketing and distribution agreements, allowing companies to access new customer bases and penetrate previously untapped markets. By working together, medical device companies can navigate challenges and seize opportunities more effectively in the competitive healthcare landscape.

Competitive Landscape

Key Players

Key players contribute to its growth and innovation in the Headless Compression Screws market. Some of the major players in the market and their market share are as follows:

  • Acumed
  • NuVasive
  • Synthes
  • Orthofix
  • Smith & Nephew
  • ConMed Corporation
  • Arthrex
  • Medtronic
  • Stryker
  • Zimmer Biomet
  • Medartis
  • Wright
  • Suzhou Kangli

These companies focus on technological innovation, product customization, and expanding their global presence to maintain their competitive edge in the market. The market’s competitive landscape is expected to intensify as demand for Headless Compression Screws rises.

Recent Development

On August 7th, 2023, Acumed unveiled the latest addition to its portfolio, the Acutrak 3 Headless Compression Screw system. Acumed, a subsidiary of Colson Medical under the Berkshire Hathaway umbrella, proudly introduced its cutting-edge Acutrak 3 Headless Screw system today.

Summary of Key Findings

  • The market is driven by increasing demand for orthopedic and dental procedures, advancements in surgical techniques, the aging population, and sports-related injuries.
  • Challenges include high costs associated with these screws, limited reimbursement options, and competition from alternative fixation methods.
  • Opportunities in the market include expanding into emerging markets, tailoring screws to meet patient-specific anatomical needs, ongoing research and development efforts, and forming strategic partnerships between medical device companies.
  • The market’s future outlook is optimistic, with sustained growth expected in the coming years.

Shape Your Report to Specific Countries or Regions & Enjoy 30% Off!

Future Outlook

  • The Headless Compression Screws market will continue its growth trajectory in the coming years.
  • Advancements in surgical techniques and the healthcare needs of an aging population will be significant drivers of market growth.
  • Overcoming cost-related challenges will be crucial for market expansion, as it will make these medical devices more accessible.
  • Additionally, expanding into emerging markets presents a promising opportunity for market players to tap into new customer bases and increase their market presence.

Market Segmentation

  • By Application
    • Orthopedic Procedures
    • Dental Procedures
    • Veterinary Medicine
    • Others
  • By Type
    • Fully Threaded Screws
    • Partially Threaded Screws
    • Variable Angle Screws
    • Solid Core Screws
  • By End-Users
    • Hospitals and Clinics
    • Ambulatory Surgical Centers (ASCs)
    • Orthopedic Clinics
    • Dental Clinics
  • By Price Range
    • Low
    • Medium
    • High
  • By Region
    • North America
      • Canada
      • Mexico
    • Europe
      • Germany
      • France
      • UK.
      • Italy
      • Spain
      • Rest of Europe
    • Asia Pacific
      • China
      • Japan
      • India
      • South Korea
      • South-east Asia
      • Rest of Asia Pacific
    • Latin America
      • Brazil
      • Argentina
      • Rest of Latin America
    • Middle East & Africa
      • GCC Countries
      • South Africa
      • Rest of Middle East and Africa

CHAPTER NO. 1 : INTRODUCTION 32

1.1. Report Description 32

1.1.1. Purpose of the Report 32

1.1.2. USP & Key Offerings 32

1.2. Key Benefits for Stakeholders 32

1.3. Target Audience 33

1.4. Report Scope 34


CHAPTER NO. 2 : EXECUTIVE SUMMARY 36

2.1. Headless Compression Screws Market Snapshot 36

2.2. Global Headless Compression Screws Market, 2017 – 2022 (Kilo Tons) (USD Million) 37

2.1. Insights from Primary Respondents 38


CHAPTER NO. 3 : IMPACT ANALYSIS OF COVID 19 & RUSSIA-UKRAINE WAR ON HEADLESS COMPRESSION SCREWS MARKET 39

3.1. Impact Assessment of COVID-19 Pandemic, By Region 39

3.1.1. Supply chain disruptions 39

3.1.2. Demand fluctuations 39

3.1.3. Shift in product mix 39

3.1.4. Reduced industrial activity 39

3.1.5. Temporary disruptions and delays 39

3.1.6. Shift in focus towards essential services 39

3.2. Russia-Ukraine War Impacts 40

3.2.1. Uncertainty and economic instability 40

3.2.2. Supply chain disruptions 40

3.2.3. Regional market shifts 40

3.2.4. Shift in government priorities 40


CHAPTER NO. 4 : HEADLESS COMPRESSION SCREWS MARKET – INDUSTRY ANALYSIS 41

4.1. Introduction 41

4.2. Market Drivers 42

4.2.1. Driving Factor 1 Analysis 42

4.2.2. Driving Factor 2 Analysis 43

4.3. Market Restraints 44

4.3.1. Restraining Factor Analysis 44

4.4. Market Opportunities 45

4.4.1. Market Opportunity Analysis 45

4.5. Porter’s Five Forces Analysis 46

4.6. Value Chain Analysis 47

4.7. Buying Criteria 48


CHAPTER NO. 5 : IMPORT EXPORT ANALYSIS 49

5.1. Import Analysis by Region 49

5.1.1. Global Headless Compression Screws Market Import Volume/Revenue, By Region, 2017 – 2022 49

5.2. Export Analysis by Region 50

5.2.1. Global Headless Compression Screws Market Export Volume/Revenue, By Region, 2017 – 2022 50


CHAPTER NO. 6 : DEMAND SUPPLY ANALYSIS 51

6.1. Demand Analysis by Region 51

6.1.1. Global Headless Compression Screws Market Demand Volume/Revenue, By Region, 2017 – 2022 51

6.2. Supply Analysis by Region 52

6.2.1. Global Headless Compression Screws Market Supply Volume/Revenue, By Region, 2017 – 2022 52


CHAPTER NO. 7 : PRODUCTION ANALYSIS 53

7.1. Production Analysis by Region 53

7.1.1. Global Headless Compression Screws Market Production, By Region, 2017 – 2022 53

7.1.2. Global Headless Compression Screws Market Production Volume, By Region, 2017 – 2022 (Kilo Tons) 53


CHAPTER NO. 8 : PRICE ANALYSIS 54

8.1. Price Analysis by Region 54

8.1.1. Global Headless Compression Screws Market Price, By Region, 2017 – 2022 54

8.1.2. Global Type Market Price, By Region, 2017 – 2022 54

8.2. Price Analysis by Type 55

8.2.1. Global Headless Compression Screws Market Price, By Type, 2017 – 2022 55

8.2.2. Global Type Market Price, By Type, 2017 – 2022 55


CHAPTER NO. 9 : RAW MATERIALS ANALYSIS 56

9.1. Key Raw Materials and Suppliers 56

9.2. Key Raw Materials Price Trend 56


CHAPTER NO. 10 : MANUFACTURING COST ANALYSIS 57

10.1. Manufacturing Cost Analysis 57

10.1.1. Manufacturing Cost Analysis 57

10.2. Manufacturing Process 57

10.2.1. Manufacturing Process 57


CHAPTER NO. 11 : ANALYSIS COMPETITIVE LANDSCAPE 58

11.1. Company Market Share Analysis – 2022 58

11.1.1. Global Headless Compression Screws Market: Company Market Share, by Volume, 2022 58

11.1.2. Global Headless Compression Screws Market: Company Market Share, by Revenue2022 58

11.1.3. Global Headless Compression Screws Market: Top 6 Company Market Share, by Revenue2022 59

11.1.4. Global Headless Compression Screws Market: Top 3 Company Market Share, by Revenue2022 59

11.1. Global Headless Compression Screws Market Company Volume Market Share, 2022 61

11.2. Global Headless Compression Screws Market Company Revenue Market Share, 2022 62

11.3. Company Assessment Metrics, 2022 63

11.3.1. Stars 63

11.3.2. Emerging Leaders 63

11.3.3. Pervasive Players 63

11.3.4. Participants 63

11.4. Start-ups /SMEs Assessment Metrics, 2022 63

11.4.1. Progressive Companies 63

11.4.2. Responsive Companies 63

11.4.3. Dynamic Companies 63

11.4.4. Starting Blocks 63

11.5. Strategic Developments 64

11.5.1. Acquisitions & Mergers 64

11.5.2. New Product Launch 64

11.5.3. Regional Expansion 64

11.6. Key Players Product Matrix 65


CHAPTER NO. 12 : PESTEL & ADJACENT MARKET ANALYSIS 66

12.1. PESTEL 66

12.1.1. Political Factors 66

12.1.2. Economic Factors 66

12.1.3. Social Factors 66

12.1.4. Technological Factors 66

12.1.5. Environmental Factors 66

12.1.6. Legal Factors 66

12.2. Adjacent Market Analysis 66


CHAPTER NO. 13 : HEADLESS COMPRESSION SCREWS MARKET – BY TYPE SEGMENT ANALYSIS 67

13.1. Headless Compression Screws Market Overview, by Type Segment 67

13.1.1. Headless Compression Screws Market Volume Share, By Type, 2022 & 2030 68

13.1.2. Headless Compression Screws Market Revenue Share, By Type, 2022 & 2030 68

13.1.3. Headless Compression Screws Market Attractiveness Analysis, By Type 69

13.1.4. Incremental Revenue Growth Opportunity, by Type, 2023 – 2030 69

13.1.5. Headless Compression Screws Market Revenue, By Type, 2017, 2022, 2026 & 2030 70

13.2. Fully Threaded Screw 71

13.2.1. Global Fully Threaded Screw Headless Compression Screws Market Volume & Revenue, By Region, 2017 – 2022 (Kilo Tons) (USD Million) 72

13.2.2. Global Fully Threaded Screw Headless Compression Screws Market Volume & Revenue, By Region, 2017 – 2022 (Kilo Tons) (USD Million) 72

13.3. Both Ends Threaded Screw 73

13.3.1. Global Both Ends Threaded Screw Headless Compression Screws Market Volume & Revenue, By Region, 2017 – 2022 (Kilo Tons) (USD Million) 74

13.3.2. Global Both Ends Threaded Screw Headless Compression Screws Market Volume & Revenue, By Region, 2017 – 2022 (Kilo Tons) (USD Million) 74

13.4. Partially Threaded Screw 75

13.4.1. Global Partially Threaded Screw Headless Compression Screws Market Volume & Revenue, By Region, 2017 – 2022 (Kilo Tons) (USD Million) 76

13.4.2. Global Partially Threaded Screw Headless Compression Screws Market Volume & Revenue, By Region, 2017 – 2022 (Kilo Tons) (USD Million) 76


CHAPTER NO. 14 : HEADLESS COMPRESSION SCREWS MARKET – BY APPLICATION SEGMENT ANALYSIS 77

14.1. Headless Compression Screws Market Overview, by Application Segment 77

14.1.1. Headless Compression Screws Market Volume Share, By Application, 2022 & 2030 78

14.1.2. Headless Compression Screws Market Revenue Share, By Application, 2022 & 2030 78

14.1.3. Headless Compression Screws Market Attractiveness Analysis, By Application 79

14.1.4. Incremental Revenue Growth Opportunity, by Application, 2023 – 2030 79

14.1.5. Headless Compression Screws Market Revenue, By Application, 2017, 2022, 2026 & 2030 80

14.2. Hand 81

14.2.1. Global Hand Headless Compression Screws Market Volume & Revenue, By Region, 2017 – 2022 (Kilo Tons) (USD Million) 82

14.2.2. Global Hand Headless Compression Screws Market Volume & Revenue, By Region, 2017 – 2022 (Kilo Tons) (USD Million) 82

14.3. Wrist 83

14.3.1. Global Wrist Headless Compression Screws Market Volume & Revenue, By Region, 2017 – 2022 (Kilo Tons) (USD Million) 84

14.3.2. Global Wrist Headless Compression Screws Market Volume & Revenue, By Region, 2017 – 2022 (Kilo Tons) (USD Million) 84

14.4. Foot 85

14.4.1. Global Foot Headless Compression Screws Market Volume & Revenue, By Region, 2017 – 2022 (Kilo Tons) (USD Million) 86

14.4.2. Global Foot Headless Compression Screws Market Volume & Revenue, By Region, 2017 – 2022 (Kilo Tons) (USD Million) 86

14.5. Ankle 87

14.5.1. Global Ankle Headless Compression Screws Market Volume & Revenue, By Region, 2017 – 2022 (Kilo Tons) (USD Million) 88

14.5.2. Global Ankle Headless Compression Screws Market Volume & Revenue, By Region, 2017 – 2022 (Kilo Tons) (USD Million) 88

14.6. Dental 89

14.6.1. Global Dental Headless Compression Screws Market Volume & Revenue, By Region, 2017 – 2022 (Kilo Tons) (USD Million) 90

14.6.2. Global Dental Headless Compression Screws Market Volume & Revenue, By Region, 2017 – 2022 (Kilo Tons) (USD Million) 90


CHAPTER NO. 15 : HEADLESS COMPRESSION SCREWS MARKET – BY MATERIALS SEGMENT ANALYSIS 91

15.1. Headless Compression Screws Market Overview, by Materials Segment 91

15.1.1. Headless Compression Screws Market Volume Share, By Materials, 2022 & 2030 92

15.1.2. Headless Compression Screws Market Revenue Share, By Materials, 2022 & 2030 92

15.1.3. Headless Compression Screws Market Attractiveness Analysis, By Materials 93

15.1.4. Incremental Revenue Growth Opportunity, by Materials, 2023 – 2030 93

15.1.5. Headless Compression Screws Market Revenue, By Materials, 2017, 2022, 2026 & 2030 94

15.2. Stainless Steel 95

15.2.1. Global Stainless Steel Headless Compression Screws Market Volume & Revenue, By Region, 2017 – 2022 (Kilo Tons) (USD Million) 96

15.2.2. Global Stainless Steel Headless Compression Screws Market Volume & Revenue, By Region, 2023 – 2030 (Kilo Tons) (USD Million) 96

15.3. Titanium 97

15.3.1. Global Titanium Headless Compression Screws Market Volume & Revenue, By Region, 2017 – 2022 (Kilo Tons) (USD Million) 98

15.3.2. Global Titanium Headless Compression Screws Market Volume & Revenue, By Region, 2023 – 2030 (Kilo Tons) (USD Million) 98


CHAPTER NO. 16 : HEADLESS COMPRESSION SCREWS MARKET – BY DISTRIBUTION CHANNEL SEGMENT ANALYSIS 99

16.1. Headless Compression Screws Market Overview, by Distribution Channel Segment 99

16.1.1. Headless Compression Screws Market Revenue Share, By Distribution Channel, 2022 & 2030 100

16.1.2. Headless Compression Screws Market Revenue Share, By Distribution Channel, 2022 & 2030 100

16.1.3. Headless Compression Screws Market Attractiveness Analysis, By Distribution Channel 101

16.1.4. Incremental Revenue Growth Opportunity, by Distribution Channel, 2023 – 2030 101

16.1.5. Headless Compression Screws Market Revenue, By Distribution Channel, 2017, 2022, 2026 & 2030 102

16.2. Direct 103

16.2.1. Global Direct Headless Compression Screws Market Volume & Revenue, By Region, 2017 – 2022 (Kilo Tons) (USD Million) 104

16.2.2. Global Direct Headless Compression Screws Market Volume & Revenue, By Region, 2023 – 2030 (Kilo Tons) (USD Million) 104

16.3. Distributors 105

16.3.1. Global Distributors Headless Compression Screws Market Volume & Revenue, By Region, 2017 – 2022 (Kilo Tons) (USD Million) 106

16.3.2. Global Distributors Headless Compression Screws Market Volume & Revenue, By Region, 2023 – 2030 (Kilo Tons) (USD Million) 106


CHAPTER NO. 17 : HEADLESS COMPRESSION SCREWS MARKET – REGIONAL ANALYSIS 107

17.1. Headless Compression Screws Market Overview, by Regional Segments 107

17.2. Region 108

17.2.1. Global Headless Compression Screws Market Volume Share, By Region, 2022 & 2030 108

17.2.2. Global Headless Compression Screws Market Revenue Share, By Region, 2022 & 2030 108

17.2.3. Headless Compression Screws Market Attractiveness Analysis, By Region 109

17.2.4. Incremental Revenue Growth Opportunity, by Region, 2023 – 2030 109

17.2.5. Headless Compression Screws Market Revenue, By Region, 2017, 2022, 2026 & 2030 110

17.2.6. Global Headless Compression Screws Market Volume & Revenue, By Region, 2017 – 2022 (Kilo Tons) (USD Million) 111

17.2.7. Global Headless Compression Screws Market Volume & Revenue, By Region, 2023 – 2030 (Kilo Tons) (USD Million) 111

17.3. Type 112

17.3.1. Global Headless Compression Screws Market Volume & Revenue, By Type, 2017 – 2022 (Kilo Tons) (USD Million) 112

17.3.2. Global Headless Compression Screws Market Volume & Revenue, By Type, 2023 – 2030 (Kilo Tons) (USD Million) 112

17.4. Application 113

17.4.1. Global Headless Compression Screws Market Volume & Revenue, By Application, 2017 – 2022 (Kilo Tons) (USD Million) 113

17.4.2. Global Headless Compression Screws Market Volume & Revenue, By Application, 2023 – 2030 (Kilo Tons) (USD Million) 113

17.5. Materials 114

17.5.1. Global Headless Compression Screws Market Volume & Revenue, By Materials, 2017 – 2022 (Kilo Tons) (USD Million) 114

17.5.2. Global Headless Compression Screws Market Volume & Revenue, By Materials, 2023 – 2030 (Kilo Tons) (USD Million) 114

17.6. Distribution Channel 115

17.6.1. Global Headless Compression Screws Market Volume & Revenue, By Distribution Channel, 2017 – 2022 (Kilo Tons) (USD Million) 115

17.6.2. Global Headless Compression Screws Market Volume & Revenue, By Distribution Channel, 2023 – 2030 (Kilo Tons) (USD Million) 115


CHAPTER NO. 18 : HEADLESS COMPRESSION SCREWS MARKET – NORTH AMERICA 116

18.1. North America 116

18.1. Key Highlights 116

18.1.1. North America Headless Compression Screws Market Volume, By Country, 2017 – 2022 (Kilo Tons) 117

18.1.2. North America Headless Compression Screws Market Revenue, By Country, 2017 – 2022 (USD Million) 118

18.1.2.1. North America Headless Compression Screws Market Volume, By Type, 2017 – 2022 (Kilo Tons) 119

18.1.3. North America Headless Compression Screws Market Revenue, By Type, 2017 – 2022 (USD Million) 120

18.1.4. North America Headless Compression Screws Market Volume, By Application, 2017 – 2022 (Kilo Tons) 121

18.1.5. North America Headless Compression Screws Market Revenue, By Application, 2017 – 2022 (USD Million) 122

18.1.6. North America Headless Compression Screws Market Volume, By Materials, 2017 – 2022 (Kilo Tons) 123

18.1.7. North America Headless Compression Screws Market Revenue, By Materials, 2017 – 2022 (USD Million) 124

18.1.8. North America Headless Compression Screws Market Volume, By Distribution Channel, 2017 – 2022 (Kilo Tons) 125

18.1.9. North America Headless Compression Screws Market Revenue, By Distribution Channel, 2017 – 2022 (USD Million) 126

18.1.10. U.S. 127

18.1.11. Canada 127

18.1.12. Mexico 127


CHAPTER NO. 19 : HEADLESS COMPRESSION SCREWS MARKET – EUROPE 128

19.1. Europe 128

19.2. Key Highlights 128

19.2.1. Europe Headless Compression Screws Market Volume, By Country, 2017 – 2022 (Kilo Tons) 129

19.2.2. Europe Headless Compression Screws Market Revenue, By Country, 2017 – 2022 (USD Million) 130

19.2.3. Europe Headless Compression Screws Market Volume, By Type, 2017 – 2022 (Kilo Tons) 132

19.2.4. Europe Headless Compression Screws Market Revenue, By Type, 2017 – 2022 (USD Million) 133

19.2.5. Europe Headless Compression Screws Market Volume, By Application, 2017 – 2022 (Kilo Tons) 134

19.2.6. Europe Headless Compression Screws Market Revenue, By Application, 2017 – 2022 (USD Million) 135

19.2.7. Europe Headless Compression Screws Market Volume, By Materials, 2017 – 2022 (Kilo Tons) 136

19.2.8. Europe Headless Compression Screws Market Revenue, By Materials, 2017 – 2022 (USD Million) 137

19.2.9. Europe Headless Compression Screws Market Volume, By Distribution Channel, 2017 – 2022 (Kilo Tons) 138

19.2.10. Europe Headless Compression Screws Market Revenue, By Distribution Channel, 2017 – 2022 (USD Million) 139

19.2.11. UK 140

19.2.12. France 140

19.2.13. Germany 140

19.2.14. Italy 140

19.2.15. Spain 140

19.2.16. Russia 140

19.2.17. BENELUX 140

19.2.18. Sweden 140

19.2.19. Denmark 140

19.2.20. Poland 140

19.2.21. Austria 140

19.2.22. Rest of Europe 140


CHAPTER NO. 20 : HEADLESS COMPRESSION SCREWS MARKET – ASIA PACIFIC 141

20.1. Asia Pacific 141

20.2. Key Highlights 141

20.2.1. Asia Pacific Headless Compression Screws Market Volume, By Country, 2017 – 2022 (Kilo Tons) 142

20.2.2. Asia Pacific Headless Compression Screws Market Revenue, By Country, 2017 – 2022 (USD Million) 143

20.2.3. Asia Pacific Headless Compression Screws Market Volume, By Type, 2017 – 2022 (Kilo Tons) 145

20.2.4. Asia Pacific Headless Compression Screws Market Revenue, By Type, 2017 – 2022 (USD Million) 146

20.2.5. Asia Pacific Headless Compression Screws Market Volume, By Application, 2017 – 2022 (Kilo Tons) 147

20.2.6. Asia Pacific Headless Compression Screws Market Revenue, By Application, 2017 – 2022 (USD Million) 148

20.2.7. Asia Pacific Headless Compression Screws Market Volume, By Materials, 2017 – 2022 (Kilo Tons) 149

20.2.8. Asia Pacific Headless Compression Screws Market Revenue, By Materials, 2017 – 2022 (USD Million) 150

20.2.9. Asia Pacific Headless Compression Screws Market Volume, By Distribution Channel, 2017 – 2022 (Kilo Tons) 151

20.2.10. Asia Pacific Headless Compression Screws Market Revenue, By Distribution Channel, 2017 – 2022 (USD Million) 152

20.2.11. China 153

20.2.12. Japan 153

20.2.13. South Korea 153

20.2.14. India 153

20.2.15. Thailand 153

20.2.16. Indonesia 153

20.2.17. Vietnam 153

20.2.18. Malaysia 153

20.2.19. Philippines 153

20.2.20. Taiwan 153

20.2.21. Rest of Asia Pacific 153


CHAPTER NO. 21 : HEADLESS COMPRESSION SCREWS MARKET – LATIN AMERICA 154

21.1. Latin America 154

21.2. Key Highlights 154

21.2.1. Latin America Headless Compression Screws Market Volume, By Country, 2017 – 2022 (Kilo Tons) 155

21.2.2. Latin America Headless Compression Screws Market Revenue, By Country, 2017 – 2022 (USD Million) 156

21.2.3. Latin America Headless Compression Screws Market Volume, By Type, 2017 – 2022 (Kilo Tons) 157

21.2.4. Latin America Headless Compression Screws Market Revenue, By Type, 2017 – 2022 (USD Million) 158

21.2.5. Latin America Headless Compression Screws Market Volume, By Application, 2017 – 2022 (Kilo Tons) 159

21.2.6. Latin America Headless Compression Screws Market Revenue, By Application, 2017 – 2022 (USD Million) 160

21.2.7. Latin America Headless Compression Screws Market Volume, By Materials, 2017 – 2022 (Kilo Tons) 161

21.2.8. Latin America Headless Compression Screws Market Revenue, By Materials, 2017 – 2022 (USD Million) 162

21.2.9. Latin America Headless Compression Screws Market Volume, By Distribution Channel, 2017 – 2022 (Kilo Tons) 163

21.2.10. Latin America Headless Compression Screws Market Revenue, By Distribution Channel, 2017 – 2022 (USD Million) 164

21.2.11. Brazil 165

21.2.12. Argentina 165

21.2.13. Colombia 165

21.2.14. Chile 165

21.2.15. Peru 165

21.2.16. Rest of Latin America 165


CHAPTER NO. 22 : HEADLESS COMPRESSION SCREWS MARKET – MIDDLE EAST 166

22.1. The Middle-East 166

22.2. Key Highlights 166

22.2.1. Middle East Headless Compression Screws Market Volume, By Country, 2017 – 2022 (Kilo Tons) 167

22.2.2. Middle East Headless Compression Screws Market Revenue, By Country, 2017 – 2022 (USD Million) 168

22.2.3. Middle East Headless Compression Screws Market Volume, By Type, 2017 – 2022 (Kilo Tons) 169

22.2.4. Middle East Headless Compression Screws Market Revenue, By Type, 2017 – 2022 (USD Million) 170

22.2.5. Middle East Headless Compression Screws Market Volume, By Application, 2017 – 2022 (Kilo Tons) 171

22.2.6. Middle East Headless Compression Screws Market Revenue, By Application, 2017 – 2022 (USD Million) 172

22.2.7. Middle East Headless Compression Screws Market Volume, By Materials, 2017 – 2022 (Kilo Tons) 173

22.2.8. Middle East Headless Compression Screws Market Revenue, By Materials, 2017 – 2022 (USD Million) 174

22.2.9. Middle East Headless Compression Screws Market Volume, By Distribution Channel, 2017 – 2022 (Kilo Tons) 175

22.2.10. Middle East Headless Compression Screws Market Revenue, By Distribution Channel, 2017 – 2022 (USD Million) 176

22.2.11. GCC Countries 177

22.2.12. Israel 177

22.2.13. Turkey 177

22.2.14. Iran 177

22.2.15. Rest of Middle East & Africa 177


CHAPTER NO. 23 : HEADLESS COMPRESSION SCREWS MARKET – AFRICA 178

23.1. Africa 178

23.2. Key Highlights 178

23.2.1. Africa Headless Compression Screws Market Volume, By Country, 2017 – 2022 (Kilo Tons) 179

23.2.2. Africa Headless Compression Screws Market Revenue, By Country, 2017 – 2022 (USD Million) 180

23.2.3. Africa Headless Compression Screws Market Volume, By Type, 2017 – 2022 (Kilo Tons) 181

23.2.4. Africa Headless Compression Screws Market Revenue, By Type, 2017 – 2022 (USD Million) 182

23.2.5. Africa Headless Compression Screws Market Volume, By Application, 2017 – 2022 (Kilo Tons) 183

23.2.6. Africa Headless Compression Screws Market Revenue, By Application, 2017 – 2022 (USD Million) 184

23.2.7. Africa Headless Compression Screws Market Volume, By Materials, 2017 – 2022 (Kilo Tons) 185

23.2.8. Africa Headless Compression Screws Market Revenue, By Materials, 2017 – 2022 (USD Million) 186

23.2.9. Africa Headless Compression Screws Market Volume, By Distribution Channel, 2017 – 2022 (Kilo Tons) 187

23.2.10. Africa Headless Compression Screws Market Revenue, By Distribution Channel, 2017 – 2022 (USD Million) 188

23.2.11. South Africa 189

23.2.12. Egypt 189

23.2.13. Nigeria 189

23.2.14. Algeria 189

23.2.15. Morocco 189

23.2.16. Rest of Africa 189


CHAPTER NO. 24 : COMPANY PROFILES 190

24.1. Synthes 190

24.1.1. Company Overview 190

24.1.2. Product Portfolio 190

24.1.3. Swot Analysis 190

24.1.4. Business Strategy 191

24.1.5. Financial Overview 191

24.2. Acumed 192

24.3. Smith & Nephew 192

24.4. Arthrex 192

24.5. Stryker 192

24.6. Medartis 192

24.7. Suzhou kangli 192

24.8. Wright 192

24.9. Zimmer Biomet 192

24.10. Medtronic 192

24.11. ConMed Corporation 192

24.12. Orthofix 192

24.13. NuVasive 192

24.14. Integra LifeSciences 192


CHAPTER NO. 25 : STRAUMANN GROUP 192


CHAPTER NO. 26 : RESEARCH METHODOLOGY 193

26.1. Research Methodology 193

26.2. Phase I – Secondary Research 194

26.3. Phase II – Data Modeling 194

26.3.1. Company Share Analysis Model 195

26.3.2. Revenue Based Modeling 195

26.4. Phase III – Primary Research 196

26.5. Research Limitations 197

26.5.1. Assumptions 197

List of Figures

FIG NO. 1. Global Headless Compression Screws Market Volume & Revenue, 2017 – 2022 (Kilo Tons) (USD Million) 37

FIG NO. 2. Porter’s Five Forces Analysis for Global Headless Compression Screws Market 46

FIG NO. 3. Value Chain Analysis for Global Headless Compression Screws Market 47

FIG NO. 4. Global Headless Compression Screws Market Import Volume/Revenue, By Region, 2017 – 2022 49

FIG NO. 5. Global Headless Compression Screws Market Export Volume/Revenue, By Region, 2017 – 2022 50

FIG NO. 6. Global Headless Compression Screws Market Demand Volume/Revenue, By Region, 2017 – 2022 51

FIG NO. 7. Global Headless Compression Screws Market Supply Volume/Revenue, By Region, 2017 – 2022 52

FIG NO. 8. Global Headless Compression Screws Market Production, By Region, 2017 – 2022 53

FIG NO. 9. Global Headless Compression Screws Market Price, By Region, 2017 – 2022 54

FIG NO. 10. Global Headless Compression Screws Market Price, By Type, 2017 – 2022 55

FIG NO. 11. Raw Materials Price Trend Analysis, 2017 – 2022 56

FIG NO. 12. Manufacturing Cost Analysis 57

FIG NO. 13. Manufacturing Process 57

FIG NO. 14. Company Share Analysis, 2022 58

FIG NO. 15. Company Share Analysis, 2022 58

FIG NO. 16. Company Share Analysis, 2022 59

FIG NO. 17. Company Share Analysis, 2022 59

FIG NO. 18. Headless Compression Screws Market – Company Volume  Market Share, 2022 61

FIG NO. 19. Headless Compression Screws Market – Company Revenue Market Share, 2022 62

FIG NO. 20. Headless Compression Screws Market Volume Share, By Type, 2022 & 2030 68

FIG NO. 21. Headless Compression Screws Market Revenue Share, By Type, 2022 & 2030 68

FIG NO. 22. Market Attractiveness Analysis, By Type 69

FIG NO. 23. Incremental Revenue Growth Opportunity by Type 69

FIG NO. 24. Headless Compression Screws Market Revenue, By Type, 2017, 2022, 2026 & 2030 70

FIG NO. 25. Global Headless Compression Screws Market for Fully Threaded Screw, Volume & Revenue (Kilo Tons) (USD Million) 2017 – 2030 71

FIG NO. 26. Global Headless Compression Screws Market for Both Ends Threaded Screw, Volume & Revenue (Kilo Tons) (USD Million) 2017 – 2030 73

FIG NO. 27. Global Headless Compression Screws Market for Partially Threaded Screw, Volume & Revenue (Kilo Tons) (USD Million) 2017 – 2030 75

FIG NO. 28. Headless Compression Screws Market Volume Share, By Application, 2022 & 2030 78

FIG NO. 29. Headless Compression Screws Market Revenue Share, By Application, 2022 & 2030 78

FIG NO. 30. Market Attractiveness Analysis, By Application 79

FIG NO. 31. Incremental Revenue Growth Opportunity by Application 79

FIG NO. 32. Headless Compression Screws Market Revenue, By Application, 2017, 2022, 2026 & 2030 80

FIG NO. 33. Global Headless Compression Screws Market for Hand, Volume & Revenue (Kilo Tons) (USD Million) 2017 – 2030 81

FIG NO. 34. Global Headless Compression Screws Market for Wrist, Volume & Revenue (Kilo Tons) (USD Million) 2017 – 2030 83

FIG NO. 35. Global Headless Compression Screws Market for Foot, Volume & Revenue (Kilo Tons) (USD Million) 2017 – 2030 85

FIG NO. 36. Global Headless Compression Screws Market for Ankle, Volume & Revenue (Kilo Tons) (USD Million) 2017 – 2030 87

FIG NO. 37. Global Headless Compression Screws Market for Dental, Volume & Revenue (Kilo Tons) (USD Million) 2017 – 2030 89

FIG NO. 38. Headless Compression Screws Market Volume Share, By Materials, 2022 & 2030 92

FIG NO. 39. Headless Compression Screws Market Revenue Share, By Materials, 2022 & 2030 92

FIG NO. 40. Market Attractiveness Analysis, By Materials 93

FIG NO. 41. Incremental Revenue Growth Opportunity by Materials 93

FIG NO. 42. Headless Compression Screws Market Revenue, By Materials, 2017, 2022, 2026 & 2030 94

FIG NO. 43. Global Headless Compression Screws Market for Stainless Steel, Volume & Revenue (Kilo Tons) (USD Million) 2017 – 2030 95

FIG NO. 44. Global Headless Compression Screws Market for Titanium, Volume & Revenue (Kilo Tons) (USD Million) 2017 – 2030 97

FIG NO. 45. Headless Compression Screws Market Revenue Share, By Distribution Channel, 2022 & 2030 100

FIG NO. 46. Headless Compression Screws Market Revenue Share, By Distribution Channel, 2022 & 2030 100

FIG NO. 47. Market Attractiveness Analysis, By Distribution Channel 101

FIG NO. 48. Incremental Revenue Growth Opportunity by Distribution Channel 101

FIG NO. 49. Headless Compression Screws Market Revenue, By Distribution Channel, 2017, 2022, 2026 & 2030 102

FIG NO. 50. Global Headless Compression Screws Market for Direct, Volume & Revenue (Kilo Tons) (USD Million) 2017 – 2030 103

FIG NO. 51. Global Headless Compression Screws Market for Distributors, Volume & Revenue (Kilo Tons) (USD Million) 2017 – 2030 105

FIG NO. 52. Global Headless Compression Screws Market Volume Share, By Region, 2022 & 2030 108

FIG NO. 53. Global Headless Compression Screws Market Revenue Share, By Region, 2022 & 2030 108

FIG NO. 54. Market Attractiveness Analysis, By Region 109

FIG NO. 55. Incremental Revenue Growth Opportunity by Region 109

FIG NO. 56. Headless Compression Screws Market Revenue, By Region, 2017, 2022, 2026 & 2030 110

FIG NO. 57. North America Headless Compression Screws Market Volume & Revenue, 2017 – 2022 (Kilo Tons) (USD Million) 116

FIG NO. 58. Europe Headless Compression Screws Market Volume & Revenue, 2017 – 2022 (Kilo Tons) (USD Million) 128

FIG NO. 59. Asia Pacific Headless Compression Screws Market Volume & Revenue, 2017 – 2022 (Kilo Tons) (USD Million) 141

FIG NO. 60. Latin America Headless Compression Screws Market Volume & Revenue, 2017 – 2022 (Kilo Tons) (USD Million) 154

FIG NO. 61. The Middle-East Headless Compression Screws Market Volume & Revenue, 2017 – 2022 (Kilo Tons) (USD Million) 166

FIG NO. 62. Africa Headless Compression Screws Market Volume & Revenue, 2017 – 2022 (Kilo Tons) (USD Million) 178

FIG NO. 63. Research Methodology – Detailed View 193

FIG NO. 64. Research Methodology 194

List of Tables

TABLE NO. 1. : Global Headless Compression Screws Market: Snapshot 36

TABLE NO. 2. : Drivers for the Headless Compression Screws Market: Impact Analysis 42

TABLE NO. 3. : Restraints for the Headless Compression Screws Market: Impact Analysis 44

TABLE NO. 4. : Global Headless Compression Screws Market Volume & Revenue, By Region, 2017 – 2022 (Kilo Tons) 53

TABLE NO. 5. : Global Headless Compression Screws Market Volume & Revenue, By Region, 2017 – 2022 54

TABLE NO. 6. : Global Headless Compression Screws Market Volume & Revenue, By Type, 2017 – 2022 55

TABLE NO. 7. : Key Raw Materials & Suppliers 56

TABLE NO. 8. : Global Fully Threaded Screw Headless Compression Screws Market Volume & Revenue, By Region, 2017 – 2022 (Kilo Tons) (USD Million) 72

TABLE NO. 9. : Global Fully Threaded Screw Headless Compression Screws Market Volume & Revenue, By Region, 2023– 2030 (Kilo Tons) (USD Million) 72

TABLE NO. 10. : Global Both Ends Threaded Screw Headless Compression Screws Market Volume & Revenue, By Region, 2017 – 2022 (Kilo Tons) (USD Million) 74

TABLE NO. 11. : Global Both Ends Threaded Screw Headless Compression Screws Market Volume & Revenue, By Region, 2023– 2030 (Kilo Tons) (USD Million) 74

TABLE NO. 12. : Global Partially Threaded Screw Headless Compression Screws Market Volume & Revenue, By Region, 2017 – 2022 (Kilo Tons) (USD Million) 76

TABLE NO. 13. : Global Partially Threaded Screw Headless Compression Screws Market Volume & Revenue, By Region, 2023– 2030 (Kilo Tons) (USD Million) 76

TABLE NO. 14. : Global Hand Headless Compression Screws Market Volume & Revenue, By Region, 2017 – 2022 (Kilo Tons) (USD Million) 82

TABLE NO. 15. : Global Hand Headless Compression Screws Market Volume & Revenue, By Region, 2023– 2030 (Kilo Tons) (USD Million) 82

TABLE NO. 16. : Global Wrist Headless Compression Screws Market Volume & Revenue, By Region, 2017 – 2022 (Kilo Tons) (USD Million) 84

TABLE NO. 17. : Global Wrist Headless Compression Screws Market Volume & Revenue, By Region, 2023– 2030 (Kilo Tons) (USD Million) 84

TABLE NO. 18. : Global Foot Headless Compression Screws Market Volume & Revenue, By Region, 2017 – 2022 (Kilo Tons) (USD Million) 86

TABLE NO. 19. : Global Foot Headless Compression Screws Market Volume & Revenue, By Region, 2023– 2030 (Kilo Tons) (USD Million) 86

TABLE NO. 20. : Global Ankle Headless Compression Screws Market Volume & Revenue, By Region, 2017 – 2022 (Kilo Tons) (USD Million) 88

TABLE NO. 21. : Global Ankle Headless Compression Screws Market Volume & Revenue, By Region, 2023– 2030 (Kilo Tons) (USD Million) 88

TABLE NO. 22. : Global Dental Headless Compression Screws Market Volume & Revenue, By Region, 2017 – 2022 (Kilo Tons) (USD Million) 90

TABLE NO. 23. : Global Dental Headless Compression Screws Market Volume & Revenue, By Region, 2023– 2030 (Kilo Tons) (USD Million) 90

TABLE NO. 24. : Global Stainless Steel Headless Compression Screws Market Volume & Revenue, By Region, 2017 – 2022 (Kilo Tons) (USD Million) 96

TABLE NO. 25. : Global Stainless Steel Headless Compression Screws Market Volume & Revenue, By Region, 2023– 2030 (Kilo Tons) (USD Million) 96

TABLE NO. 26. : Global Titanium Headless Compression Screws Market Volume & Revenue, By Region, 2017 – 2022 (Kilo Tons) (USD Million) 98

TABLE NO. 27. : Global Titanium Headless Compression Screws Market Volume & Revenue, By Region, 2023– 2030 (Kilo Tons) (USD Million) 98

TABLE NO. 28. : Global Direct Headless Compression Screws Market Volume & Revenue, By Region, 2017 – 2022 (Kilo Tons) (USD Million) 104

TABLE NO. 29. : Global Direct Headless Compression Screws Market Volume & Revenue, By Region, 2023– 2030 (Kilo Tons) (USD Million) 104

TABLE NO. 30. : Global Distributors Headless Compression Screws Market Volume & Revenue, By Region, 2017 – 2022 (Kilo Tons) (USD Million) 106

TABLE NO. 31. : Global Distributors Headless Compression Screws Market Volume & Revenue, By Region, 2023– 2030 (Kilo Tons) (USD Million) 106

TABLE NO. 32. : Global Headless Compression Screws Market Volume & Revenue, By Region, 2017 – 2022 (Kilo Tons) (USD Million) 111

TABLE NO. 33. : Global Headless Compression Screws Market Volume & Revenue, By Region, 2023– 2030 (Kilo Tons) (USD Million) 111

TABLE NO. 34. : Global Headless Compression Screws Market Volume & Revenue, By Type, 2017 – 2022 (Kilo Tons) (USD Million) 112

TABLE NO. 35. : Global Headless Compression Screws Market Volume & Revenue, By Type, 2023– 2030 (Kilo Tons) (USD Million) 112

TABLE NO. 36. : Global Headless Compression Screws Market Volume & Revenue, By Application, 2017 – 2022 (Kilo Tons) (USD Million) 113

TABLE NO. 37. : Global Headless Compression Screws Market Volume & Revenue, By Application, 2023– 2030 (Kilo Tons) (USD Million) 113

TABLE NO. 38. : Global Headless Compression Screws Market Volume & Revenue, By Materials, 2017 – 2022 (Kilo Tons) (USD Million) 114

TABLE NO. 39. : Global Headless Compression Screws Market Volume & Revenue, By Materials, 2023– 2030 (Kilo Tons) (USD Million) 114

TABLE NO. 40. : Global Headless Compression Screws Market Volume & Revenue, By Distribution Channel, 2017 – 2022 (Kilo Tons) (USD Million) 115

TABLE NO. 41. : Global Headless Compression Screws Market Volume & Revenue, By Distribution Channel, 2023– 2030 (Kilo Tons) (USD Million) 115

TABLE NO. 42. : North America Headless Compression Screws Market Volume, By Country, 2017 – 2022 (Kilo Tons) 117

TABLE NO. 43. : North America Headless Compression Screws Market Volume, By Country, 2023– 2030 (Kilo Tons) 117

TABLE NO. 44. : North America Headless Compression Screws Market Revenue, By Country, 2017 – 2022 (USD Million) 118

TABLE NO. 45. : North America Headless Compression Screws Market Revenue, By Country, 2023– 2030 (USD Million) 118

TABLE NO. 46. : North America Headless Compression Screws Market Volume, By Type, 2017 – 2022 (Kilo Tons) 119

TABLE NO. 47. : North America Headless Compression Screws Market Volume, By Type, 2023– 2030 (Kilo Tons) 119

TABLE NO. 48. : North America Headless Compression Screws Market Revenue, By Type, 2017 – 2022 (USD Million) 120

TABLE NO. 49. : North America Headless Compression Screws Market Revenue, By Type, 2023– 2030 (USD Million) 120

TABLE NO. 50. : North America Headless Compression Screws Market Volume, By Application, 2017 – 2022 (Kilo Tons) 121

TABLE NO. 51. : North America Headless Compression Screws Market Volume, By Application, 2023– 2030 (Kilo Tons) 121

TABLE NO. 52. : North America Headless Compression Screws Market Revenue, By Application, 2017 – 2022 (USD Million) 122

TABLE NO. 53. : North America Headless Compression Screws Market Revenue, By Application, 2023– 2030 (USD Million) 122

TABLE NO. 54. : North America Headless Compression Screws Market Volume, By Materials, 2017 – 2022 (Kilo Tons) 123

TABLE NO. 55. : North America Headless Compression Screws Market Volume, By Materials, 2023– 2030 (Kilo Tons) 123

TABLE NO. 56. : North America Headless Compression Screws Market Revenue, By Materials, 2017 – 2022 (USD Million) 124

TABLE NO. 57. : North America Headless Compression Screws Market Revenue, By Materials, 2023– 2030 (USD Million) 124

TABLE NO. 58. : North America Headless Compression Screws Market Volume, By Distribution Channel, 2017 – 2022 (Kilo Tons) 125

TABLE NO. 59. : North America Headless Compression Screws Market Volume, By Distribution Channel, 2023– 2030 (Kilo Tons) 125

TABLE NO. 60. : North America Headless Compression Screws Market Revenue, By Distribution Channel, 2017 – 2022 (USD Million) 126

TABLE NO. 61. : North America Headless Compression Screws Market Revenue, By Distribution Channel, 2023– 2030 (USD Million) 126

TABLE NO. 62. : Europe Headless Compression Screws Market Volume, By Country, 2017 – 2022 (Kilo Tons) 129

TABLE NO. 63. : Europe Headless Compression Screws Market Volume, By Country, 2023– 2030 (Kilo Tons) 129

TABLE NO. 64. : Europe Headless Compression Screws Market Revenue, By Country, 2017 – 2022 (USD Million) 130

TABLE NO. 65. : Europe Headless Compression Screws Market Revenue, By Country, 2023– 2030 (USD Million) 130

TABLE NO. 66. : Europe Headless Compression Screws Market Volume, By Type, 2017 – 2022 (Kilo Tons) 132

TABLE NO. 67. : Europe Headless Compression Screws Market Volume, By Type, 2023– 2030 (Kilo Tons) 132

TABLE NO. 68. : Europe Headless Compression Screws Market Revenue, By Type, 2017 – 2022 (USD Million) 133

TABLE NO. 69. : Europe Headless Compression Screws Market Revenue, By Type, 2023– 2030 (USD Million) 133

TABLE NO. 70. : Europe Headless Compression Screws Market Volume, By Application, 2017 – 2022 (Kilo Tons) 134

TABLE NO. 71. : Europe Headless Compression Screws Market Volume, By Application, 2023– 2030 (Kilo Tons) 134

TABLE NO. 72. : Europe Headless Compression Screws Market Revenue, By Application, 2017 – 2022 (USD Million) 135

TABLE NO. 73. : Europe Headless Compression Screws Market Revenue, By Application, 2023– 2030 (USD Million) 135

TABLE NO. 74. : Europe Headless Compression Screws Market Volume, By Materials, 2017 – 2022 (Kilo Tons) 136

TABLE NO. 75. : Europe Headless Compression Screws Market Volume, By Materials, 2023– 2030 (Kilo Tons) 136

TABLE NO. 76. : Europe Headless Compression Screws Market Revenue, By Materials, 2017 – 2022 (USD Million) 137

TABLE NO. 77. : Europe Headless Compression Screws Market Revenue, By Materials, 2023– 2030 (USD Million) 137

TABLE NO. 78. : Europe Headless Compression Screws Market Volume, By Distribution Channel, 2017 – 2022 (Kilo Tons) 138

TABLE NO. 79. : Europe Headless Compression Screws Market Volume, By Distribution Channel, 2023– 2030 (Kilo Tons) 138

TABLE NO. 80. : Europe Headless Compression Screws Market Revenue, By Distribution Channel, 2017 – 2022 (USD Million) 139

TABLE NO. 81. : Europe Headless Compression Screws Market Revenue, By Distribution Channel, 2023– 2030 (USD Million) 139

TABLE NO. 82. : Asia Pacific Headless Compression Screws Market Volume, By Country, 2017 – 2022 (Kilo Tons) 142

TABLE NO. 83. : Asia Pacific Headless Compression Screws Market Volume, By Country, 2023– 2030 (Kilo Tons) 142

TABLE NO. 84. : Asia Pacific Headless Compression Screws Market Revenue, By Country, 2017 – 2022 (USD Million) 143

TABLE NO. 85. : Asia Pacific Headless Compression Screws Market Revenue, By Country, 2023– 2030 (USD Million) 143

TABLE NO. 86. : Asia Pacific Headless Compression Screws Market Volume, By Type, 2017 – 2022 (Kilo Tons) 145

TABLE NO. 87. : Asia Pacific Headless Compression Screws Market Volume, By Type, 2023– 2030 (Kilo Tons) 145

TABLE NO. 88. : Asia Pacific Headless Compression Screws Market Revenue, By Type, 2017 – 2022 (USD Million) 146

TABLE NO. 89. : Asia Pacific Headless Compression Screws Market Revenue, By Type, 2023– 2030 (USD Million) 146

TABLE NO. 90. : Asia Pacific Headless Compression Screws Market Volume, By Application, 2017 – 2022 (Kilo Tons) 147

TABLE NO. 91. : Asia Pacific Headless Compression Screws Market Volume, By Application, 2023– 2030 (Kilo Tons) 147

TABLE NO. 92. : Asia Pacific Headless Compression Screws Market Revenue, By Application, 2017 – 2022 (USD Million) 148

TABLE NO. 93. : Asia Pacific Headless Compression Screws Market Revenue, By Application, 2023– 2030 (USD Million) 148

TABLE NO. 94. : Asia Pacific Headless Compression Screws Market Volume, By Materials, 2017 – 2022 (Kilo Tons) 149

TABLE NO. 95. : Asia Pacific Headless Compression Screws Market Volume, By Materials, 2023– 2030 (Kilo Tons) 149

TABLE NO. 96. : Asia Pacific Headless Compression Screws Market Revenue, By Materials, 2017 – 2022 (USD Million) 150

TABLE NO. 97. : Asia Pacific Headless Compression Screws Market Revenue, By Materials, 2023– 2030 (USD Million) 150

TABLE NO. 98. : Asia Pacific Headless Compression Screws Market Volume, By Distribution Channel, 2017 – 2022 (Kilo Tons) 151

TABLE NO. 99. : Asia Pacific Headless Compression Screws Market Volume, By Distribution Channel, 2023– 2030 (Kilo Tons) 151

TABLE NO. 100. : Asia Pacific Headless Compression Screws Market Revenue, By Distribution Channel, 2017 – 2022 (USD Million) 152

TABLE NO. 101. : Asia Pacific Headless Compression Screws Market Revenue, By Distribution Channel, 2023– 2030 (USD Million) 152

TABLE NO. 102. : Latin America Headless Compression Screws Market Volume, By Country, 2017 – 2022 (Kilo Tons) 155

TABLE NO. 103. : Latin America Headless Compression Screws Market Volume, By Country, 2023– 2030 (Kilo Tons) 155

TABLE NO. 104. : Latin America Headless Compression Screws Market Revenue, By Country, 2017 – 2022 (USD Million) 156

TABLE NO. 105. : Latin America Headless Compression Screws Market Revenue, By Country, 2023– 2030 (USD Million) 156

TABLE NO. 106. : Latin America Headless Compression Screws Market Volume, By Type, 2017 – 2022 (Kilo Tons) 157

TABLE NO. 107. : Latin America Headless Compression Screws Market Volume, By Type, 2023– 2030 (Kilo Tons) 157

TABLE NO. 108. : Latin America Headless Compression Screws Market Revenue, By Type, 2017 – 2022 (USD Million) 158

TABLE NO. 109. : Latin America Headless Compression Screws Market Revenue, By Type, 2023– 2030 (USD Million) 158

TABLE NO. 110. : Latin America Headless Compression Screws Market Volume, By Application, 2017 – 2022 (Kilo Tons) 159

TABLE NO. 111. : Latin America Headless Compression Screws Market Volume, By Application, 2023– 2030 (Kilo Tons) 159

TABLE NO. 112. : Latin America Headless Compression Screws Market Revenue, By Application, 2017 – 2022 (USD Million) 160

TABLE NO. 113. : Latin America Headless Compression Screws Market Revenue, By Application, 2023– 2030 (USD Million) 160

TABLE NO. 114. : Latin America Headless Compression Screws Market Volume, By Materials, 2017 – 2022 (Kilo Tons) 161

TABLE NO. 115. : Latin America Headless Compression Screws Market Volume, By Materials, 2023– 2030 (Kilo Tons) 161

TABLE NO. 116. : Latin America Headless Compression Screws Market Revenue, By Materials, 2017 – 2022 (USD Million) 162

TABLE NO. 117. : Latin America Headless Compression Screws Market Revenue, By Materials, 2023– 2030 (USD Million) 162

TABLE NO. 118. : Latin America Headless Compression Screws Market Volume, By Distribution Channel, 2017 – 2022 (Kilo Tons) 163

TABLE NO. 119. : Latin America Headless Compression Screws Market Volume, By Distribution Channel, 2023– 2030 (Kilo Tons) 163

TABLE NO. 120. : Latin America Headless Compression Screws Market Revenue, By Distribution Channel, 2017 – 2022 (USD Million) 164

TABLE NO. 121. : Latin America Headless Compression Screws Market Revenue, By Distribution Channel, 2023– 2030 (USD Million) 164

TABLE NO. 122. : Middle East Headless Compression Screws Market Volume, By Country, 2017 – 2022 (Kilo Tons) 167

TABLE NO. 123. : Middle East Headless Compression Screws Market Volume, By Country, 2023– 2030 (Kilo Tons) 167

TABLE NO. 124. : Middle East Headless Compression Screws Market Revenue, By Country, 2017 – 2022 (USD Million) 168

TABLE NO. 125. : Middle East Headless Compression Screws Market Revenue, By Country, 2023– 2030 (USD Million) 168

TABLE NO. 126. : Middle East Headless Compression Screws Market Volume, By Type, 2017 – 2022 (Kilo Tons) 169

TABLE NO. 127. : Middle East Headless Compression Screws Market Volume, By Type, 2023– 2030 (Kilo Tons) 169

TABLE NO. 128. : Middle East Headless Compression Screws Market Revenue, By Type, 2017 – 2022 (USD Million) 170

TABLE NO. 129. : Middle East Headless Compression Screws Market Revenue, By Type, 2023– 2030 (USD Million) 170

TABLE NO. 130. : Middle East Headless Compression Screws Market Volume, By Application, 2017 – 2022 (Kilo Tons) 171

TABLE NO. 131. : Middle East Headless Compression Screws Market Volume, By Application, 2023– 2030 (Kilo Tons) 171

TABLE NO. 132. : Middle East Headless Compression Screws Market Revenue, By Application, 2017 – 2022 (USD Million) 172

TABLE NO. 133. : Middle East Headless Compression Screws Market Revenue, By Application, 2023– 2030 (USD Million) 172

TABLE NO. 134. : Middle East Headless Compression Screws Market Volume, By Materials, 2017 – 2022 (Kilo Tons) 173

TABLE NO. 135. : Middle East Headless Compression Screws Market Volume, By Materials, 2023– 2030 (Kilo Tons) 173

TABLE NO. 136. : Middle East Headless Compression Screws Market Revenue, By Materials, 2017 – 2022 (USD Million) 174

TABLE NO. 137. : Middle East Headless Compression Screws Market Revenue, By Materials, 2023– 2030 (USD Million) 174

TABLE NO. 138. : Middle East Headless Compression Screws Market Volume, By Distribution Channel, 2017 – 2022 (Kilo Tons) 175

TABLE NO. 139. : Middle East Headless Compression Screws Market Volume, By Distribution Channel, 2023– 2030 (Kilo Tons) 175

TABLE NO. 140. : Middle East Headless Compression Screws Market Revenue, By Distribution Channel, 2017 – 2022 (USD Million) 176

TABLE NO. 141. : Middle East Headless Compression Screws Market Revenue, By Distribution Channel, 2023– 2030 (USD Million) 176

TABLE NO. 142. : Africa Headless Compression Screws Market Volume, By Country, 2017 – 2022 (Kilo Tons) 179

TABLE NO. 143. : Africa Headless Compression Screws Market Volume, By Country, 2023– 2030 (Kilo Tons) 179

TABLE NO. 144. : Africa Headless Compression Screws Market Revenue, By Country, 2017 – 2022 (USD Million) 180

TABLE NO. 145. : Africa Headless Compression Screws Market Revenue, By Country, 2023– 2030 (USD Million) 180

TABLE NO. 146. : Africa Headless Compression Screws Market Volume, By Type, 2017 – 2022 (Kilo Tons) 181

TABLE NO. 147. : Africa Headless Compression Screws Market Volume, By Type, 2023– 2030 (Kilo Tons) 181

TABLE NO. 148. : Africa Headless Compression Screws Market Revenue, By Type, 2017 – 2022 (USD Million) 182

TABLE NO. 149. : Africa Headless Compression Screws Market Revenue, By Type, 2023– 2030 (USD Million) 182

TABLE NO. 150. : Africa Headless Compression Screws Market Volume, By Application, 2017 – 2022 (Kilo Tons) 183

TABLE NO. 151. : Africa Headless Compression Screws Market Volume, By Application, 2023– 2030 (Kilo Tons) 183

TABLE NO. 152. : Africa Headless Compression Screws Market Revenue, By Application, 2017 – 2022 (USD Million) 184

TABLE NO. 153. : Africa Headless Compression Screws Market Revenue, By Application, 2023– 2030 (USD Million) 184

TABLE NO. 154. : Africa Headless Compression Screws Market Volume, By Materials, 2017 – 2022 (Kilo Tons) 185

TABLE NO. 155. : Africa Headless Compression Screws Market Volume, By Materials, 2023– 2030 (Kilo Tons) 185

TABLE NO. 156. : Africa Headless Compression Screws Market Revenue, By Materials, 2017 – 2022 (USD Million) 186

TABLE NO. 157. : Africa Headless Compression Screws Market Revenue, By Materials, 2023– 2030 (USD Million) 186

TABLE NO. 158. : Africa Headless Compression Screws Market Volume, By Distribution Channel, 2017 – 2022 (Kilo Tons) 187

TABLE NO. 159. : Africa Headless Compression Screws Market Volume, By Distribution Channel, 2023– 2030 (Kilo Tons) 187

TABLE NO. 160. : Africa Headless Compression Screws Market Revenue, By Distribution Channel, 2017 – 2022 (USD Million) 188

TABLE NO. 161. : Africa Headless Compression Screws Market Revenue, By Distribution Channel, 2023– 2030 (USD Million) 188

Frequently asked questions:

What are Headless Compression Screws, and how are they used in orthopedic and dental procedures?

Headless Compression Screws are medical devices used in orthopedic and dental surgeries to fix and stabilize bone fractures, particularly in small bones like those in the hand, wrist, foot, and ankle. These screws are designed without a protruding head, allowing them to be countersunk into bones without causing irritation or tissue damage. They work by compressing bone fragments together, promoting healing and restoring stability to the injured area.

What factors are driving the growth of the Headless Compression Screws market globally?

The Headless Compression Screws market is experiencing growth due to several key drivers. Firstly, an increasing demand for orthopedic and dental procedures is driven by a growing aging population and a rise in sports-related injuries. Advances in surgical techniques have made these procedures more accessible and effective, further boosting the market. Additionally, the versatility and effectiveness of headless compression screws make them a preferred choice for many surgeons.

What are the key applications of Headless Compression Screws in orthopedics and dentistry?

Headless Compression Screws find application in a wide range of orthopedic and dental procedures. In orthopedics, they are commonly used in hand and foot surgeries, including the treatment of fractures, fusions, and osteotomies. These screws are employed in jaw reconstruction, maxillofacial surgery, and dental implant placements in dentistry. Their adaptability and minimally invasive nature make them versatile tools in these fields.

Are there different types of Headless Compression Screws available, and how do they differ in design and application?

Yes, there are different types of Headless Compression Screws with variations in design and application. Fully Threaded Screws, Partially Threaded Screws, and Cannulated Screws are some common types. Fully Threaded Screws are versatile and can be used in various bone types, while Partially Threaded Screws are designed for specific anatomical requirements. Cannulated Screws have a hollow center, allowing for the insertion of a guide wire, aiding in precise placement. The choice of screw type depends on the surgical procedure and the patient’s needs.

How does the region segment the Headless Compression Screws market, and which regions are experiencing the fastest growth?

The Headless Compression Screws market is segmented by region into North America, Europe, Asia Pacific, Latin America, and the Middle East and Africa. While North America and Europe have historically held significant shares, the fastest growth is expected in North America, driven by advancements in surgical techniques and a rising aging population. Asia Pacific is also experiencing substantial growth due to increasing healthcare infrastructure and orthopedic procedures in emerging economies.

What are the major challenges medical device companies face in the Headless Compression Screws market?

Medical device companies in the Headless Compression Screws market encounter challenges such as the high cost associated with product development and manufacturing. Additionally, limited reimbursement options for certain procedures can impact market adoption. Competition from alternative fixation methods, like traditional screws and plates, also poses challenges requiring innovative product offerings.

How do Headless Compression Screws compare to alternative fixation methods regarding effectiveness and cost-efficiency?

Headless Compression Screws are often preferred to promote bone healing and minimize tissue irritation. However, their cost can be higher than alternative fixation methods initially. Yet, their benefits in terms of reduced surgical trauma, faster recovery, and long-term stability can lead to cost-efficiency over the patient’s entire treatment journey.

What role does research and development play in the innovation of Headless Compression Screws, and what are some recent advancements in this field?

Research and development are integral to advancing Headless Compression Screws. Recent innovations include improved screw designs for better compression and stability, enhanced materials for increased strength, and customization options that allow tailoring screws to specific anatomical needs. Minimally invasive techniques and navigational systems have also improved the accuracy of screw placement.

How are healthcare reimbursement policies impacting the adoption of Headless Compression Screws in surgical procedures?

Reimbursement policies vary by region and procedure. In some cases, reimbursement may not cover the full cost of Headless Compression Screw procedures, which can challenge patients and healthcare providers. Manufacturers and healthcare professionals are working to address these reimbursement issues to ensure broader access to these advanced surgical techniques.

What strategies are medical device companies employing to expand their presence in emerging markets for Headless Compression Screws?

Medical device companies are actively pursuing expansion into emerging markets by forming partnerships with local distributors and healthcare facilities. They also tailor their product offerings to meet these markets’ specific needs and regulatory requirements. Educational initiatives and training programs for healthcare professionals are being implemented to promote awareness and adoption of Headless Compression Screws in emerging regions.

UK Multihead Weighers Market

Published:
Report ID: 35903

Asia Pacific Modular Construction Market

Published:
Report ID: 35891

Japan Multihead Weighers Market

Published:
Report ID: 35762

Germany Multihead Weighers Market

Published:
Report ID: 35610

Hydraulic Pumps Market

Published:
Report ID: 7796

Mobile Robotics Market

Published:
Report ID: 8913

Lab Automation in Drug Discovery Market

Published:
Report ID: 32470

Europe Rotary Kiln Market

Published:
Report ID: 30782

Motorized Drive Rollers (MDR) Market

Published:
Report ID: 23506

Cryogenic Valves Market

Published:
Report ID: 22219

Smart Wine Cellar Market

Published:
Report ID: 22795

Rotary Kiln Market

Published:
Report ID: 10095

Purchase Options

$2999
Delivery Format: Excel.
$4999
Designed for the individual purchaser.
$6999
Users located at a single corporate site or regional office.
$7999
Allowed for unlimited sharing globally within one company.
Smallform of Sample request

Have a question?

User Profile

Don’t settle for less – trust Mitul to help you find the best solution.

Report delivery within 24 to 48 hours

– Other Info –

What people say?-

User Review

I am very impressed with the information in this report. The author clearly did their research when they came up with this product and it has already given me a lot of ideas.

Jana Schmidt
CEDAR CX Technologies

– Connect with us –

Phone

+91 6232 49 3207


support

24/7 Research Support


sales@credenceresearch.com

– Research Methodology –

Going beyond the basics: advanced techniques in research methodology

– Trusted By –

Pepshi, LG, Nestle
Motorola, Honeywell, Johnson and johnson
LG Chem, SIEMENS, Pfizer
Unilever, Samsonite, QIAGEN