Market Overview:
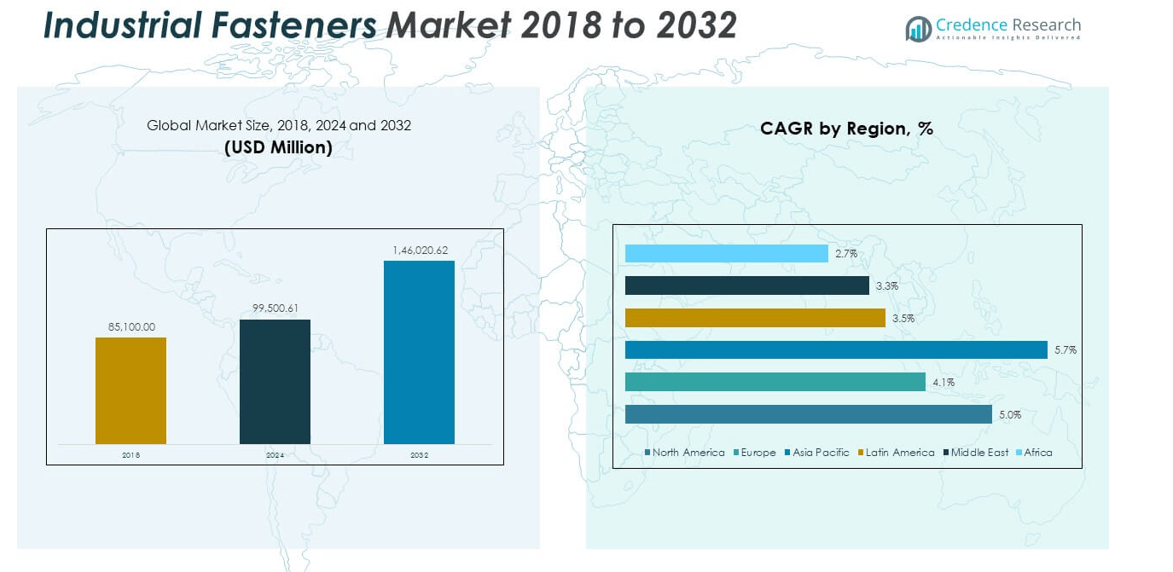
The Global Industrial Fasteners Market size was valued at USD 85,100.00 million in 2018 to USD 99,500.61 million in 2024 and is anticipated to reach USD 1,46,020.62 million by 2032, at a CAGR of 4.96% during the forecast period.
| REPORT ATTRIBUTE |
DETAILS |
| Historical Period |
2020-2023 |
| Base Year |
2024 |
| Forecast Period |
2025-2032 |
| Industrial Fasteners Market Size 2024 |
USD 99,500.61 million |
| Industrial Fasteners Market, CAGR |
4.96% |
| Industrial Fasteners Market Size 2032 |
USD 1,46,020.62 million |
Growth in the market is driven by rising demand across automotive, aerospace, construction, and machinery industries. Expanding infrastructure projects and increased manufacturing activity in emerging economies are supporting adoption. The shift toward lightweight, durable materials and the rise of automated production technologies are further boosting product innovation. Advancements in coatings and anti-corrosion fasteners enhance durability, fueling demand in industrial applications. Rising adoption of energy-efficient and cost-effective fastening solutions strengthens the market outlook.
Geographically, Asia-Pacific leads the market due to rapid industrialization, strong automotive production, and large-scale construction projects. North America shows steady growth, supported by aerospace and defense applications. Europe remains a key region, with strong demand in automotive and engineering industries. Emerging regions in Latin America and the Middle East are witnessing increasing adoption, driven by infrastructure development and expanding industrial bases. This geographic spread highlights both established leaders and upcoming growth hubs in the market.
Market Insights:
- The Global Industrial Fasteners Market size was USD 85,100 million in 2018, reached USD 99,500.61 million in 2024, and is anticipated to hit USD 146,020.62 million by 2032, at a CAGR of 4.96%.
- North America accounted for around 24.4% of the 2024 share, driven by strong aerospace and automotive demand. Europe followed with significant contributions from engineering and construction industries, while Asia Pacific held the largest share due to rapid industrialization.
- Asia Pacific is the fastest-growing region, led by manufacturing expansion in China and India, supported by infrastructure projects and rising automotive production.
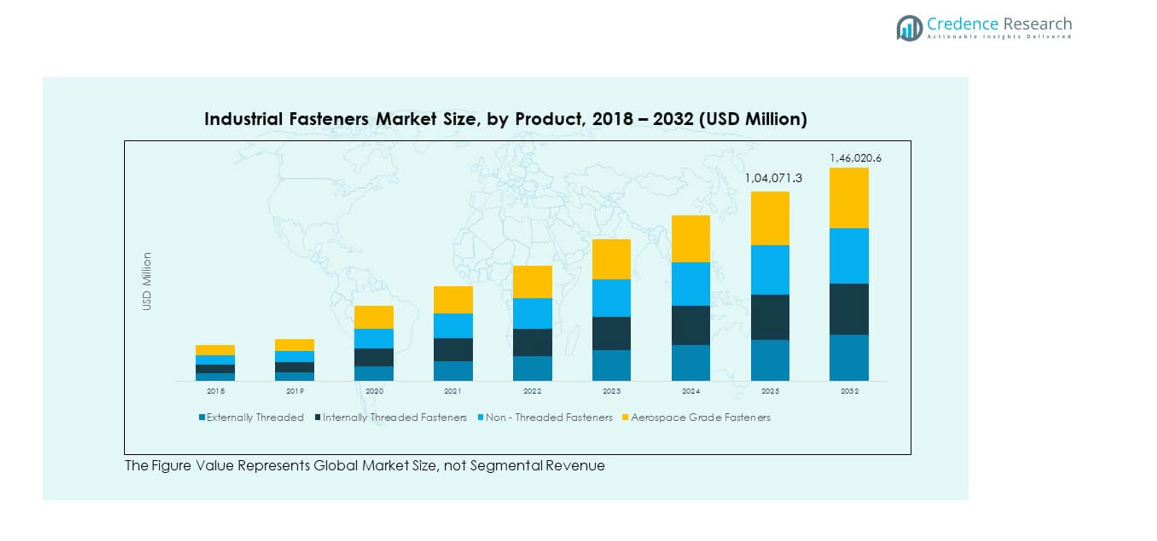
- Externally threaded fasteners held the largest segment share in 2024, making up more than 35% of overall demand due to widespread use in automotive and construction.
- Aerospace-grade fasteners represented a smaller share, under 15% in 2024, but remain critical for specialized high-performance applications in aviation and defense
Access crucial information at unmatched prices!
Request your sample report today & start making informed decisions powered by Credence Research Inc.!
Download Sample
Market Drivers:
Rising Demand from Automotive and Aerospace Industries Driving Market Expansion:
The automotive and aerospace industries are key drivers for the Global Industrial Fasteners Market. Increasing vehicle production and rising adoption of electric and hybrid vehicles are fueling demand for durable fastening solutions. Aerospace manufacturers require high-performance fasteners to meet strict safety and quality standards. Growth in air travel and fleet expansion contributes to steady procurement of advanced fasteners. Lightweight and corrosion-resistant materials are favored to improve efficiency and safety. Market players focus on enhancing product performance to align with evolving regulations. The automotive aftermarket further adds to demand through replacement and repair needs. It benefits from consistent product innovation tailored to meet industry requirements.
- For instance, Tesla’s use of large aluminum castings in its electric vehicles demands fasteners capable of withstanding increased torque and load, with suppliers ensuring uniformity and precision for millions of vehicle assemblies annually.
Infrastructure Development and Construction Activities Fueling Strong Market Growth:
Large-scale construction projects across residential, commercial, and industrial sectors are boosting fastener consumption. Governments worldwide are investing in smart cities, transportation networks, and renewable energy infrastructure. This creates sustained demand for bolts, screws, and specialty fasteners in high-volume quantities. Emerging economies in Asia-Pacific and the Middle East showcase strong construction activities that expand usage. Demand for high-strength products increases due to complex building structures. Advanced fastening technologies also ensure safety and long-term reliability in projects. The Global Industrial Fasteners Market leverages construction sector growth to strengthen its position. It gains momentum through strong alignment with infrastructure priorities worldwide.
- For instance, High-strength TensionCam bolts developed by Bulten are employed in railways and large roadways supporting dynamic load requirements critical for infrastructure longevity.
Technological Advancements in Product Design Enhancing Market Competitiveness:
Technology plays a vital role in shaping the growth of industrial fasteners. Advanced manufacturing methods like cold forging and CNC machining improve quality and precision. Coating innovations enhance corrosion resistance, extending product life in critical applications. Automation in production lines reduces errors and ensures consistent supply to end users. Use of lightweight alloys and composites supports automotive and aerospace sustainability goals. Smart fasteners with sensors are emerging to monitor stress and durability. Continuous R&D investment creates opportunities for cost-effective and high-performance designs. The Global Industrial Fasteners Market benefits from this technological evolution. It strengthens its global competitiveness through innovative product offerings.
Diversification Across End-User Industries Strengthening Market Expansion:
Fasteners are essential across a wide range of industries, including electronics, shipbuilding, and machinery. Consumer electronics and appliances require precise fastening components for compact designs. Heavy equipment and agricultural machinery demand durable and high-strength fasteners. Energy sectors like wind and solar also use specialized fasteners for installations. Diversification reduces dependence on a single industry and drives stable revenue growth. Market participants focus on tailoring fasteners to meet the needs of different sectors. It enhances resilience against cyclical slowdowns in automotive or construction industries. The Global Industrial Fasteners Market builds strength by serving varied applications. It secures long-term growth through its cross-sector presence.
Market Trends:
Growing Adoption of Sustainable and Recyclable Materials Across Manufacturing Processes:
Sustainability has become a central trend in the Global Industrial Fasteners Market. Manufacturers adopt recyclable materials and eco-friendly coatings to meet environmental standards. The use of aluminum and other lightweight alloys is rising to lower emissions. Green manufacturing practices help firms comply with global sustainability policies. Increasing awareness among end users drives demand for eco-conscious fastening solutions. Industry leaders highlight sustainability as a branding strategy to improve market presence. Certifications and compliance frameworks strengthen trust in sustainable fasteners. It is shaping long-term demand patterns by aligning with global climate goals.
- For instance, TR Fastenings introduced a range of plastic fasteners made from 100% recycled nylon that demonstrated up to a 90% reduction in CO2 emissions while maintaining mechanical performance equivalent to prime materials.
Rising Popularity of Custom-Engineered Fasteners for Specialized Applications:
Industries are increasingly seeking custom fasteners to address unique design and performance needs. Aerospace, defense, and electronics sectors require specialized fastening solutions with strict tolerances. Customization ensures optimal safety, efficiency, and fit in demanding applications. Manufacturers invest in advanced design software and prototyping for quick customization. This trend enhances collaboration between suppliers and end users. Custom fasteners reduce assembly time and improve structural reliability. The Global Industrial Fasteners Market benefits from this rising trend of tailored solutions. It reflects a shift toward precision-focused and application-specific product development.
- For instance, PEM® fasteners deliver custom-engineered self-clinching and surface-mount technologies for defense electronics, miniaturizing components while reducing assembly time. Clarendon Specialty Fasteners specializes in aerospace-grade, traceable fasteners manufactured to custom drawings with exotic titanium materials meeting NAS and MS aerospace standards.
Integration of Digital Platforms and E-Commerce Enhancing Distribution Efficiency:
E-commerce platforms are transforming sales channels for industrial fasteners globally. Online platforms simplify procurement for small and large buyers across multiple sectors. Distributors are integrating digital catalogs and advanced logistics to streamline supply chains. Digital platforms enable real-time tracking and efficient inventory management. Buyers benefit from transparent pricing and broad product availability. Online expansion supports global reach and easier access to diverse fastener types. The Global Industrial Fasteners Market experiences increased adoption of e-commerce strategies. It creates competitive advantages for firms that embrace digital transformation.
Emergence of Smart and Sensor-Enabled Fasteners in Advanced Applications:
Smart fasteners equipped with sensors are becoming a trend in industrial applications. They provide real-time data on stress, load, and environmental impact. Aerospace and defense industries are early adopters of such technologies. These fasteners enhance predictive maintenance and improve safety standards. Integration with IoT platforms creates opportunities for connected product ecosystems. High-value projects in construction and energy adopt smart fasteners for efficiency. Market players invest in R&D to expand applications of sensor-enabled fasteners. The Global Industrial Fasteners Market sees rising innovation in intelligent fastening solutions. It positions itself as a forward-looking industry embracing digitalization.
Market Challenges Analysis:
Volatility in Raw Material Prices Creating Pressure on Production Costs:
The fastener industry is highly dependent on steel, aluminum, and other raw materials. Price fluctuations create uncertainty in production planning and profitability. Rising energy costs further intensify the challenge for manufacturers. Global supply chain disruptions increase procurement costs and delay deliveries. It weakens the ability of firms to offer competitive pricing consistently. Smaller companies face difficulties in maintaining stable supply under cost pressures. Frequent raw material volatility forces adjustments in contract terms and pricing. The Global Industrial Fasteners Market faces growing challenges in securing steady margins. It continues to experience financial strain from external commodity risks.
Intense Global Competition and Counterfeit Products Limiting Growth Prospects:
Competition among global and regional players remains intense across the market. Larger firms expand through acquisitions and new technologies to stay ahead. Regional suppliers often compete on price, creating downward pressure on margins. Counterfeit fasteners pose risks in safety-critical industries such as aerospace. These low-quality products damage brand trust and raise liability concerns. It challenges genuine manufacturers to protect intellectual property and maintain quality standards. Buyers sometimes struggle to distinguish authentic from counterfeit products. The Global Industrial Fasteners Market faces limitations in balancing price competitiveness with quality assurance. It requires stronger regulatory frameworks and industry collaboration to tackle this issue.
Market Opportunities:
Expansion of Renewable Energy Projects Creating New Fastener Applications:
Renewable energy growth offers major opportunities for fastener manufacturers worldwide. Wind turbines, solar panels, and hydro installations require specialized fastening solutions. Demand is rising for corrosion-resistant and high-durability fasteners in energy projects. Governments invest heavily in sustainable energy infrastructure, fueling industry potential. It helps expand the Global Industrial Fasteners Market into emerging green applications. Companies focusing on renewable sector needs secure long-term growth. This opportunity aligns the industry with global decarbonization goals. It positions fastener manufacturers as contributors to the clean energy transition.
Increasing Industrialization in Emerging Economies Supporting Market Penetration:
Rapid industrialization in Asia-Pacific, Latin America, and Africa creates new avenues for growth. Expanding manufacturing bases increase demand for machinery, equipment, and infrastructure. Fasteners play a crucial role in supporting these developments effectively. Global suppliers establish regional hubs to cater to localized needs. It strengthens the Global Industrial Fasteners Market presence in high-growth areas. Rising foreign investments in manufacturing and construction add to opportunities. Collaboration with regional distributors enhances market penetration strategies. It supports sustainable growth across industrializing economies worldwide.
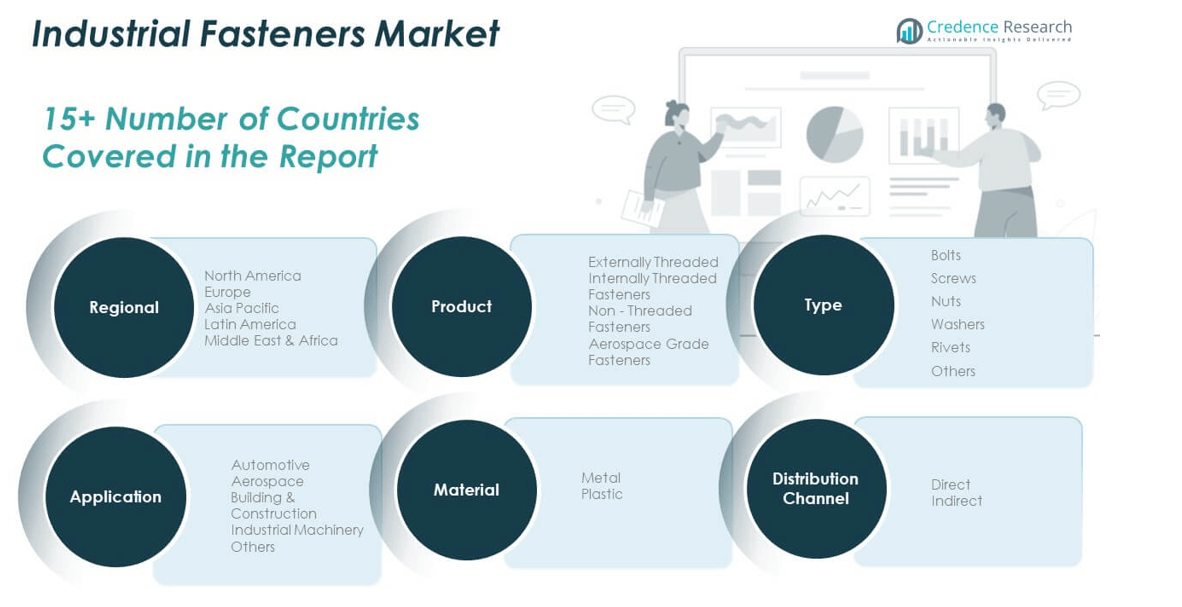
Market Segmentation Analysis:
By Type
Bolts, screws, and nuts dominate demand due to their wide application in machinery, automotive, and construction. Washers and rivets support critical fastening needs where stability and reliability are essential. The “others” category reflects specialized fasteners catering to niche industrial uses. The Global Industrial Fasteners Market benefits from balanced demand across these core categories, driven by durability and versatility.
- For example, screws lead type demand due to their removability and adaptability, supporting over half of the automotive fastener applications in global vehicle production, while specialty fasteners like self-piercing rivets cater to multi-material joining needs in the electric vehicle segment.
By Product
Externally threaded fasteners remain the leading segment due to their use in structural assemblies. Internally threaded and non-threaded fasteners find demand in heavy equipment, electronics, and general manufacturing. Aerospace-grade fasteners represent a premium category, ensuring safety and compliance in high-performance environments. It aligns with rising adoption in advanced engineering sectors.
- For instance, aerospace-grade titanium fasteners such as SPS Aeronautical’s TITANTM761 boasts tensile strengths exceeding 1240 MPa and weigh 40% less than conventional alloy steel fasteners, supporting weight reduction in commercial and military aircraft. These products meet stringent fatigue and corrosion-resistance requirements vital for jet engines and structural components.
By Material
Metal dominates the material segment, preferred for its strength and resistance across heavy-duty applications. Plastic fasteners, though smaller in share, gain traction in electronics, automotive interiors, and lightweight designs. It reflects the industry’s adaptability to evolving design requirements and weight-reduction initiatives.
By Application
Automotive leads demand, with aerospace and construction contributing significantly to market growth. Industrial machinery extends adoption, requiring fasteners for durability and operational safety. The “others” segment covers diversified industries such as shipbuilding and consumer electronics. It highlights broad application opportunities within the market.
By Distribution Channel
Direct distribution ensures strong supply partnerships with large industrial buyers. Indirect distribution channels, including wholesalers and retailers, extend access to small and mid-sized enterprises. It supports widespread adoption across different scales of demand and strengthens global market penetration.
Segmentation:
By Type
- Bolts
- Screws
- Nuts
- Washers
- Rivets
- Others
By Product
- Externally Threaded
- Internally Threaded Fasteners
- Non-Threaded Fasteners
- Aerospace Grade Fasteners
By Material
By Application
- Automotive
- Aerospace
- Building & Construction
- Industrial Machinery
- Others
By Distribution Channel
By Region
- North America
- Europe
- UK
- France
- Germany
- Italy
- Spain
- Russia
- Rest of Europe
- Asia Pacific
- China
- Japan
- South Korea
- India
- Australia
- Southeast Asia
- Rest of Asia Pacific
- Latin America
- Brazil
- Argentina
- Rest of Latin America
- Middle East
- GCC Countries
- Israel
- Turkey
- Rest of Middle East
- Africa
- South Africa
- Egypt
- Rest of Africa
Regional Analysis:
North America
The North America Industrial Fasteners Market size was valued at USD 21,181.39 million in 2018 to USD 24,327.30 million in 2024 and is anticipated to reach USD 35,629.29 million by 2032, at a CAGR of 4.89% during the forecast period. North America holds around 24.4% of the global share in 2024, supported by strong demand in automotive, aerospace, and defense sectors. The U.S. remains the largest contributor, benefiting from advanced manufacturing and established distribution networks. Canada supports growth through construction and mining activities, while Mexico drives demand through its automotive production hub. The region benefits from technological innovation and high standards in product quality. The Global Industrial Fasteners Market gains stability from this region’s consistent demand. It positions North America as a mature yet dynamic contributor to global expansion.
Asia Pacific
India alone reached USD 4,388.50 million in 2024 and is projected to hit USD 7,263.86 million by 2032, growing at a CAGR of 6.50%. Asia Pacific dominates global share, supported by massive manufacturing activity in China, Japan, and India. Rapid infrastructure development, booming automotive industries, and strong construction activity drive growth. Aerospace and electronics further contribute to demand across advanced economies. Southeast Asia and Australia show steady growth, supported by industrial expansion and mining projects. The Global Industrial Fasteners Market positions Asia Pacific as the leading hub. It reflects strong regional momentum fueled by industrialization and urbanization.
Shape Your Report to Specific Countries or Regions & Enjoy 30% Off!
Key Player Analysis:
- Illinois Tool Works, Inc.
- Arconic Fastening Systems and Rings
- Hilti Corporation
- LISI Group – Link Solutions for Industry
- Nifco Inc.
- MW Industries, Inc.
- Birmingham Fastener and Supply, Inc.
- SESCO Industries, Inc.
- Elgin Fastener Group LLC
- Slidematic
- Dokka Fasteners A S
- Manufacturing Associates, Inc.
- Eastwood Manufacturing
- Acument Global Technologies, Inc.
- ATF, Inc.
Competitive Analysis:
The Global Industrial Fasteners Market is characterized by strong competition among multinational corporations and regional suppliers. Established players such as Illinois Tool Works, Arconic Fastening Systems, and Hilti focus on innovation, acquisitions, and global expansion to maintain leadership. Smaller firms emphasize cost efficiency and localized supply to remain competitive. Companies prioritize the development of lightweight, corrosion-resistant, and high-strength fasteners to serve automotive, aerospace, and construction industries. E-commerce platforms and digital distribution networks enhance accessibility for buyers. It remains highly fragmented, with consolidation trends shaping future competitive dynamics.
Recent Developments:
- In May 2023, Arconic entered into a definitive agreement to be acquired by Apollo Global Management in an all-cash transaction valued at approximately $5.2 billion. This acquisition, completed by mid-2023, positions Arconic to leverage Apollo’s industry expertise and investments for upgrades in machine centers, technology, and environmentally friendly projects aimed at strengthening its competitive position.
- In March 2023, Hilti Corporation announced a strategic partnership with construction robotics company Canvas. This collaboration aims to scale Canvas’s advanced robotic drywalling solutions globally, combining Hilti’s manufacturing capabilities with Canvas’s robotics technology to enhance productivity, safety, and efficiency in construction.
- In July 2025, LISI Group entered exclusive negotiations to sell its medical division, Lisi Medical, to SK Capital Partners. This acquisition, expected to close in the second half of 2025, will expand SK Capital’s presence in the life sciences CDMO sector, leveraging Lisi Medical’s expertise in high-precision components for medical devices.
- In August 2025, Nifco Inc. announced the progress of acquiring its own shares, having repurchased 746,000 shares during August as part of its authorized program to buy up to 1.5 million shares by October 2025, indicating a focus on shareholder value and financial management.
- In January 2025, Birmingham Fastener and Anchor Bolt & Supply announced a partnership to enhance the supply of high-quality American-made fasteners in West Texas. This collaboration aims to improve customer service, inventory access, and customization options, particularly supporting the oil and gas, construction, and renewable energy sectors.
Report Coverage:
The research report offers an in-depth analysis based on type, product, material, application, and distribution channel. It details leading market players, providing an overview of their business, product offerings, investments, revenue streams, and key applications. Additionally, the report includes insights into the competitive environment, SWOT analysis, current market trends, as well as the primary drivers and constraints. Furthermore, it discusses various factors that have driven market expansion in recent years. The report also explores market dynamics, regulatory scenarios, and technological advancements that are shaping the industry. It assesses the impact of external factors and global economic changes on market growth. Lastly, it provides strategic recommendations for new entrants and established companies to navigate the complexities of the market.
Future Outlook:
- Rising adoption of lightweight fasteners in automotive and aerospace will create growth opportunities.
- Increased demand from infrastructure and construction projects will expand market potential.
- Growth in e-commerce platforms will streamline distribution and enhance customer access.
- Innovation in coatings and corrosion-resistant materials will extend product life cycles.
- Sustainability and recyclable materials will gain prominence in product development.
- Technological integration will boost the adoption of smart and sensor-enabled fasteners.
- Emerging economies will drive industrialization and fastener consumption across industries.
- Custom-engineered solutions will dominate niche applications in defense and electronics.
- Strategic mergers and acquisitions will shape competitive positioning in the market.
- Regulatory compliance and quality standards will influence product adoption globally.


