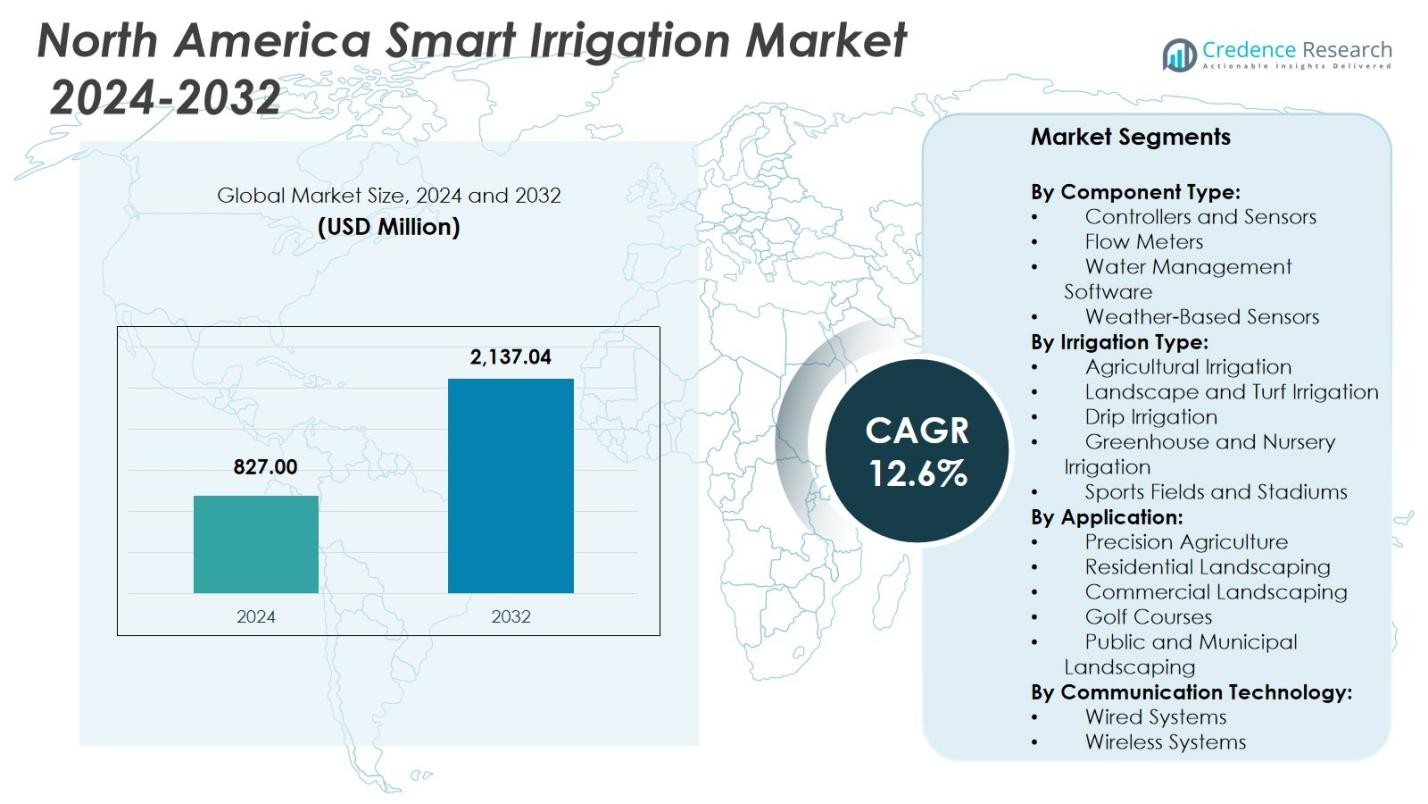
Home » Agriculture » North America Smart Irrigation Market

North America Smart Irrigation Market By Component Type (Controllers and Sensors, Flow Meters, Water Management Software, Weather-Based Sensors) By Irrigation Type (Agricultural Irrigation, Landscape and Turf Irrigation, Drip Irrigation, Greenhouse and Nursery Irrigation, Sports Fields and Stadiums) By Application (Precision Agriculture, Residential Landscaping, Commercial Landscaping, Golf Courses, Public and Municipal Landscaping) By Communication Technology (Wired Systems, Wireless Systems) By End Users (Farmers and Agricultural Producers, Landscapers and Groundskeepers, Residential Users, Golf Course Managers, Local Governments By Water Source (Potable Water, Non-Potable Water) – Growth, Future Prospects & Competitive Analysis, 2022 – 2030

Report ID: 30447 | Report Format : Excel, PDF

Market Insights

  • The South Africa Prefilled Syringes  demand for North America Smart Irrigation Market  was valued at USD 354.8 Million in 2022 and is expected to reach USD 1179.3 Million in 2030, growing at a CAGR of 16.20% between 2023 and 2030.
  • The controller category accounts for the majority of market share, and the weather-based sensor market is predicted to grow at the fastest CAGR.
  • The smart irrigation industry’s landscape and grass irrigation segment is quickly developing, and agricultural irrigation is another key market area.
  • Precision agriculture generates market demand, and commercial landscaping is another important component of the smart irrigation business.
  • Another important aspect of the smart irrigation sector is wireless irrigation systems.
  • Farmers and agricultural producers are the smart irrigation sector’s fastest growing segment, while residential users are the smart irrigation market’s second largest segment.
  • Potable water is the most significant component, but non-potable water is also an important component in the smart irrigation business.
  • The convergence of multiple control features, as well as the introduction of IoT, are pushing the South Africa Prefilled Syringes
  • Implementation of smart irrigation technology on fragmented land impedes industry expansion.

North America Smart Irrigation Market

Access crucial information at unmatched prices!

Request your sample report today & start making informed decisions powered by Credence Research Inc.!

Download Sample

 Executive Summary

Market Definition

Smart irrigation systems are a vital component of precision agriculture because they integrate innovative technology. These help to change the watering schedule automatically by monitoring weather, soil conditions, and plant water use. These systems are employed in agriculture, golf courses, and private residences. Smart irrigation solutions, like traditional irrigation technologies, use a pre-programmed schedule and timers. Controllers and sensors are the building blocks of smart irrigation solutions. There are two sorts of controllers: climate-based controllers and soil moisture controllers. Soil moisture, rain freeze, and wind sensors are examples of sensors. One of the advantages of smart irrigation technology is that it reduces water waste while still delivering a healthy and appealing landscape.

Market Overview

It is anticipated that between 2023 and 2030, the North America Smart Irrigation Market will expand at a compound annual growth rate (CAGR) of 16.20%. From USD 354.8 million in 2022, the market is projected to be worth USD 1179.3 million by 2030.

The North America smart irrigation industry is expanding rapidly as a result of the growing demand for effective water management in agriculture and landscaping applications. Smart irrigation systems are increasingly being used to optimize water use, eliminate water waste, and increase agricultural output. Factors such as rising awareness about water conservation, government initiatives supporting sustainable irrigation methods, and technological improvements are driving the market. The presence of important manufacturers offering a diverse variety of smart irrigation solutions, such as sensors, controllers, and software platforms, distinguishes the market.

Segmentation by Component Type

  • The controller segment holds the most market share and is expected to increase at a CAGR of 13.3% during the projected period. Because these devices are necessary for efficient water management and conservation. They aid in the optimization of irrigation techniques by taking into consideration variables like as weather, soil moisture levels, and plant water requirements.
  • The weather-based sensor market is expected to develop at the quickest CAGR.

  Segmentation by Irrigation Type

  • The landscape and turf irrigation segment of the smart irrigation industry is rapidly expanding. This part is dedicated to offering effective irrigation solutions for lawns, gardens, and other outdoor landscapes. With the growing need for water conservation and environmental practices, smart irrigation systems are becoming more popular in this market.
  • Agricultural Irrigation segment is the another important segment in the market.

Segmentation By Application

  • Precision agriculture is the segment that drives market demand. Precision agriculture is the application of new technology to improve irrigation methods in farming and agricultural operations. Precision agriculture, which employs sensors, data analytics, and automation, assists farmers in making educated irrigation decisions, resulting in increased crop output and water efficiency.
  • Commercial landscaping is another key component of the smart irrigation industry. This market serves the irrigation requirements of commercial assets including as office buildings, retail malls, and hotels.

Segmentation by Communication Technology

  • Wireless irrigation systems are key area of the smart irrigation industry. These systems link and regulate irrigation units via wireless communication technology, enabling flexibility and ease. Wireless systems do not require substantial wire installations, making them simpler to install and operate. They provide remote access and control by allowing customers to monitor and alter irrigation settings from any location via a smartphone app or online interface. Because of its scalability, convenience of use, and ability to interface with other smart devices and technologies, wireless systems are gaining popularity.

Segmentation by Technology

  • Farmers and agricultural producers have the highest growth rate in the smart irrigation sector. More farmers are using smart irrigation systems to enhance their irrigation operations and increase crop output as the need for effective water management and sustainable farming practices grows.
  • Residential users are the smart irrigation market’s second largest sector. Homeowners and property owners are realizing the value of smart irrigation systems in keeping attractive landscapes while conserving water. These systems are popular among home users because they provide handy features like as automatic scheduling and weather-based watering.

Segmentation by End-Users

  • Potable water is the most important part. Water that is fit for human consumption is referred to as potable water. Smart irrigation systems that use potable water are often employed in residential areas, business sites, and public locations where water quality is a concern. These technologies guarantee that the irrigation water is pure and acceptable for a variety of uses.
  • Non-potable water is another major area in the smart irrigation industry.

Key Highlights of the Report

The South Africa Prefilled Syringes  North America Smart Irrigation Market is segmented by Component Type , Irrigation Type s, Application, Communication Technology, Technology, End-Users and region. The controller segment dominates the market. In addition, farmers and agricultural producers have the largest growth rate in the smart irrigation industry, and precision agriculture is the market demand driver. Also, potable water is the most vital component.

The key market drivers include rising demand for better water management and conservation strategies, government initiatives and regulations supporting sustainable irrigation solutions, and technical breakthroughs such as IoT and data analytics that improve irrigation efficiency. In addition, the installation and maintenance costs for smart irrigation systems are significant. The benefits of smart irrigation are poorly known and understood by end users. Interoperability and integration concerns with multiple smart irrigation components are the key market limits.

What Elements Are Driving the South Africa Prefilled Syringes  Market for North America Smart Irrigation Market ?

The growing demand for effective water management and conservation methods is driving the North American smart irrigation industry. With rising worries about water scarcity and environmental sustainability, there is a high need for smart irrigation systems that can maximize water utilization while reducing waste. Furthermore, government initiatives and legislation supporting sustainable irrigation solutions are moving the industry forward. These projects promote the use of smart irrigation technologies, which leads to increased crop productivity and water saving. Furthermore, technological innovations such as the Internet of Things (IoT) and data analytics are increasing the efficiency of irrigation systems, propelling market expansion.

What Are The Main Obstacles That The South Africa Prefilled Syringes  Smart Irrigation MarketFaces?

The high initial installation and maintenance costs of smart irrigation systems are one of the major challenges. These expenses can be prohibitive for some end users, particularly small farms and landscaping enterprises. Another impediment is potential consumers’ lack of awareness and understanding of the benefits of smart irrigation. Educating and raising awareness about the benefits of these technologies will be critical for market expansion. Furthermore, there are issues with interoperability and integration of various smart irrigation components, which can impede smooth operation and adoption.

What Market Development Prospects Are There For North America Smart Irrigation Market  South Africa Prefilled Syringes?

The growing need for precision agriculture and smart farming techniques creates new opportunities for smart irrigation technologies. Precision agriculture enables farmers to reduce environmental impact while optimizing water usage and crop yield. Furthermore, market participants have a great chance to extend smart irrigation systems in the residential and commercial landscaping sectors. Demand for smart irrigation systems in these areas is likely to expand as more individuals and businesses prioritize sustainable and effective water management. Furthermore, market participants have the potential to develop creative and cost-effective smart irrigation technologies, making them more accessible to a broader variety of consumers.

Market Drivers

The South Africa Prefilled Syringes  Smart Irrigation Marketis driven by several factors. The following are the key drivers of the South Africa Prefilled Syringes  North America Smart Irrigation Market :

Convergence Of Various Control Functionalities And The Emergence Of IoT

Controls, sensors, and water flow meters comprise a smart irrigation system. They allow farmers and other end-users to reach, track, and control any inch of land, regardless of size, which may make farming and other end-uses easier. Smart irrigation systems, on the other hand, have enormous potential for automating the entire irrigation system and increasing production through regulated land environmental parameters such as moisture, temperature, and humidity. This automation is possible through the use of controllers, sensors, and other water-saving irrigation system replacement components. The implementation of IoT technology in agricultural and related industries, as well as the convergence of different control duties, are expected to fuel the growth of the South Africa Prefilled Syringes  smart irrigation market.

Market Restraints

The South Africa Prefilled Syringes  North America Smart Irrigation Market faces some challenges that may hinder its growth. These include the following:

Smart Irrigation Technology Implementation On Fragmented Land

Smart irrigation is a capital-intensive Internet of Things (IoT)-based irrigation technology that includes irrigation controllers, sensors, flow meters, and networking devices.

For instance, in India, 85% of agricultural households possess less than 2 hectares of land. Due to the high expenses and low return on investment, the installation of smart irrigation market technologies is not practical in such farms. The incorrect distribution of resources and inputs brought about by land fragmentation further raises the cost of production. It reduces the amount of agricultural output and the amount of accessible economic opportunities. When smart irrigation technologies are implemented on dispersed land, time, money, and resources are wasted because it is challenging to manage, oversee, and gather data from the dispersed area. This also raises the cost of irrigation, drainage, communication, etc. and makes it harder for farmers to achieve economies of scale for intelligent irrigation systems.

Opportunities

The South Africa Prefilled Syringes  North America Smart Irrigation Market offers significant growth opportunities. These include the following:

Constant Advancement Of Communication Technologies

A critical role is played by the networks or communication technologies integrated into smart irrigation systems to monitor and regulate the machine and increase irrigation efficiency. End-users may correctly schedule watering of their fields or landscapes depending on plant requirements and environmental circumstances by monitoring the soil moisture and meteorological data acquired by sensing technology. As a result, well-established network systems with greater dependability can help achieve the goals for which the intelligent irrigation system was designed and built.

Additionally, problems like network protection from cyber threats, remote metering and leak detection, data integration, and advanced analytics can be resolved by ongoing research and development (R&D) in technologies like the Internet of Things (IoT), artificial intelligence (AI), computer vision, automation, etc. Therefore, as communication technologies continue to progress, companies in the South Africa Prefilled Syringes  smart irrigation market should be able to grow their operations throughout the forecast period.

Competitive Landscape

North America Smart Irrigation Market Research

Access crucial information at unmatched prices!

Request your sample report today & start making informed decisions powered by Credence Research Inc.!

Download Sample

Key Players

The South Africa Prefilled Syringes  Smart Irrigation Market is highly competitive, with several key players. Some of the major players in the market and their market share are as follows:

  • Orbit Irrigation Products LLC.
  • HydroPoint
  • The Toro Company
  • Rain Bird Corporation
  • Rachio inc.
  • NETAFIM
  • Galcon
  • Weathermatic
  • HUNTER INDUSTRIES
  • Banyan Water, Inc.
  • Stevens Water Monitoring Systems Inc.
  • Valmont Industries, Inc.
  • The Scotts Company LLC.
  • AquaSpy
  • Soil Scout Oy
  • Jain Irrigation, Inc.
  • CALSENSE
  • Acclima, Inc.
  • Caipos GmbH
  • Delta-T Devices Ltd
  • WaterForce
  • RainMachine – Green Electronics LLC
  • Skydrop, LLC
  • Lindsay Corporation
  • Wiseconn Engineering
  • Nelson Irrigation
  • Hortau among others.

These organizations prioritize product innovation, Disease Area expansion, and mergers and acquisitions to stay competitive.

The South Africa Prefilled Syringes  North America Smart Irrigation Market ‘s key players continually seek to stay ahead by offering new Component Type s and developments.

In July 2020, NETAFIM has joined forces with Sentek’s Industry. The main goal of this collaboration was to improve NETAFIM’s digital farming capabilities, as Sentek’s Industry is well-known for its soil sensor technology. This collaboration aids in the development of products with end-to-end cloud-based automation capabilities, as well as the provision of control solutions. This collaboration benefited both companies by allowing them to extend their markets.

In April 2022, Viridix unveiled a next-generation precision irrigation system with autonomous capabilities based on Al.

In March 2020, Netbeat, Netafim’s digital irrigation management platform, and FluroSat (Australia) have formed a cooperation to include FluroSat’s remote sensing technology.

Summary of Key Findings

  • The ongoing progress of communication technology generates great opportunity.
  • Market segmented by Component Type , Irrigation Type, Application, Communication Technology, End-Users, Water Source and region
  • The smart irrigation industry’s landscape and grass irrigation segment is quickly developing
  • Potable water is the most significant component
  • The market is highly competitive with key players including Orbit Irrigation Products LLC., HydroPoint, The Toro Company, Rain Bird Corporation, Rachio inc., NETAFIM, Galcon, Weathermatic, HUNTER INDUSTRIES

Future Outlook

  • Increasing adoption of IoT and cloud-based technologies
  • Growing focus on water conservation and sustainability
  • Rising demand for precision agriculture practices
  • Integration of advanced sensors and data analytics
  • Government initiatives promoting smart irrigation solutions
  • Expansion of smart irrigation in residential landscaping
  • Emergence of wireless communication technologies
  • Technological advancements in irrigation system components
  • Increasing investment in research and development
  • Collaborations and partnerships among industry players

Segmentation

By Component Type:

  • Controllers and Sensors
  • Flow Meters
  • Water Management Software
  • Weather-Based Sensors

By Irrigation Type:

  • Agricultural Irrigation
  • Landscape and Turf Irrigation
  • Drip Irrigation
  • Greenhouse and Nursery Irrigation
  • Sports Fields and Stadiums

By Application:

  • Precision Agriculture
  • Residential Landscaping
  • Commercial Landscaping
  • Golf Courses
  • Public and Municipal Landscaping

By Communication Technology:

  • Wired Systems
  • Wireless Systems

By End Users:

  • Farmers and Agricultural Producers
  • Landscapers and Groundskeepers
  • Residential Users
  • Golf Course Managers
  • Local Governments

By Water Source:

  • Potable Water
  • Non-Potable Water

Table of Content
1. Preface
1.1. Report Description
1.1.1. Purpose of the Report
1.1.2. Target Audience
1.1.3. USP and Key Offerings
1.2. Research Scope
1.3. Market Introduction
2. Executive Summary
2.1. Market Snapshot: North America Smart Irrigation Market
2.1.1. North America Smart Irrigation Market, By Component Type
2.1.2. North America Smart Irrigation Market, By Irrigation Type
2.1.3. North America Smart Irrigation Market, By Application
2.1.4. North America Smart Irrigation Market, By Communication Technology
2.1.5. North America Smart Irrigation Market, By End-Users
2.1.6. North America Smart Irrigation Market, By Water Source
2.1.7. North America Smart Irrigation Market, By Region
2.2. Insights from Primary Respondents
3. Market Dynamics & Factors Analysis
3.1. Introduction
3.1.1. North America Smart Irrigation Market Value, 2017-2030, (US$ Mn)
3.1.2. Y-o-Y Growth Trend Analysis
3.2. Market Dynamics
3.2.1. North America Smart Irrigation Market Drivers
3.2.2. North America Smart Irrigation Market Restraints
3.2.3. North America Smart Irrigation Market Opportunities
3.2.4. Major Smart Irrigation Industry Challenges
3.3. Growth and Development Patterns
3.4. Investment Feasibility Analysis
3.5. Market Opportunity Analysis
3.5.1. Component Type
3.5.2. Irrigation Type
3.5.3. Application
3.5.4. Communication Technology
3.5.5. End-Users
3.5.6. Water Source
3.5.7. Geography
4. Market Competitive Landscape Analysis
4.1. Company Market Share Analysis, 2022
4.1.1. North America Smart Irrigation Market: Company Market Share, Value 2022
4.1.2. North America Smart Irrigation Market: Top 6 Company Market Share, Value 2022
4.1.3. North America Smart Irrigation Market: Top 3 Company Market Share, Value 2022
4.2. North America Smart Irrigation Market: Company Revenue Share Analysis, 2022
4.3. Company Assessment Metrics, 2022
4.3.1. Stars
4.3.2. Emerging Leaders
4.3.3. Pervasive Players
4.3.4. Participants
4.4. Startups/ SMEs Assessment Metrics, 2022
4.4.1. Progressive Companies
4.4.2. Responsive Companies
4.4.3. Dynamic Companies
4.4.4. Starting Blocks
4.5. Strategic Development
4.5.1. Acquisition and Mergers
4.5.2. New Product Launch
4.5.3. Regional Expansion
4.5.4. Partnerships
4.6. Key Player Product Matrix
4.7. Potential for New Players in the North America Smart Irrigation Market
5. Premium Insights
5.1. STAR (Situation, Task, Action, Results) Analysis
5.2. Porter’s Five Forces Analysis
5.2.1. Threat of New Entrants
5.2.2. Bargaining Power of Buyers/Consumers
5.2.3. Bargaining Power of Suppliers
5.2.4. Threat of Substitute Component Types
5.2.5. Intensity of Competitive Rivalry
5.3. PESTEL Analysis
5.3.1. Political Factors
5.3.2. Economic Factors
5.3.3. Social Factors
5.3.4. Technological Factors
5.3.5. Environmental Factors
5.3.6. Legal Factors
5.4. Key Market Trends
5.4.1. Demand Side Trends
5.4.2. Supply Side Trends
5.5. Value Chain Analysis
5.6. Technology Analysis
5.6.1. Research and development in the market
5.6.2. Patent Analysis
5.6.3. Emerging technologies and their potential disruption to the market
5.7. Consumer Behaviour Analysis
5.7.1. Consumer Preferences and Expectations
5.7.2. Factors Influencing Consumer Buying Decisions
5.7.3. Consumer Pain Points
5.8. Analysis and Recommendations
5.9. Adjacent Market Analysis
6. Market Positioning of Key Players, 2022
6.1. Company market share of key players, 2022
6.2. Competitive Benchmarking
6.3. Market Positioning of Key Vendors
6.4. Geographical Presence Analysis
6.5. Major Strategies Adopted by Key Players
6.5.1. Key Strategies Analysis
6.5.2. Mergers and Acquisitions
6.5.3. Partnerships
6.5.4. Product Launch
6.5.5. Geographical Expansion
6.5.6. Others
7. Impact Analysis of COVID 19 and Russia – Ukraine War on North America Smart Irrigation Market
7.1. Ukraine-Russia War Impact
7.1.1. Uncertainty and Economic Instability
7.1.2. Supply chain disruptions
7.1.3. Regional market shifts
7.1.4. Shift in government priorities
7.2. COVID-19 Impact Analysis
7.2.1. Supply Chain Disruptions
7.2.2. Demand Fluctuations
7.2.3. Shift in Product Mix
7.2.4. Reduced Industrial Activity
7.2.5. Regional Impact Analysis
8. North America Smart Irrigation Market, By Component Type
8.1. North America Smart Irrigation Market Overview, by Component Type
8.1.1. North America Smart Irrigation Market Revenue Share, By Component Type, 2022 Vs 2030 (in %)
8.2. Controllers and Sensors
8.2.1. North America Smart Irrigation Market, By CONTROLLERS AND SENSORS, By Region, 2017-2030 (US$ Mn)
8.2.2. Market Dynamics for CONTROLLERS AND SENSORS
8.2.2.1. Drivers
8.2.2.2. Restraints
8.2.2.3. Opportunities
8.2.2.4. Trends
8.3. Flow Meters
8.3.1. North America Smart Irrigation Market, By FLOW METERS, By Region, 2017-2030 (US$ Mn)
8.3.2. Market Dynamics for FLOW METERS
8.3.2.1. Drivers
8.3.2.2. Restraints
8.3.2.3. Opportunities
8.3.2.4. Trends
8.4. Water Management Software
8.4.1. North America Smart Irrigation Market, By Water Management Software, By Region, 2017-2030 (US$ Mn)
8.4.2. Market Dynamics for Water Management Software
8.4.2.1. Drivers
8.4.2.2. Restraints
8.4.2.3. Opportunities
8.4.2.4. Trends
8.5. Weather-Based Sensors
8.5.1. North America Smart Irrigation Market, By Weather-Based Sensors, By Region, 2017-2030 (US$ Mn)
8.5.2. Market Dynamics for Weather-Based Sensors
8.5.2.1. Drivers
8.5.2.2. Restraints
8.5.2.3. Opportunities
8.5.2.4. Trends
9. North America Smart Irrigation Market, By Irrigation Type
9.1. North America Smart Irrigation Market Overview, By Irrigation Type
9.1.1. North America Smart Irrigation Market Revenue Share, By Irrigation Type, 2022 Vs 2030 (in %)
9.2. Agricultural Irrigation
9.2.1. North America Smart Irrigation Market, By Agricultural Irrigation, By Region, 2017-2030 (US$ Mn)
9.2.2. Market Dynamics for Agricultural Irrigation
9.2.2.1. Drivers
9.2.2.2. Restraints
9.2.2.3. Opportunities
9.2.2.4. Trends
9.3. Landscape and Turf Irrigation
9.3.1. North America Smart Irrigation Market, By Landscape and Turf Irrigation, By Region, 2017-2030 (US$ Mn)
9.3.2. Market Dynamics for Landscape and Turf Irrigation
9.3.2.1. Drivers
9.3.2.2. Restraints
9.3.2.3. Opportunities
9.3.2.4. Trends
9.4. Drip Irrigation
9.4.1. North America Smart Irrigation Market, By Drip Irrigation, By Region, 2017-2030 (US$ Mn)
9.4.2. Market Dynamics for Drip Irrigation
9.4.2.1. Drivers
9.4.2.2. Restraints
9.4.2.3. Opportunities
9.4.2.4. Trends
9.5. Greenhouse and Nursery Irrigation
9.5.1. North America Smart Irrigation Market, By Greenhouse and Nursery Irrigation, By Region, 2017-2030 (US$ Mn)
9.5.2. Market Dynamics for Greenhouse and Nursery Irrigation
9.5.2.1. Drivers
9.5.2.2. Restraints
9.5.2.3. Opportunities
9.5.2.4. Trends
9.6. Sports Fields and Stadiums
9.6.1. North America Smart Irrigation Market, By Sports Fields and Stadiums, By Region, 2017-2030 (US$ Mn)
9.6.2. Market Dynamics for Sports Fields and Stadiums
9.6.2.1. Drivers
9.6.2.2. Restraints
9.6.2.3. Opportunities
9.6.2.4. Trends
10. North America Smart Irrigation Market, By Application
10.1. North America Smart Irrigation Market Overview, by Application
10.1.1. North America Smart Irrigation Market Revenue Share, By Application, 2022 Vs 2030 (in %)
10.2. Precision Agriculture
10.2.1. North America Smart Irrigation Market, By Precision Agriculture, By Region, 2017-2030 (US$ Mn)
10.2.2. Market Dynamics for Precision Agriculture
10.2.2.1. Drivers
10.2.2.2. Restraints
10.2.2.3. Opportunities
10.2.2.4. Trends
10.3. Residential Landscaping
10.3.1. North America Smart Irrigation Market, By Residential Landscaping, By Region, 2017-2030 (US$ Mn)
10.3.2. Market Dynamics for Residential Landscaping
10.3.2.1. Drivers
10.3.2.2. Restraints
10.3.2.3. Opportunities
10.3.2.4. Trends
10.4. Commercial Landscaping
10.4.1. North America Smart Irrigation Market, By Commercial Landscaping, By Region, 2017-2030 (US$ Mn)
10.4.2. Market Dynamics for Commercial Landscaping
10.4.2.1. Drivers
10.4.2.2. Restraints
10.4.2.3. Opportunities
10.4.2.4. Trends
10.5. Golf Courses
10.5.1. North America Smart Irrigation Market, By Golf Courses, By Region, 2017-2030 (US$ Mn)
10.5.2. Market Dynamics for Golf Courses
10.5.2.1. Drivers
10.5.2.2. Restraints
10.5.2.3. Opportunities
10.5.2.4. Trends
10.6. Public and Municipal Landscaping
10.6.1. North America Smart Irrigation Market, By Public and Municipal Landscaping, By Region, 2017-2030 (US$ Mn)
10.6.2. Market Dynamics for Public and Municipal Landscaping
10.6.2.1. Drivers
10.6.2.2. Restraints
10.6.2.3. Opportunities
10.6.2.4. Trends
11. North America Smart Irrigation Market, By Communication Technology
11.1. North America Smart Irrigation Market Overview, by Communication Technology
11.1.1. North America Smart Irrigation Market Revenue Share, By Communication Technology, 2022 Vs 2030 (in %)
11.2. Wired Systems
11.2.1. North America Smart Irrigation Market, By Wired Systems, By Region, 2017-2030 (US$ Mn)
11.2.2. Market Dynamics for Wired Systems
11.2.2.1. Drivers
11.2.2.2. Restraints
11.2.2.3. Opportunities
11.2.2.4. Trends
11.3. Wireless Systems
11.3.1. North America Smart Irrigation Market, By Wireless Systems, By Region, 2017-2030 (US$ Mn)
11.3.2. Market Dynamics for Wireless Systems
11.3.2.1. Drivers
11.3.2.2. Restraints
11.3.2.3. Opportunities
11.3.2.4. Trends
12. North America Smart Irrigation Market, By End-Users
12.1. North America Smart Irrigation Market Overview, By End-Users
12.1.1. North America Smart Irrigation Market Revenue Share, By End-Users, 2022 Vs 2030 (in %)
12.2. Farmers and Agricultural Producers
12.2.1. North America Smart Irrigation Market, By Farmers and Agricultural Producers, By Region, 2017-2030 (US$ Mn)
12.2.2. Market Dynamics for Farmers and Agricultural Producers
12.2.2.1. Drivers
12.2.2.2. Restraints
12.2.2.3. Opportunities
12.2.2.4. Trends
12.3. Landscapers and Groundskeepers
12.3.1. North America Smart Irrigation Market, By Landscapers and Groundskeepers, By Region, 2017-2030 (US$ Mn)
12.3.2. Market Dynamics for Landscapers and Groundskeepers
12.3.2.1. Drivers
12.3.2.2. Restraints
12.3.2.3. Opportunities
12.3.2.4. Trends
12.4. Residential Users
12.4.1. North America Smart Irrigation Market, By Residential Users, By Region, 2017-2030 (US$ Mn)
12.4.2. Market Dynamics for Residential Users
12.4.2.1. Drivers
12.4.2.2. Restraints
12.4.2.3. Opportunities
12.4.2.4. Trends
12.5. Golf Course Managers
12.5.1. North America Smart Irrigation Market, By Golf Course Managers, By Region, 2017-2030 (US$ Mn)
12.5.2. Market Dynamics for Golf Course Managers
12.5.2.1. Drivers
12.5.2.2. Restraints
12.5.2.3. Opportunities
12.5.2.4. Trends
12.6. Local Governments
12.6.1. North America Smart Irrigation Market, By Local Governments, By Region, 2017-2030 (US$ Mn)
12.6.2. Market Dynamics for Local Governments
12.6.2.1. Drivers
12.6.2.2. Restraints
12.6.2.3. Opportunities
12.6.2.4. Trends
13. North America Smart Irrigation Market, By Water Source
13.1. North America Smart Irrigation Market Overview, by Water Source
13.1.1. North America Smart Irrigation Market Revenue Share, By Water Source, 2022 Vs 2030 (in %)
13.2. Potable Water
13.2.1. North America Smart Irrigation Market, By Potable Water, By Region, 2017-2030 (US$ Mn)
13.2.2. Market Dynamics for Potable Water
13.2.2.1. Drivers
13.2.2.2. Restraints
13.2.2.3. Opportunities
13.2.2.4. Trends
13.3. Non-Potable Water
13.3.1. North America Smart Irrigation Market, By Non-Potable Water, By Region, 2017-2030 (US$ Mn)
13.3.2. Market Dynamics for Non-Potable Water
13.3.2.1. Drivers
13.3.2.2. Restraints
13.3.2.3. Opportunities
13.3.2.4. Trends
14. North America Smart Irrigation Market, By Region
14.1. North America Smart Irrigation Market Overview, by Region
14.1.1. North America Smart Irrigation Market, By Region, 2022 vs 2030 (in%)
14.2. Component Type
14.2.1. North America Smart Irrigation Market, By Component Type, 2017-2030 (US$ Mn)
14.3. Irrigation Type
14.3.1. North America Smart Irrigation Market, By Irrigation Type, 2017-2030 (US$ Mn)
14.4. Application
14.4.1. North America Smart Irrigation Market, By Application, 2017-2030 (US$ Mn)
14.5. Communication Technology
14.5.1. North America Smart Irrigation Market, By Communication Technology, 2017-2030 (US$ Mn)
14.6. End-Users
14.6.1. North America Smart Irrigation Market, By End-Users, 2017-2030 (US$ Mn)
14.7. Water Source
14.7.1. North America Smart Irrigation Market, By Water Source, 2017-2030 (US$ Mn)
14.8. North America Smart Irrigation Market, by Country, 2017-2030(US$ Mn)
14.8.1. North America Smart Irrigation Market, by Country, 2022 Vs 2030 (in%)
14.8.2. U.S.
14.8.3. Canada
14.8.4. Mexico
15. Company Profiles
15.1. Orbit Irrigation Products LLC.
15.1.1. Company Overview
15.1.2. Products/Services Portfolio
15.1.3. Geographical Presence
15.1.4. SWOT Analysis
15.1.5. Financial Summary
15.1.5.1. Market Revenue and Net Profit (2019-2022)
15.1.5.2. Business Segment Revenue Analysis
15.1.5.3. Geographical Revenue Analysis
15.2. HydroPoint
15.3. The Toro Company
15.4. Rain Bird Corporation
15.5. Rachio inc.
15.6. NETAFIM
15.7. Galcon
15.8. Weathermatic
15.9. HUNTER INDUSTRIES
15.10. Banyan Water, Inc.
15.11. Stevens Water Monitoring Systems Inc.
15.12. Valmont Industries, Inc.
15.13. The Scotts Company LLC.
15.14. AquaSpy
15.15. Soil Scout Oy
15.16. Jain Irrigation, Inc.
15.17. CALSENSE
15.18. Acclima, Inc.
15.19. Caipos GmbH
15.20. Delta-T Devices Ltd
15.21. WaterForce
15.22. RainMachine – Green Electronics LLC
15.23. Skydrop, LLC
15.24. Lindsay Corporation
15.25. Wiseconn Engineering
15.26. Nelson Irrigation
15.27. Hortau among others
16. Research Methodology
16.1. Research Methodology
16.2. Phase I – Secondary Research
16.3. Phase II – Data Modelling
16.3.1. Company Share Analysis Model
16.3.2. Revenue Based Modelling
16.4. Phase III – Primary Research
16.5. Research Limitations
16.5.1. Assumptions

List of Figures
FIG. 1 North America Smart Irrigation Market: Research Methodology
FIG. 2 Market Size Estimation – Top Down & Bottom up Approach
FIG. 3 North America Smart Irrigation Market Segmentation
FIG. 4 North America Smart Irrigation Market, by Component Type, 2022 (US$ Mn)
FIG. 5 North America Smart Irrigation Market, By Irrigation Type, 2022 (US$ Mn)
FIG. 6 North America Smart Irrigation Market, by Application, 2022 (US$ Mn)
FIG. 7 North America Smart Irrigation Market, by Data Trasnfer Speed, 2022 (US$ Mn)
FIG. 8 North America Smart Irrigation Market, By End-Users, 2022 (US$ Mn)
FIG. 9 North America Smart Irrigation Market, by Water Source, 2022 (US$ Mn)
FIG. 10 North America Smart Irrigation Market, by Geography, 2022 (US$ Mn)
FIG. 11 Attractive Investment Proposition, by Component Type, 2022
FIG. 12 Attractive Investment Proposition, By Irrigation Type, 2022
FIG. 13 Attractive Investment Proposition, by Application, 2022
FIG. 14 Attractive Investment Proposition, by Communication Technology, 2022
FIG. 15 Attractive Investment Proposition, By End-Users, 2022
FIG. 16 Attractive Investment Proposition, by Water Source, 2022
FIG. 17 Attractive Investment Proposition, by Geography, 2022
FIG. 18 Market Share Analysis of Key North America Smart Irrigation Market Manufacturers, 2022
FIG. 19 Market Positioning of Key North America Smart Irrigation Market Manufacturers, 2022
FIG. 20 North America Smart Irrigation Market Value Contribution, By Component Type, 2022 & 2030 (Value %)
FIG. 21 North America Smart Irrigation Market, by CONTROLLERS AND SENSORS, Value, 2017-2030 (US$ Mn)
FIG. 22 North America Smart Irrigation Market, by FLOW METERS, Value, 2017-2030 (US$ Mn)
FIG. 23 North America Smart Irrigation Market, by Water Management Software, Value, 2017-2030 (US$ Mn)
FIG. 24 North America Smart Irrigation Market, by Weather-Based Sensors, Value, 2017-2030 (US$ Mn)
FIG. 25 North America Smart Irrigation Market Value Contribution, By Irrigation Type, 2022 & 2030 (Value %)
FIG. 26 North America Smart Irrigation Market, by Agricultural Irrigation, Value, 2017-2030 (US$ Mn)
FIG. 27 North America Smart Irrigation Market, by Landscape and Turf Irrigation, Value, 2017-2030 (US$ Mn)
FIG. 28 North America Smart Irrigation Market, by Drip Irrigation, Value, 2017-2030 (US$ Mn)
FIG. 29 North America Smart Irrigation Market, by Greenhouse and Nursery Irrigation, Value, 2017-2030 (US$ Mn)
FIG. 30 North America Smart Irrigation Market, by Sports Fields and Stadiums, Value, 2017-2030 (US$ Mn)
FIG. 31 North America Smart Irrigation Market Value Contribution, By Application, 2022 & 2030 (Value %)
FIG. 32 North America Smart Irrigation Market, by Precision Agriculture, Value, 2017-2030 (US$ Mn)
FIG. 33 North America Smart Irrigation Market, by Residential Landscaping, Value, 2017-2030 (US$ Mn)
FIG. 34 North America Smart Irrigation Market, by Commercial Landscaping, Value, 2017-2030 (US$ Mn)
FIG. 35 North America Smart Irrigation Market, by Golf Courses, Value, 2017-2030 (US$ Mn)
FIG. 36 North America Smart Irrigation Market, by Public and Municipal Landscaping, Value, 2017-2030 (US$ Mn)
FIG. 37 North America Smart Irrigation Market Value Contribution, By Communication Technology, 2022 & 2030 (Value %)
FIG. 38 North America Smart Irrigation Market, by Wired Systems, Value, 2017-2030 (US$ Mn)
FIG. 39 North America Smart Irrigation Market, by Wireless Systems, Value, 2017-2030 (US$ Mn)
FIG. 40 North America Smart Irrigation Market Value Contribution, By End-Users, 2022 & 2030 (Value %)
FIG. 41 North America Smart Irrigation Market, by Farmers and Agricultural Producers, Value, 2017-2030 (US$ Mn)
FIG. 42 North America Smart Irrigation Market, by Landscapers and Groundskeepers, Value, 2017-2030 (US$ Mn)
FIG. 43 North America Smart Irrigation Market, by Residential Users, Value, 2017-2030 (US$ Mn)
FIG. 44 North America Smart Irrigation Market, by Golf Course Managers, Value, 2017-2030 (US$ Mn)
FIG. 45 North America Smart Irrigation Market, by Local Governments, Value, 2017-2030 (US$ Mn)
FIG. 46 North America Smart Irrigation Market Value Contribution, By Water Source, 2022 & 2030 (Value %)
FIG. 47 North America Smart Irrigation Market, by Potable Water, Value, 2017-2030 (US$ Mn)
FIG. 48 North America Smart Irrigation Market, by Non-Potable Water, Value, 2017-2030 (US$ Mn)
FIG. 49 U.S. Smart Irrigation Market, 2017-2030 (US$ Mn)
FIG. 50 Canada Smart Irrigation Market, 2017-2030 (US$ Mn)
FIG. 51 Mexico Smart Irrigation Market, 2017-2030 (US$ Mn)

List of Tables
TABLE 1 Market Snapshot: North America Smart Irrigation Market
TABLE 2 North America Smart Irrigation Market: Market Drivers Impact Analysis
TABLE 3 North America Smart Irrigation Market: Market Restraints Impact Analysis
TABLE 4 North America Smart Irrigation Market, by Competitive Benchmarking, 2022
TABLE 5 North America Smart Irrigation Market, by Geographical Presence Analysis, 2022
TABLE 6 North America Smart Irrigation Market, by Key Strategies Analysis, 2022
TABLE 7 North America Smart Irrigation Market, by Controllers and Sensors, By Region, 2017-2022 (US$ Mn)
TABLE 8 North America Smart Irrigation Market, by Controllers and Sensors, By Region, 2023-2030 (US$ Mn)
TABLE 9 North America Smart Irrigation Market, by Flow Meters, By Region, 2017-2022 (US$ Mn)
TABLE 10 North America Smart Irrigation Market, by Flow Meters, By Region, 2023-2030 (US$ Mn)
TABLE 11 North America Smart Irrigation Market, by Water Management Software, By Region, 2017-2022 (US$ Mn)
TABLE 12 North America Smart Irrigation Market, by Water Management Software, By Region, 2023-2030 (US$ Mn)
TABLE 13 North America Smart Irrigation Market, by Weather-Based Sensors, By Region, 2017-2022 (US$ Mn)
TABLE 14 North America Smart Irrigation Market, by Weather-Based Sensors, By Region, 2023-2030 (US$ Mn)
TABLE 15 North America Smart Irrigation Market, by Agricultural Irrigation, By Region, 2017-2022 (US$ Mn)
TABLE 16 North America Smart Irrigation Market, by Agricultural Irrigation, By Region, 2023-2030 (US$ Mn)
TABLE 17 North America Smart Irrigation Market, by Landscape and Turf Irrigation, By Region, 2017-2022 (US$ Mn)
TABLE 18 North America Smart Irrigation Market, by Landscape and Turf Irrigation, By Region, 2023-2030 (US$ Mn)
TABLE 19 North America Smart Irrigation Market, by La Drip Irrigation, By Region, 2017-2022 (US$ Mn)
TABLE 20 North America Smart Irrigation Market, by Drip Irrigation, By Region, 2023-2030 (US$ Mn)
TABLE 21 North America Smart Irrigation Market, by Greenhouse and Nursery Irrigation, By Region, 2017-2022 (US$ Mn)
TABLE 22 North America Smart Irrigation Market, by Greenhouse and Nursery Irrigation, By Region, 2023-2030 (US$ Mn)
TABLE 23 North America Smart Irrigation Market, by Sports Fields and Stadiums, By Region, 2017-2022 (US$ Mn)
TABLE 24 North America Smart Irrigation Market, by Sports Fields and Stadiums, By Region, 2023-2030 (US$ Mn)
TABLE 25 North America Smart Irrigation Market, by Precision Agriculture, By Region, 2017-2022 (US$ Mn)
TABLE 26 North America Smart Irrigation Market, by Precision Agriculture, By Region, 2023-2030 (US$ Mn)
TABLE 27 North America Smart Irrigation Market, by Residential Landscaping, By Region, 2017-2022 (US$ Mn)
TABLE 28 North America Smart Irrigation Market, by Residential Landscaping, By Region, 2023-2030 (US$ Mn)
TABLE 29 North America Smart Irrigation Market, by Commercial Landscaping, By Region, 2017-2022 (US$ Mn)
TABLE 30 North America Smart Irrigation Market, by Commercial Landscaping, By Region, 2023-2030 (US$ Mn)
TABLE 31 North America Smart Irrigation Market, by Golf Courses, By Region, 2017-2022 (US$ Mn)
TABLE 32 North America Smart Irrigation Market, by Golf Courses, By Region, 2023-2030 (US$ Mn)
TABLE 33 North America Smart Irrigation Market, by Public and Municipal Landscaping, By Region, 2017-2022 (US$ Mn)
TABLE 34 North America Smart Irrigation Market, by Public and Municipal Landscaping, By Region, 2023-2030 (US$ Mn)
TABLE 35 North America Smart Irrigation Market, by Wired Systems, By Region, 2017-2022 (US$ Mn)
TABLE 36 North America Smart Irrigation Market, by Wired Systems, By Region, 2023-2030 (US$ Mn)
TABLE 37 North America Smart Irrigation Market, by Wireless Systems, By Region, 2017-2022 (US$ Mn)
TABLE 38 North America Smart Irrigation Market, by Wireless Systems, By Region, 2023-2030 (US$ Mn)
TABLE 39 North America Smart Irrigation Market, by Farmers and Agricultural Producers, By Region, 2023-2030 (US$ Mn)
TABLE 40 North America Smart Irrigation Market, by Farmers and Agricultural Producers, By Region, 2017-2022 (US$ Mn)
TABLE 41 North America Smart Irrigation Market, by Landscapers and Groundskeepers, By Region, 2023-2030 (US$ Mn)
TABLE 42 North America Smart Irrigation Market, by Landscapers and Groundskeepers, By Region, 2017-2022 (US$ Mn)
TABLE 43 North America Smart Irrigation Market, by Residential Users, By Region, 2023-2030 (US$ Mn)
TABLE 44 North America Smart Irrigation Market, by Residential Users, By Region, 2017-2022 (US$ Mn)
TABLE 45 North America Smart Irrigation Market, by Golf Course Managers, By Region, 2023-2030 (US$ Mn)
TABLE 46 North America Smart Irrigation Market, by Golf Course Managers, By Region, 2017-2022 (US$ Mn)
TABLE 47 North America Smart Irrigation Market, by Local Governments, By Region, 2023-2030 (US$ Mn)
TABLE 48 North America Smart Irrigation Market, by Local Governments, By Region, 2017-2022 (US$ Mn)
TABLE 49 North America Smart Irrigation Market, by Potable Water, By Region, 2017-2022 (US$ Mn)
TABLE 50 North America Smart Irrigation Market, by Potable Water, By Region, 2023-2030 (US$ Mn)
TABLE 51 North America Smart Irrigation Market, by Non-Potable Water, By Region, 2017-2022 (US$ Mn)
TABLE 52 North America Smart Irrigation Market, by Non-Potable Water, By Region, 2023-2030 (US$ Mn)
TABLE 53 North America Smart Irrigation Market, by Utilities and Energy Sector, By Region, 2017-2022 (US$ Mn)
TABLE 54 North America Smart Irrigation Market, by Utilities and Energy Sector, By Region, 2023-2030 (US$ Mn)
TABLE 55 North America Smart Irrigation Market, by Transportation and Infrastructure, By Region, 2017-2022 (US$ Mn)
TABLE 56 North America Smart Irrigation Market, by Transportation and Infrastructure, By Region, 2023-2030 (US$ Mn)
TABLE 57 North America Smart Irrigation Market, by Component Type, 2017-2022 (US$ Mn)
TABLE 58 North America Smart Irrigation Market, by Component Type, 2023-2030 (US$ Mn)
TABLE 59 North America Smart Irrigation Market, By Irrigation Type, 2017-2022 (US$ Mn)
TABLE 60 North America Smart Irrigation Market, By Irrigation Type, 2023-2030 (US$ Mn)
TABLE 61 North America Smart Irrigation Market, by Application, 2017-2022 (US$ Mn)
TABLE 62 North America Smart Irrigation Market, by Application, 2023-2030 (US$ Mn)
TABLE 63 North America Smart Irrigation Market, by Communication Technology, By Region, 2017-2022 (US$ Mn)
TABLE 64 North America Smart Irrigation Market, by Communication Technology, By Region, 2023-2030 (US$ Mn)
TABLE 65 North America Smart Irrigation Market, By End-Users, 2017-2022 (US$ Mn)
TABLE 66 North America Smart Irrigation Market, By End-Users, 2023-2030 (US$ Mn)
TABLE 67 North America Smart Irrigation Market, by Water Source, 2017-2022 (US$ Mn)
TABLE 68 North America Smart Irrigation Market, by Water Source, 2023-2030 (US$ Mn)
TABLE 69 North America Smart Irrigation Market, by Region, 2017-2022 (US$ Mn)
TABLE 70 North America Smart Irrigation Market, by Region, 2023-2030 (US$ Mn)
TABLE 71 North America Smart Irrigation Market, by Component Type, 2017-2022 (US$ Mn)
TABLE 72 North America Smart Irrigation Market, by Component Type, 2023-2030 (US$ Mn)
TABLE 73 North America Smart Irrigation Market, By Irrigation Type, 2017-2022 (US$ Mn)
TABLE 74 North America Smart Irrigation Market, By Irrigation Type, 2023-2030 (US$ Mn)
TABLE 75 North America Smart Irrigation Market, by Application, 2017-2022 (US$ Mn)
TABLE 76 North America Smart Irrigation Market, by Application, 2023-2030 (US$ Mn)
TABLE 77 United States Smart Irrigation Market, by Component Type, 2017-2022 (US$ Mn)
TABLE 78 United States Smart Irrigation Market, by Component Type, 2023-2030 (US$ Mn)
TABLE 79 United States Smart Irrigation Market, by Irrigation Type, 2017-2022 (US$ Mn)
TABLE 80 United States Smart Irrigation Market, by Irrigation Type, 2023-2030 (US$ Mn)
TABLE 81 United States Smart Irrigation Market, by Application, 2017-2022 (US$ Mn)
TABLE 82 United States Smart Irrigation Market, by Application, 2023-2030 (US$ Mn)
TABLE 83 United States Smart Irrigation Market, by Communication Technology, By Region, 2017-2022 (US$ Mn)
TABLE 84 United States Smart Irrigation Market, by Communication Technology, By Region, 2023-2030 (US$ Mn)
TABLE 85 United States Smart Irrigation Market, by End-Users, 2017-2022 (US$ Mn)
TABLE 86 United States Smart Irrigation Market, by End-Users, 2023-2030 (US$ Mn)
TABLE 87 United States Smart Irrigation Market, by Water Source, 2017-2022 (US$ Mn)
TABLE 88 United States Smart Irrigation Market, by Water Source, 2023-2030 (US$ Mn)
TABLE 89 Canada Smart Irrigation Market, by Component Type, 2017-2022 (US$ Mn)
TABLE 90 Canada Smart Irrigation Market, by Component Type, 2023-2030 (US$ Mn)
TABLE 91 Canada Smart Irrigation Market, by Irrigation Type, 2017-2022 (US$ Mn)
TABLE 92 Canada Smart Irrigation Market, by Irrigation Type, 2023-2030 (US$ Mn)
TABLE 93 Canada Smart Irrigation Market, by Application, 2017-2022 (US$ Mn)
TABLE 94 Canada Smart Irrigation Market, by Application, 2023-2030 (US$ Mn)
TABLE 95 Canada Smart Irrigation Market, by Communication Technology, By Region, 2017-2022 (US$ Mn)
TABLE 96 Canada Smart Irrigation Market, by Communication Technology, By Region, 2023-2030 (US$ Mn)
TABLE 97 Canada Smart Irrigation Market, by End-Users, 2017-2022 (US$ Mn)
TABLE 98 Canada Smart Irrigation Market, by End-Users, 2023-2030 (US$ Mn)
TABLE 99 Canada Smart Irrigation Market, by Water Source, 2017-2022 (US$ Mn)
TABLE 100 Canada Smart Irrigation Market, by Water Source, 2023-2030 (US$ Mn)
TABLE 101 Mexico Smart Irrigation Market, by Component Type, 2017-2022 (US$ Mn)
TABLE 102 Mexico Smart Irrigation Market, by Component Type, 2023-2030 (US$ Mn)
TABLE 103 Mexico Smart Irrigation Market, by Irrigation Type, 2017-2022 (US$ Mn)
TABLE 104 Mexico Smart Irrigation Market, by Irrigation Type, 2023-2030 (US$ Mn)
TABLE 105 Mexico Smart Irrigation Market, by Application, 2017-2022 (US$ Mn)
TABLE 106 Mexico Smart Irrigation Market, by Application, 2023-2030 (US$ Mn)
TABLE 107 Mexico Smart Irrigation Market, by Communication Technology, By Region, 2017-2022 (US$ Mn)
TABLE 108 Mexico Smart Irrigation Market, by Communication Technology, By Region, 2023-2030 (US$ Mn)
TABLE 109 Mexico Smart Irrigation Market, by End-Users, 2017-2022 (US$ Mn)
TABLE 110 Mexico Smart Irrigation Market, by End-Users, 2023-2030 (US$ Mn)
TABLE 111 Mexico Smart Irrigation Market, by Water Source, 2017-2022 (US$ Mn)
TABLE 112 Mexico Smart Irrigation Market, by Water Source, 2023-2030 (US$ Mn)


Request Free Sample

Ready to Transform Data into Decisions?

Request Your Sample Report and Start Your Journey of Informed Choices


Providing the strategic compass for industry titans.

cr-clients-logos
What is the current Component Type of the North America Smart Irrigation Market ?

In 2022, the South Africa Prefilled Syringes Smart Irrigation Market is expected to be worth USD 354.8 million.

What is the predicted growth rate of the North America Smart Irrigation Market between 2023 and 2030?

The North America Smart Irrigation Market is estimated to increase at a CAGR of 16.20% between 2023 and 2030, reaching USD 1179.3 Million in 2030.

Which segment has the most market share in terms of component type?

The controller category accounts for the majority of market share

Which Application segment governs the market demand for North America Smart Irrigation Market ?

Precision agriculture generates market demand

Which end-user segment is predicted to grow at the fastest growing segment over the forecast period?

Farmers and agricultural producers are the smart irrigation sector’s fastest growing segment

About Author

Shweta Bisht

Shweta Bisht

Healthcare & Biotech Analyst

Shweta is a healthcare and biotech researcher with strong analytical skills in chemical and agri domains.

View Profile

Related Reports

Self-Heating Food Packaging Market

Self-Heating Food Packaging Market size was valued at USD 65320 million in 2024 and is anticipated to reach USD 92891.6 million by 2032, at a CAGR of 4.5% during the forecast period.

Semiconductor ICP-MS Systems Market

The Semiconductor ICP-MS Systems Market was valued at USD 180.1 million in 2024 and is anticipated to reach USD 256.1 million by 2032, growing at a CAGR of 4.5% during the forecast period.

Semiconductor Foundry Market

The Semiconductor Foundry Market was valued at USD 148,480 million in 2024 and is anticipated to reach USD 228,735.7 million by 2032, growing at a CAGR of 5.55% during the forecast period.

Semiconductor Bonding Market

The Semiconductor Bonding Market was valued at USD 950.6 million in 2024 and is anticipated to reach USD 1,265.3 million by 2032, growing at a CAGR of 3.64% during the forecast period.

North America Anti-Icing and De-Icing Nanocoatings Market

The North America Anti-Icing and De-Icing Nanocoatings Market size was valued at USD 65.18 million in 2018 to USD 153.35 million in 2024 and is anticipated to reach USD 475.34 million by 2032, at a CAGR of 15.1% during the forecast period.

U.S. Anti-Icing and De-Icing Nanocoatings Market

The U.S. Anti-Icing and De-Icing Nanocoatings Market size was valued at USD 52.21 million in 2018 to USD 121.68 million in 2024 and is anticipated to reach USD 372.38 million by 2032, at a CAGR of 15.1% during the forecast period.

Europe Anti-Icing and De-Icing Nanocoatings Market

The Europe Anti-Icing and De-Icing Nanocoatings Market size was valued at USD 79.25 million in 2018 to USD 187.33 million in 2024 and is anticipated to reach USD 584.22 million by 2032, at a CAGR of 15.1% during the forecast period.

France Anti-Icing and De-Icing Nanocoatings Market

The France Anti-Icing and De-Icing Nanocoatings Market size was valued at USD 10.04 million in 2018 to USD 22.93 million in 2024 and is anticipated to reach USD 68.18 million by 2032, at a CAGR of 14.70% during the forecast period.

Inhalable Biologics Market

The inhalable biologics market size was valued at USD 3.78 billion in 2024 and is anticipated to reach USD 13.4 billion by 2032, at a CAGR of 17.1% during the forecast period (2024-2032).

Licence Option

The report comes as a view-only PDF document, optimized for individual clients. This version is recommended for personal digital use and does not allow printing. Use restricted to one purchaser only.
$3999

To meet the needs of modern corporate teams, our report comes in two formats: a printable PDF and a data-rich Excel sheet. This package is optimized for internal analysis. Unlimited users allowed within one corporate location (e.g., regional office).
$5999

The report will be delivered in printable PDF format along with the report’s data Excel sheet. This license offers 100 Free Analyst hours where the client can utilize Credence Research Inc. research team. Permitted for unlimited global use by all users within the purchasing corporation, such as all employees of a single company.
$10999

Credence Staff 3

WILLIAM, North America

Support Staff at Credence Research

KEITH PHILLIPS, Europe

Lee - CR Sales Staff

LEE VALLANCE, Asia Pacific

Kieran Jameson

KIERAN JAMESON, Australia

Report delivery within 24 to 48 hours

User Review

Thank you for the data! The numbers are exactly what we asked for and what we need to build our business case.

Materials Scientist
(privacy requested)

User Review

The report was an excellent overview of the Industrial Burners market. This report does a great job of breaking everything down into manageable chunks.

Imre Hof
Management Assistant, Bekaert

cr-clients-logos

Request Sample