Market Overview
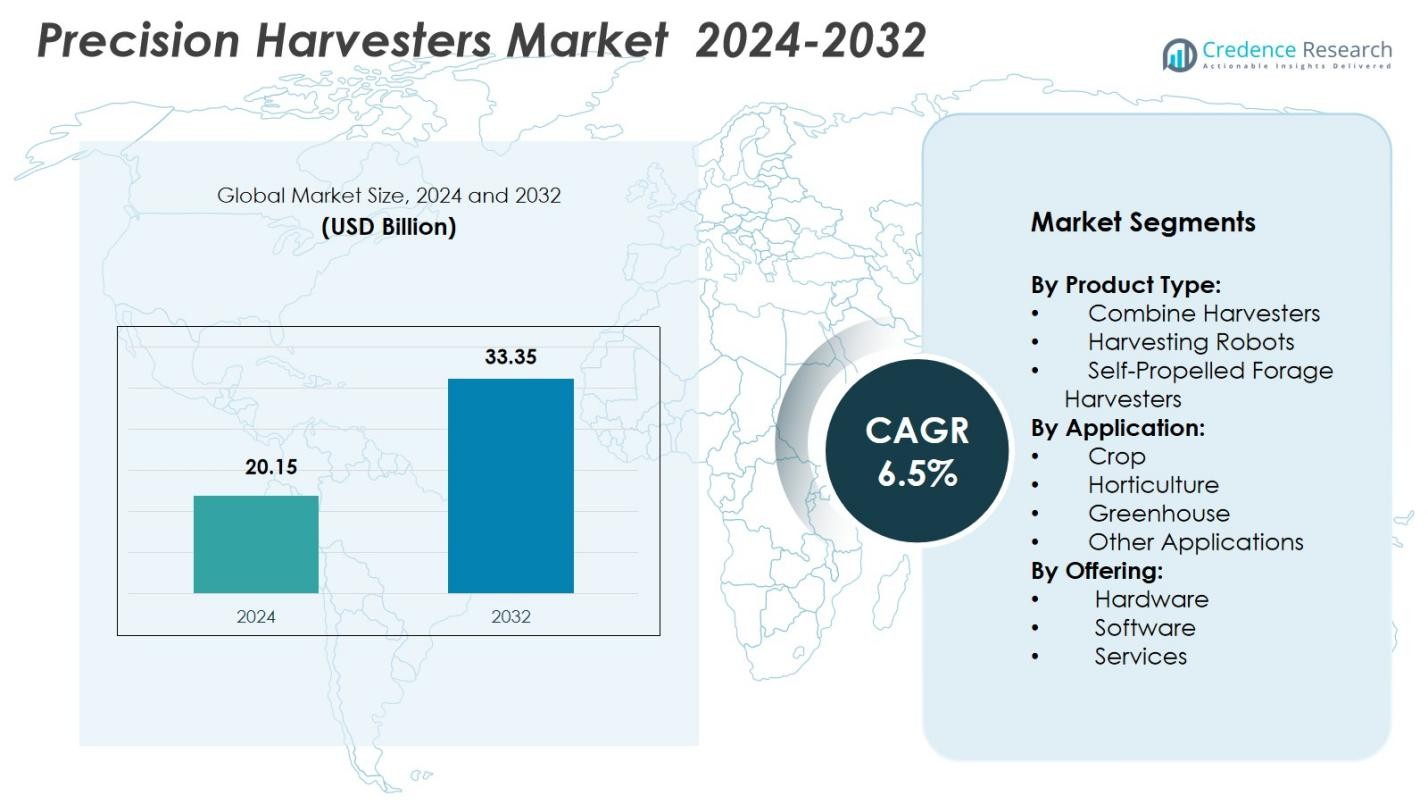
Precision Harvesters Market size was valued at USD 20.15 billion in 2024 and is anticipated to reach USD 33.35 billion by 2032, at a CAGR of 6.5% during the forecast period.
| REPORT ATTRIBUTE |
DETAILS |
| Historical Period |
2020-2023 |
| Base Year |
2024 |
| Forecast Period |
2025-2032 |
| Precision Harvesters Market Size 2024 |
USD 20.15 Billion |
| Precision Harvesters Market, CAGR |
6.5% |
| Precision Harvesters Market Size 2032 |
USD 33.35 Billion |
Precision Harvesters Market features a strong presence of leading players such as Pellenc, KUBOTA Corporation, ISEKI & Co. Ltd., Harvest Automation, Vision Robotics Corporation, FFRobotics, HARVEST CROO, TeeJet Technologies, Topcon, DICKEY-john, and CNH Industrial N.V., all contributing to advancements in automated and high-precision harvesting systems. These companies focus on robotics, GPS-guided machinery, sensor-enabled platforms, and AI-driven analytics to enhance yield efficiency and reduce labor dependency across agricultural operations. North America leads the market with a 34.6% share in 2024, supported by widespread mechanization and rapid adoption of smart harvesting technologies, followed by Europe and Asia-Pacific with strong growth momentum.
Market Insights
- Precision Harvesters Market was valued at USD 20.15 billion in 2024 and is projected to grow at a CAGR of 6.5% through 2032.
- Rising demand for automation and labor-efficient machinery drives adoption of combine harvesters, which hold a 54.2% share due to their high precision, GPS integration, and strong suitability for large-scale farming.
- Growing use of robotic and sensor-enabled systems defines market trends as farms invest in AI, machine vision, and real-time yield analytics to boost productivity and minimize crop losses.
- Key players such as Pellenc, KUBOTA Corporation, FFRobotics, HARVEST CROO, Topcon, and CNH Industrial N.V. focus on advanced automation, connectivity, and data-driven machinery to strengthen market presence.
- North America leads with a 34.6% share, followed by Europe at 28.4% and Asia-Pacific at 27.1%, while the Crop Application segment dominates with 61.7% share, supported by strong mechanization and large-scale cultivation patterns.
Access crucial information at unmatched prices!
Request your sample report today & start making informed decisions powered by Credence Research Inc.!
Download Sample
Market Segmentation Analysis:
By Product Type:
The Precision Harvesters Market is led by Combine Harvesters, accounting for 54.2% of the total share in 2024, driven by their widespread adoption in large-scale agriculture and ability to integrate GPS guidance, yield mapping, and variable-rate harvesting. Their high operational efficiency, reduced labor dependency, and compatibility with automated steering systems strengthen their dominance. Harvesting Robots and Self-Propelled Forage Harvesters are expanding segments, supported by the demand for automation, labor scarcity solutions, and improved crop quality monitoring. Increasing investment in robotic harvesting systems further enhances productivity and precision in high-value crop operations.
- For instance, John Deere’s S700 combine series incorporates John Deere Operations Center, enabling real-time data exchange and precision farming, enhancing yield accuracy.
By Application:
The Crop segment dominates the Precision Harvesters Market with a 61.7% share in 2024, supported by rising mechanization across cereals, oilseeds, and pulses, where high accuracy and productivity gains are essential. Precision systems enable optimized crop handling, reduced post-harvest losses, and real-time yield analytics. Horticulture, Greenhouse, and Other Applications segments are growing due to the increasing adoption of robotic and sensor-integrated harvesters for fruits, vegetables, and specialty crops. The need for consistent quality, labor efficiency, and controlled-environment harvesting accelerates adoption across these categories.
- For instance, AGCO’s Fuse Connected Services deliver real-time data for oilseed harvesting, enabling operators to adjust settings for maximum efficiency.
By Offering:
The Hardware segment holds the largest share in the Precision Harvesters Market at 68.9% in 2024, propelled by strong demand for advanced harvesting machinery equipped with automation, GNSS guidance, sensor arrays, and onboard computing systems. Increasing replacement cycles, high investment in machinery upgrades, and the shift toward autonomous solutions support hardware expansion. The Software and Services segments are gaining traction as farms adopt analytics platforms, fleet management solutions, predictive maintenance, and AI-driven decision tools to improve efficiency, minimize downtime, and optimize harvest planning.
 Key Growth Drivers
Rising Demand for Automated and High-Precision Farming
The Precision Harvesters Market is experiencing strong growth as farms increasingly adopt automation to enhance productivity and address labor shortages. High-precision harvesting technologies such as GPS-guided combine harvesters, robotic systems, and sensor-enabled machinery enable faster operations, reduced losses, and improved crop quality. Farmers are prioritizing solutions that deliver real-time insights, enhance accuracy, and minimize manual intervention, especially in large-scale production environments. This shift toward automation significantly accelerates the demand for advanced precision harvesting equipment globally.
- For instance, John Deere integrates GPS location data with sensors on its harvesting combines to map crop yield variations across fields in real time. This setup allows operators to adjust machine settings dynamically for optimal performance during harvest.
Expansion of Large-Scale Commercial Farming
Large-scale commercial farms are rapidly integrating precision harvesters to improve operational efficiency and reduce cost-per-acre. As farms expand in size, the need for high-capacity equipment with automated steering, yield monitoring, and variable-rate harvesting becomes critical. Precision harvesters support optimized field management, higher throughput, and enhanced resource utilization. This trend is further strengthened by rising food demand, increasing mechanization rates in developing economies, and government support for modern farming technologies, which collectively boost adoption in commercial agriculture operations.
- For instance, Case IH Axial-Flow combines with AFS Harvest Command automation boost throughput and reduce grain loss across large cotton and grain operations.
Integration of Advanced Digital and Analytics Technologies
The incorporation of digital tools, AI-driven analytics, and IoT platforms is a major driver accelerating market expansion. Modern precision harvesters are now equipped with telematics, cloud-based dashboards, and machine-health monitoring systems, enabling predictive maintenance and data-driven decision-making. These capabilities improve operational reliability, reduce downtime, and support precision farming strategies aimed at maximizing yield. As farms embrace digital transformation, the demand for connected, intelligent harvesting systems continues to rise, positioning technologically advanced solutions at the forefront of industry growth.
Key Trends & Opportunities
Growing Adoption of Autonomous and Robotic Harvesters
A significant trend shaping the Precision Harvesters Market is the rising deployment of autonomous and robotic harvesting systems. These machines leverage AI, machine vision, and advanced navigation technologies to perform complex tasks with minimal human involvement. Their ability to operate continuously, improve crop selectivity, and address seasonal labor shortages creates substantial opportunities across both agriculture and horticulture sectors. As manufacturers enhance robotic capabilities for specialty crops, the market is poised for expanded adoption in high-value farming applications.
- For instance, Smart Ag’s AutoCart automates grain cart operations, allowing a single operator to handle multiple tasks and thereby streamlining continuous harvesting processes.
Increasing Use of Sensor-Based Yield Analytics and Real-Time Data Systems
The market is witnessing rapid growth in the integration of sensors, imaging tools, and data analytics platforms within harvesting machinery. These systems provide farmers with detailed insights into crop conditions, moisture levels, and yield variability, enabling precise harvesting decisions. The availability of real-time data enhances operational planning, reduces waste, and supports long-term productivity improvements. As data-driven agriculture becomes more mainstream, demand for harvesters with advanced monitoring and analytics capabilities continues to grow, creating new opportunities for technology providers.
- For instance, John Deere’s S7 combines use Precision Ag Technology with sensors for automated harvest settings. Operators gain real-time grain flow and yield data, achieving up to 98% accuracy verified against weighbridges for optimized performance.
Key Challenges
High Capital Investment and Adoption Barriers for Small Farms
A major challenge for the Precision Harvesters Market is the substantial initial investment required for advanced machinery, robotics, and digital platforms. Small and medium-sized farms often struggle to justify the cost of high-end precision equipment, especially when profit margins fluctuate. Limited access to financing, lack of training, and insufficient technical expertise further hinder adoption. These barriers create a widening gap between advanced commercial farms and smaller agricultural operations, slowing overall market penetration in developing regions.
Complexity of Integration and Limited Interoperability
Integrating precision harvesting technologies with existing farm machinery, software platforms, and data systems presents a significant challenge. Many harvesters use proprietary interfaces that limit interoperability, making it difficult for farmers to combine tools from different manufacturers. Additionally, managing large data volumes, ensuring connectivity in rural areas, and maintaining system reliability add complexity. These integration challenges slow down adoption, increase operational costs, and require ongoing technical support, which can deter farmers from embracing fully connected precision harvesting ecosystems.
Regional Analysis
North America
North America holds a 34.6% share of the Precision Harvesters Market in 2024, driven by strong adoption of advanced mechanization, robotics, and GPS-enabled harvesting systems across large commercial farms. The U.S. leads regional demand with high investments in autonomous machinery, yield-mapping tools, and integrated telematics platforms. Supportive government programs promoting precision agriculture and farm modernization further accelerate adoption. Additionally, labor shortages in key agricultural states strengthen the shift toward automated harvesting solutions. Canada contributes to regional growth through expanding grain cultivation and increasing reliance on smart harvesting technologies to enhance operational efficiency.
Europe
Europe accounts for a 28.4% share of the Precision Harvesters Market in 2024, supported by extensive mechanization in countries such as Germany, France, and the U.K. The region benefits from strong regulatory emphasis on sustainable farming, pushing adoption of precision systems that reduce waste, optimize input use, and improve harvest accuracy. High-value crop producers increasingly adopt robotic and sensor-based harvesting solutions to ensure quality consistency. Ongoing digital transformation initiatives, farm subsidies, and technology integration under the EU’s Common Agricultural Policy further strengthen demand for advanced, connected harvesting machinery across diverse crop landscapes.
Asia-Pacific
Asia-Pacific captures a 27.1% share of the Precision Harvesters Market in 2024, fueled by rapid agricultural modernization in China, India, Japan, and Australia. Rising labor costs, expanding commercial farming operations, and strong government support for mechanization significantly drive adoption. China and Japan lead in robotic harvesting technologies, while India is experiencing rapid uptake of smart combine harvesters due to subsidy programs and the need to improve crop productivity. Increasing focus on food security, digital farming initiatives, and high-yield crop production accelerate demand for precision harvesting solutions across the region’s diverse agricultural ecosystems.
Latin America
Latin America holds a 6.8% share of the Precision Harvesters Market in 2024, driven by large-scale cultivation of soybeans, corn, and sugarcane across Brazil and Argentina. Expanding agribusiness operations and increasing mechanization investments support regional growth, particularly in high-capacity combine harvesters equipped with GNSS guidance systems. Brazil leads adoption due to favorable credit programs and strong demand for productivity-enhancing technologies. Rising interest in data-driven farming, yield mapping, and automation is gradually strengthening the market across Chile, Mexico, and Colombia, where farmers seek to reduce operational costs and enhance harvest accuracy.
Middle East & Africa
The Middle East & Africa region accounts for 3.1% of the Precision Harvesters Market in 2024, with growth influenced by rising agricultural diversification efforts and increasing adoption of mechanized farming in countries such as South Africa, the UAE, and Saudi Arabia. Water scarcity and the need for efficient resource management drive interest in precision harvesting systems that support optimized yield outcomes. South Africa leads regional adoption with advancing commercial crop production, while government-backed food security initiatives in Gulf countries promote technology integration. Gradual digital transformation and expanding agri-tech investments are expected to support long-term market growth.
Market Segmentations:
By Product Type:
- Combine Harvesters
- Harvesting Robots
- Self-Propelled Forage Harvesters
By Application:
- Crop
- Horticulture
- Greenhouse
- Other Applications
By Offering:
- Hardware
- Software
- Services
By Geography
- North America
- Europe
- Germany
- France
- U.K.
- Italy
- Spain
- Rest of Europe
- Asia Pacific
- China
- Japan
- India
- South Korea
- South-east Asia
- Rest of Asia Pacific
- Latin America
- Brazil
- Argentina
- Rest of Latin America
- Middle East & Africa
- GCC Countries
- South Africa
- Rest of the Middle East and Africa
Competitive Landscape
The Precision Harvesters Market features a dynamic landscape shaped by leading players such as Pellenc, KUBOTA Corporation, ISEKI & Co. Ltd., Harvest Automation, Vision Robotics Corporation, FFRobotics, HARVEST CROO, TeeJet Technologies, Topcon, DICKEY-john, and CNH Industrial N.V. These companies focus on expanding their portfolios with advanced harvesting machinery, autonomous systems, and sensor-integrated solutions designed to enhance yield accuracy and operational efficiency. Innovation centers on GPS-guided harvesters, AI-driven robotic systems, and cloud-connected performance monitoring tools that support data-driven farming. Strategic partnerships, product upgrades, and R&D investments remain central to strengthening market position, while manufacturers increasingly compete on automation capability, durability, and integration with digital farming platforms. Growing demand for robotic harvesting solutions in high-value crops is accelerating competition among emerging tech-driven firms. Meanwhile, established agricultural machinery giants are leveraging global distribution networks and long-term customer relationships to maintain leadership across major farming economies.
Key Player Analysis
- Harvest Automation
- Topcon
- FFRobotics and HARVEST CROO
- KUBOTA Corporation
- Vision Robotics Corporation
- TEEJET TECHNOLOGIES
- CNH Industrial N.V.
- DICKEY-john
- ISEKI & CO LTD.
- Pellenc
Recent Developments
- In November 2025 New Holland launched the updated CX PLMi Series combine harvesters, now equipped with enhanced connectivity, advanced GPS guidance and integrated data-management features for improved precision farming operations.
- In August 2025 Daedong introduced the DH6135-A, Korea’s first six-row combine harvester featuring yield monitoring and Level-3 autonomous operation, enabling significant reductions in operator effort and improved harvesting efficiency.
- In February 2025, Yamaha Motor Co., Ltd. acquired Robotics Plus a New Zealand–based agricultural automation startup creating a new subsidiary aimed at delivering precision agriculture and automation solutions globally.
Shape Your Report to Specific Countries or Regions & Enjoy 30% Off!
Report Coverage
The research report offers an in-depth analysis based on Product Type, Application, Offering and Geography. It details leading market players, providing an overview of their business, product offerings, investments, revenue streams, and key applications. Additionally, the report includes insights into the competitive environment, SWOT analysis, current market trends, as well as the primary drivers and constraints. Furthermore, it discusses various factors that have driven market expansion in recent years. The report also explores market dynamics, regulatory scenarios, and technological advancements that are shaping the industry. It assesses the impact of external factors and global economic changes on market growth. Lastly, it provides strategic recommendations for new entrants and established companies to navigate the complexities of the market.
Future Outlook
- Adoption of autonomous and robotic harvesting systems will accelerate across large and mid-sized farms.
- Integration of AI, machine vision, and analytics will enhance real-time harvesting accuracy and yield insights.
- Demand for sensor-enabled and GPS-guided harvesters will grow as farms prioritize precision and efficiency.
- Expansion of commercial farming in emerging economies will drive uptake of advanced harvesting machinery.
- Cloud-based monitoring and predictive maintenance tools will become standard features in modern harvesters.
- Labor shortages will continue to push farmers toward high-automation harvesting solutions.
- Manufacturers will increase investment in multi-crop and high-value crop harvesting technologies.
- Rising focus on sustainability will encourage adoption of fuel-efficient and electric precision harvesters.
- Connectivity through telematics and IoT platforms will strengthen fleet management and operational planning.
- Government incentives and digital agriculture programs will support broader precision harvester adoption globally.


