Market Overview
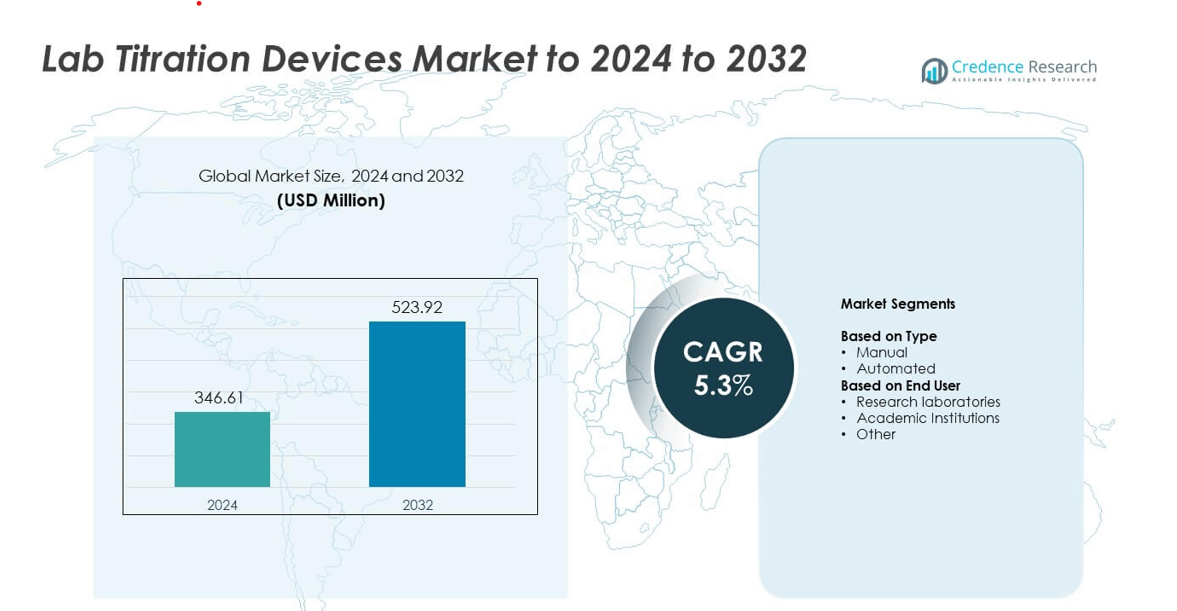
Lab Titration Devices Market size was valued at USD 346.61 Million in 2024 and is anticipated to reach USD 523.92 Million by 2032, growing at a CAGR of 5.3% during the forecast period.
| REPORT ATTRIBUTE |
DETAILS |
| Historical Period |
2020-2023 |
| Base Year |
2024 |
| Forecast Period |
2025-2032 |
| Lab Titration Devices Market Size 2024 |
USD 346.61 Million |
| Lab Titration Devices Market, CAGR |
5.3% |
| Lab Titration Devices Market Size 2032 |
USD 523.92 Million |
The Lab Titration Devices Market is shaped by leading companies such as Metrohm AG, Hanna Instruments, COSA Xentaur, DKK-TOA Corporation, ThermoFisher Scientific, Xylem Analaytics Germany, Hiranuma Sangyo Co Ltd, CSC Scientific Company, Diagger Scientific Inc, and ECH Scientific. These players compete through advanced automated titration systems, digital integration, and strong service networks that support high-precision analytical workflows. North America leads the global market with about 34% share due to extensive R&D activity and rapid adoption of automated laboratory technologies. Europe follows with nearly 29% share, while Asia pacific grows quickly as research infrastructure expands across key economies.
Market Insights
- Lab Titration Devices Market reached USD 346.61 million in 2024 and is projected to reach USD 523.92 million by 2032, growing at a CAGR of 5.3%.
- Demand rises as automated titration systems dominate the type segment with about 64% share, driven by higher accuracy and lower manual error in research and industrial workflows.
- Trends include rapid digital adoption, integration of smart sensors, and rising use in pharmaceuticals, chemicals, and environmental testing where data integrity and speed are essential.
- Competition strengthens as major companies enhance software capabilities, modular designs, and service support, while high costs and skill shortages act as restraints that limit adoption in small labs.
- Regionally, North America leads with about 34% share, Europe holds nearly 29%, Asia pacific follows with about 25% share, while Latin America and Middle east & Africa account for smaller proportions and show steady growth.
Access crucial information at unmatched prices!
Request your sample report today & start making informed decisions powered by Credence Research Inc.!
Download Sample
Market Segmentation Analysis:
By Type
Automated titration devices lead this segment with about 64% share in 2024 due to strong demand for higher accuracy, faster throughput, and reduced operator error. Laboratories prefer automated systems because these platforms support complex workflows, precise endpoint detection, and seamless data recording needed in pharmaceutical QA, chemical analysis, and environmental testing. Manual titrators continue to serve basic academic use and small-scale labs, but adoption slows as institutions shift toward digital and auto-calibrated units. Rising focus on method standardization and compliance keeps automated systems dominant across global research and industrial settings.
- For instance, the Metrohm OMNIS Sample Robot (L size) in its maximum configuration can process up to 175 samples when using small 75 mL beakers, or 112 samples in 120 mL beakers.
By End User
Research laboratories dominate this segment with nearly 57% share in 2024 driven by heavy use of titration in drug development, purity testing, and environmental monitoring. These labs rely on automated and semi-automated systems to handle high sample volumes and maintain strict analytical precision. Academic institutions show steady growth as universities expand chemistry and biochemistry programs, while the other category grows through small contract labs and food testing facilities. Increasing validation needs and regulated workflows maintain the strong position of research laboratories in the global market.
- For instance, Mettler Toledo’s Excellence T5–T9 titrators combined with InMotion Max automation can process up to 303 samples per analysis, matching the heavy throughput needs of research laboratories.
Key Growth Drivers
Rising demand for high-precision analytical workflows
Growing quality requirements in pharmaceuticals, chemicals, and food testing strengthen the need for accurate titration systems. Labs depend on precise endpoint detection to meet regulatory standards and reduce batch failures. Automated titration platforms gain strong traction because they deliver consistent results and support complex assays. Expanding environmental monitoring programs also increase system use for water, soil, and pollutant analysis. These factors make precision-driven analytical workflows a major growth driver for the Lab Titration Devices Market.
- For instance, Thermo Scientific’s Orion Star T900 titrators can log 100 data sets for each of four categories—sample titration, titrant standardization, calibration, and direct measurement—supporting traceable, high-precision workflows.
Shift toward automation and digitalization in laboratories
Modern laboratories prefer automated titration systems that reduce manual handling and improve productivity. Digital interfaces, auto-calibration, and integrated software help technicians run standardized methods with minimal error. This shift supports higher throughput for routine testing in industrial and research settings. Adoption accelerates as labs upgrade from manual devices to comply with strict documentation needs. The sustained move toward automated workflows positions digital titration technology as a key growth driver for the market.
- For instance, Hach’s Titralab AT1000 automatic titrators specify mV resolution of 0.1 and pH resolution of 0.001, with automated endpoint detection that removes manual reading and calculation steps.
Expanding applications across research and academic sectors
Growth in academic chemistry programs and advanced research labs increases titration demand. Students and researchers rely on titration workflows to study reaction kinetics, purity levels, and material properties. Funding for R&D in biotechnology, nanomaterials, and environmental science encourages device adoption. Expanding laboratory infrastructure in developing economies also drives new installations. Broad academic and research use makes expanding scientific applications an essential growth driver in the Lab Titration Devices Market.
Key Trends and Opportunities
Integration of smart sensors and advanced software
Titration devices increasingly include smart sensors, digital burettes, and automated dosing systems that support real-time adjustments. Software platforms offer audit trails, trend charts, and method libraries that enhance data quality. Labs gain opportunities to improve reproducibility and accelerate validation cycles. This integration opens new pathways for connected lab environments and strengthens long-term adoption of intelligent titration systems.
- For instance, Xylem’s TitroLine 7800 features a 3.5-inch color display with 320 by 240 pixels and an RFID receiver for SI Analytics ID electrodes, combining intelligent sensors with digital control for precise titration.
Growing adoption in environmental and food safety testing
Titration devices see rising use in water analysis, pollutant detection, and food quality assessment. Regulatory bodies demand rigorous testing for contaminants, acidity levels, and chemical residues. This trend opens strong opportunities for device manufacturers to expand in public health and environmental monitoring sectors. Increased enforcement of testing standards creates consistent demand across global markets.
- For instance, Hanna Instruments’ HI931 automatic titration system can store up to 100 titration and pH/mV/ISE reports, helping water and food laboratories maintain complete records for regulatory audits.
Expansion of modular and hybrid titration systems
Manufacturers offer modular devices that combine potentiometric, Karl Fischer, and conductometric titration in one platform. Labs benefit from flexible configurations and lower long-term costs. This trend helps institutions handle diverse sample types while maintaining accuracy. Growing interest in hybrid systems creates new opportunities for innovation in the Lab Titration Devices Market.
Key Challenges
High cost of advanced automated titration systems
Automated titration platforms require significant capital investment, which limits adoption in small labs and academic institutions. Maintenance, calibration, and software upgrades also add recurring expenses. These costs slow transitions from manual to automated workflows, especially in regions with limited budgets. Price pressure remains a major challenge for manufacturers and users.
Shortage of skilled laboratory personnel
Many labs struggle to recruit technicians trained to operate and troubleshoot advanced titration systems. Skill gaps reduce testing efficiency and increase operational errors. Training programs often lag behind rapid technology upgrades, making adoption harder for resource-constrained institutions. This ongoing shortage of expertise remains a key challenge for the Lab Titration Devices Market.
Regional Analysis
North America
North America holds about 34% share of the Lab Titration Devices Market in 2024, supported by strong adoption across pharmaceutical, chemical, and environmental testing laboratories. Research facilities depend on automated titration platforms to meet strict accuracy and documentation needs. The United States leads regional demand due to its extensive R&D spending and advanced analytical infrastructure. Replacement of manual systems with digital titrators continues to rise across industrial labs. Growth also benefits from regulatory programs focused on water testing and food quality analysis, which increase the use of precise titration workflows across public and private laboratories.
Europe
Europe accounts for nearly 29% share of the global market, driven by strong compliance requirements across pharmaceutical, biotechnology, and environmental sectors. Laboratories in Germany, the United Kingdom, and France invest heavily in automated titration systems to meet rigorous quality benchmarks. Adoption grows as research institutions expand analytical capabilities and shift toward digital documentation. The region also benefits from established chemical manufacturing bases that rely on titration for routine process control. Sustainability initiatives and strict water testing mandates further strengthen demand for high-precision titration devices across European laboratories.
Asia pacific
Asia pacific holds about 25% share and stands as the fastest-growing region due to rapid expansion of research laboratories and academic institutions. China, India, Japan, and South Korea increase investments in analytical chemistry, pharmaceuticals, and food testing, which drives higher use of automated titration systems. Growing industrialization boosts demand in chemical and material testing labs, while universities upgrade lab infrastructure to support advanced coursework. The region’s push toward quality assurance in food safety and environmental monitoring also supports wider adoption of titration devices. Rising government funding for R&D strengthens long-term market growth.
Latin America
Latin America captures around 7% share of the market, supported by growing use of titration systems in food testing, water analysis, and industrial quality control. Brazil and Mexico lead regional adoption due to expanding chemical and pharmaceutical sectors. Many laboratories still rely on manual titration, but gradual upgrades to automated units continue as institutions seek higher accuracy and better workflow efficiency. Strengthening regulatory oversight in environmental testing supports increased instrument use. However, budget limitations and slower modernization impede faster transition toward advanced digital titration platforms across the region.
Middle east & Africa
Middle east & Africa accounts for nearly 5% share, supported by rising adoption in water treatment labs, petrochemical facilities, and university research centers. Countries such as the United Arab Emirates, Saudi Arabia, and South Africa expand analytical testing capabilities to support industrial diversification. Growth remains steady as new laboratories invest in basic and mid-range titration devices for routine chemical analysis. Limited funding and smaller scientific infrastructure slow adoption of advanced automated systems, but ongoing development of environmental and food testing programs continues to create opportunities for wider uptake in the region.
Market Segmentations:
By Type
By End User
- Research laboratories
- Academic Institutions
- Other
By Geography
- North America
- Europe
- Germany
- France
- U.K.
- Italy
- Spain
- Rest of Europe
- Asia Pacific
- China
- Japan
- India
- South Korea
- South-east Asia
- Rest of Asia Pacific
- Latin America
- Brazil
- Argentina
- Rest of Latin America
- Middle East & Africa
- GCC Countries
- South Africa
- Rest of the Middle East and Africa
Competitive Landscape
The Lab Titration Devices Market features strong competition among Metrohm AG, Hanna Instruments, COSA Xentaur, DKK-TOA Corporation, ThermoFisher Scientific, Xylem Analaytics Germany, Hiranuma Sangyo Co Ltd, CSC Scientific Company, Diagger Scientific Inc, and ECH Scientific. Companies focus on automated titration systems that deliver higher accuracy, faster endpoint detection, and seamless digital integration. Vendors strengthen portfolios through modular designs, improved sensor technology, and advanced software that supports audit trails and method standardization. Many manufacturers expand service networks to meet rising demand for calibration, validation, and maintenance support. Competitive intensity increases as laboratories shift from manual units to automated platforms with better throughput and data quality. Firms also invest in compact devices for small labs and field testing, while larger research centers adopt fully integrated models for complex assays. Continuous innovation, compliance requirements, and growing analytical workloads keep the competitive landscape dynamic and technology-driven.
Shape Your Report to Specific Countries or Regions & Enjoy 30% Off!
Key Player Analysis
- Metrohm AG
- Hanna Instruments
- COSA Xentaur
- DKK-TOA Corporation
- ThermoFisher Scientific
- Xylem Analaytics Germany
- Hiranuma Sangyo Co Ltd
- CSC Scientific Company
- Diagger Scientific Inc
- ECH Scientific
Recent Developments
- In 2025, DKK-TOA Corporation Continued participation in industry exhibitions such as SEMICON EUROPA in October 2025 and Thailand LAB 2025 in August 2025, highlighting ongoing product development and market engagement.
- In 2024, Xylem Analytics highlighted its existing Titration Handbook, a 192-page guide that provides lab users with a compact introduction to the theory and practice of titration
- In 2023, Metrohm launched a new automated titrator with improved accuracy and precision.
Report Coverage
The research report offers an in-depth analysis based on Type, End-User and Geography. It details leading market players, providing an overview of their business, product offerings, investments, revenue streams, and key applications. Additionally, the report includes insights into the competitive environment, SWOT analysis, current market trends, as well as the primary drivers and constraints. Furthermore, it discusses various factors that have driven market expansion in recent years. The report also explores market dynamics, regulatory scenarios, and technological advancements that are shaping the industry. It assesses the impact of external factors and global economic changes on market growth. Lastly, it provides strategic recommendations for new entrants and established companies to navigate the complexities of the market.
Future Outlook
- Automated titration systems will gain wider adoption as labs prioritize accuracy and speed.
- Demand will rise in pharmaceuticals due to stricter purity and formulation standards.
- Research institutions will expand use as advanced chemistry and life-science programs grow.
- Software-integrated titrators will become standard for digital documentation and data traceability.
- Environmental testing labs will increase purchases to support water and pollutant analysis.
- Hybrid and modular titration platforms will see stronger uptake for multi-method workflows.
- Emerging economies will upgrade from manual to automated systems as lab infrastructure improves.
- Miniaturized titration devices will gain traction for portable and field-based testing.
- Manufacturers will focus on AI-enabled systems to improve endpoint detection and workflow automation.
- Service and calibration demand will rise as labs operate more sophisticated analytical equipment.



