
Licensed cannabis retail more than doubles by 2035
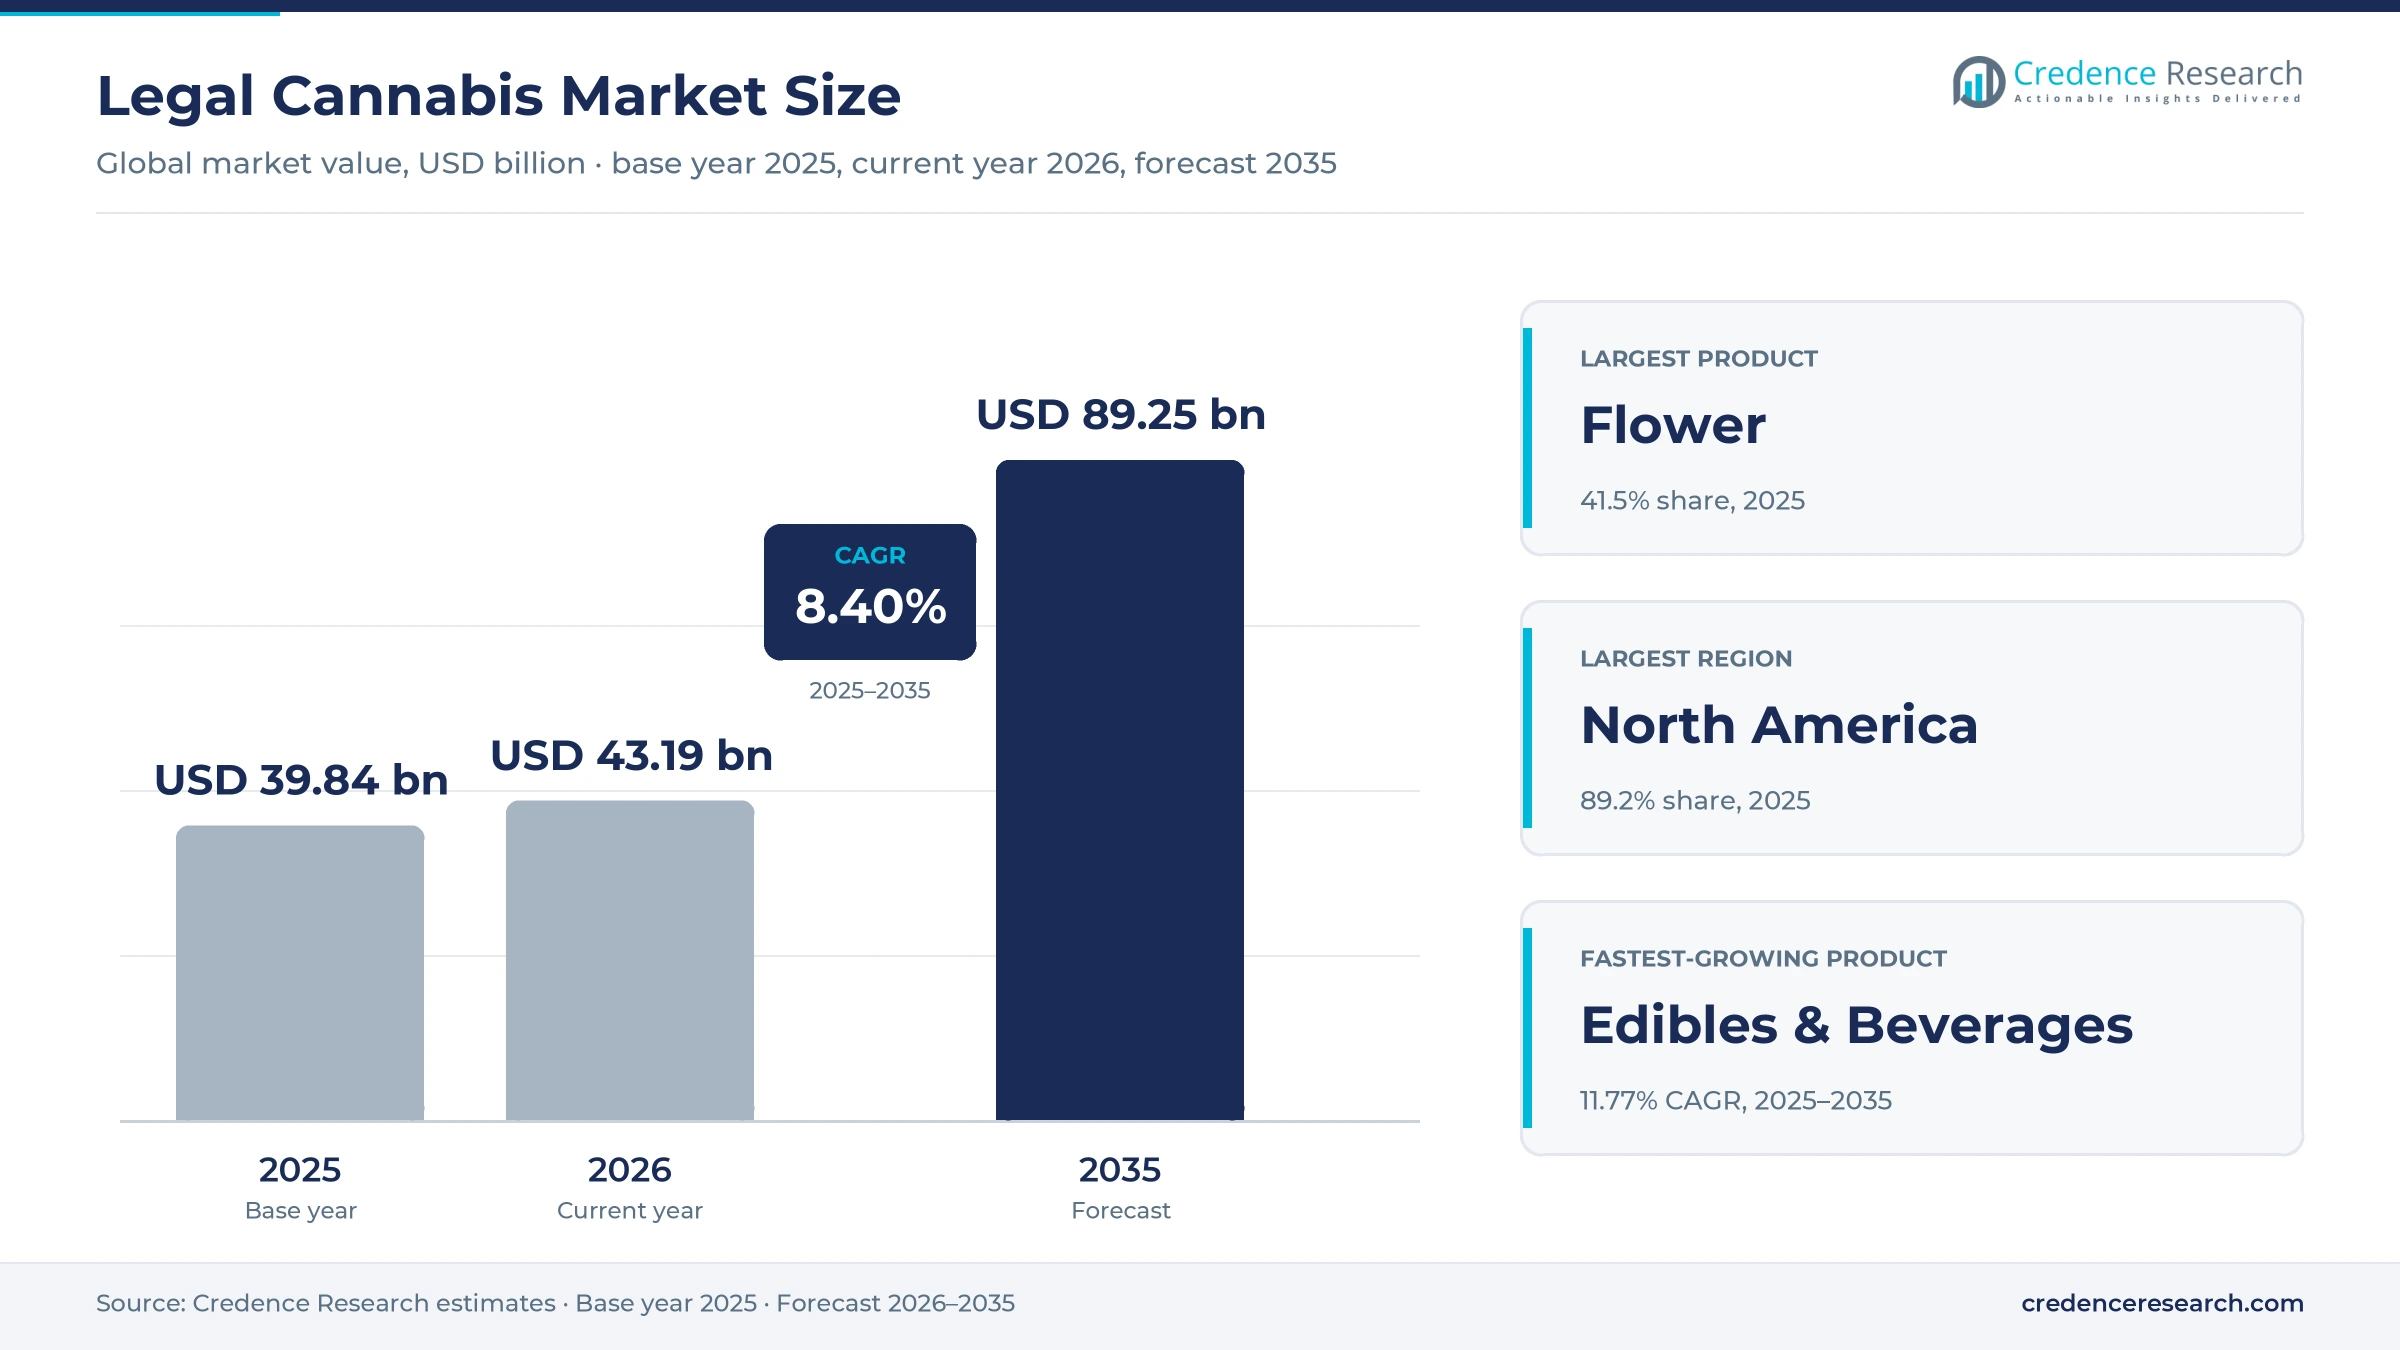
The legal cannabis market was valued at USD 39.84 billion in 2025 and is projected to increase from USD 43.19 billion in 2026 to USD 89.25 billion by 2035, registering a CAGR of 8.40% during 2025–2035. Demand comes from new U.S. adult-use states such as Ohio and Delaware, steady legal-channel gains in Canada, where sales rose 6.1% in the 2024/2025 fiscal year, and the opening of medical markets in Europe after Germany's 2024 Cannabis Act. Consumers are also shifting from flower to edibles, beverages, vapes and pre-rolls in U.S. and Canadian stores. North America held the largest regional share, 89.2% in 2025, led by state-licensed U.S. programs, while Europe is the fastest-growing region at 16.67% a year. The main regulatory change is the April 2026 federal rule that moved state-licensed medical marijuana to Schedule III, easing the federal tax burden on medical operators.
What counts as a legal cannabis sale?
Legal cannabis sales are retail purchases of THC cannabis through licensed stores, government retailers, pharmacies and authorized medical producers. Adult-use buyers shop in licensed dispensaries in U.S. states, Canadian provinces and a few other markets, while medical patients buy through dispensaries or, in Germany, Australia and the United Kingdom, mostly through pharmacies on prescription. Products include flower, pre-rolls, vapes and cartridges, concentrates, edibles and beverages.
The market excludes hemp-derived CBD and intoxicating hemp products sold outside cannabis licenses, illicit and grey-market sales, and equipment, testing and ancillary services. That boundary matters because hemp THC drinks and unlicensed sellers compete for the same consumers outside regulated sales data.
Legal Cannabis Market Insights
- The legal cannabis market is projected to grow from USD 43.19 billion in 2026 to USD 89.25 billion by 2035, an 8.40% CAGR, as new states and European medical demand add sales.
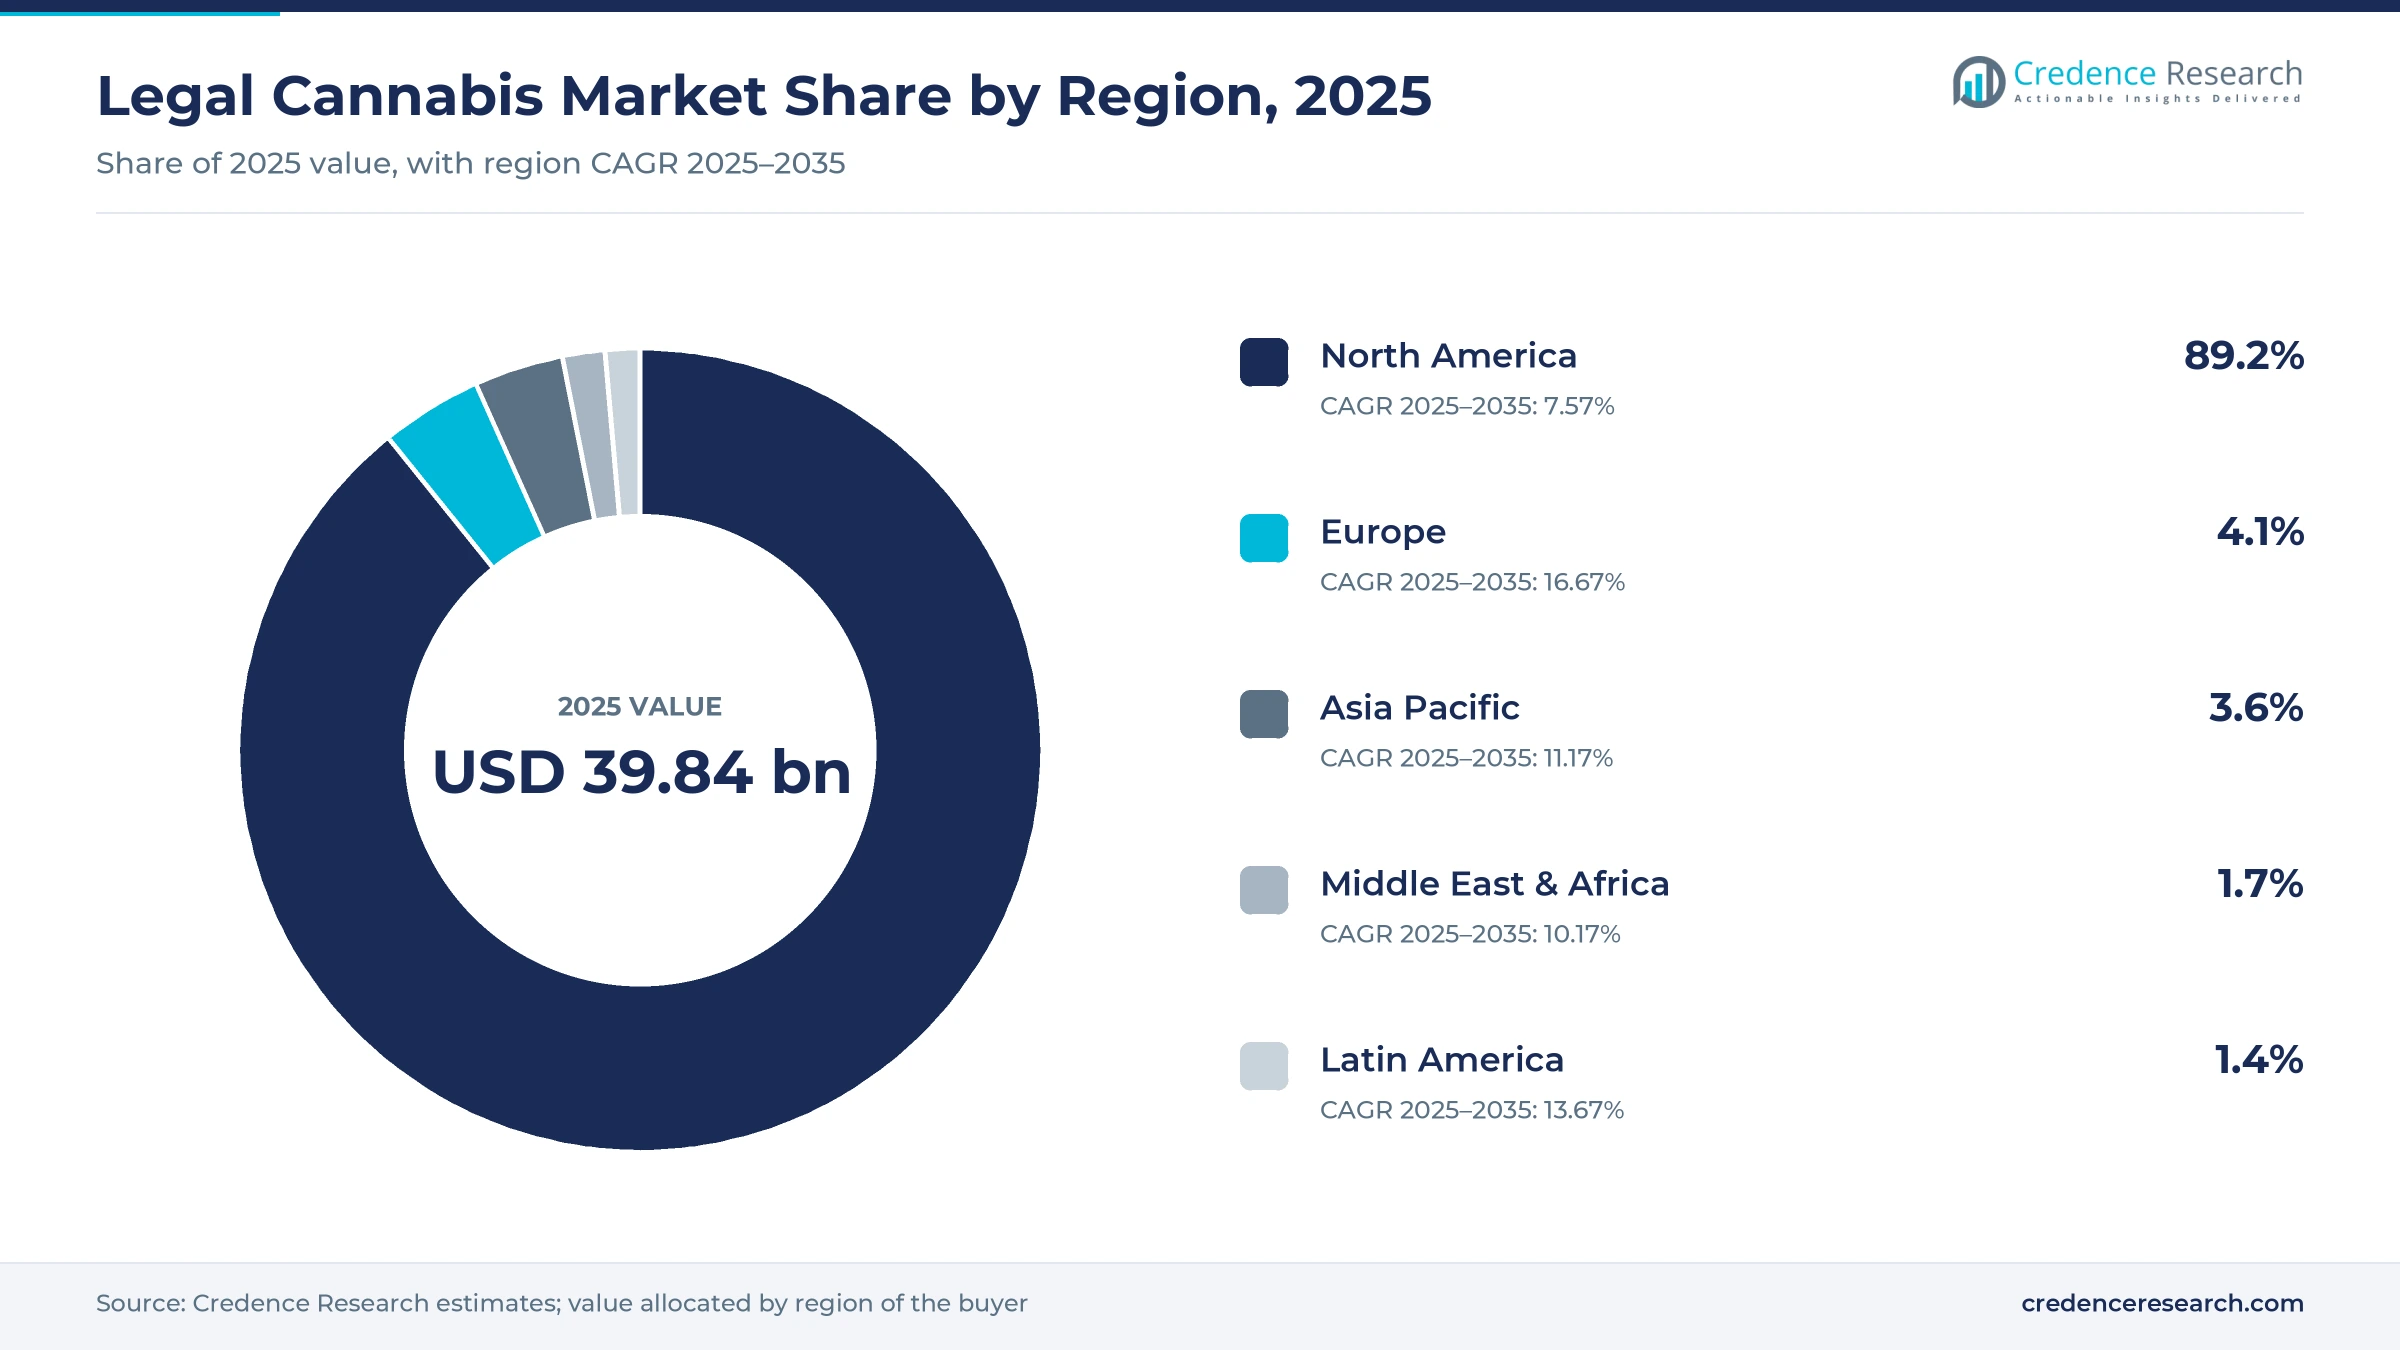
- North America held 89.2% of 2025 legal cannabis sales, the largest regional share, because U.S. state programs and Canada account for most licensed retail.
- Adult-use sales accounted for 73.0% of 2025 value, the largest market type, as most U.S. and Canadian buyers now shop in recreational stores.
- A federal rule effective April 28, 2026, moved state-licensed medical marijuana to Schedule III, easing the tax rule that blocks normal business deductions.
- Edibles and beverages grow fastest at 11.77% a year through 2035, while multi-state operators consolidate licenses as debt, tax and price compression squeeze smaller sellers.
Adult-use and flower lead while edibles grow fastest
Adult-use leads by market type and grows faster
Based on market type, the market is categorized into adult-use and medical cannabis. Adult-use led with 73.0% of 2025 value and is also the faster-growing type at 8.88% a year, because most legal sales in the U.S. and Canada now go to recreational buyers and many patients switch to adult-use stores once they open. Medical sales remain large in Florida, Pennsylvania, Germany, Israel and Australia, and Schedule III treatment supports state medical licensees from 2026.
Flower leads the product mix while edibles and beverages grow fastest
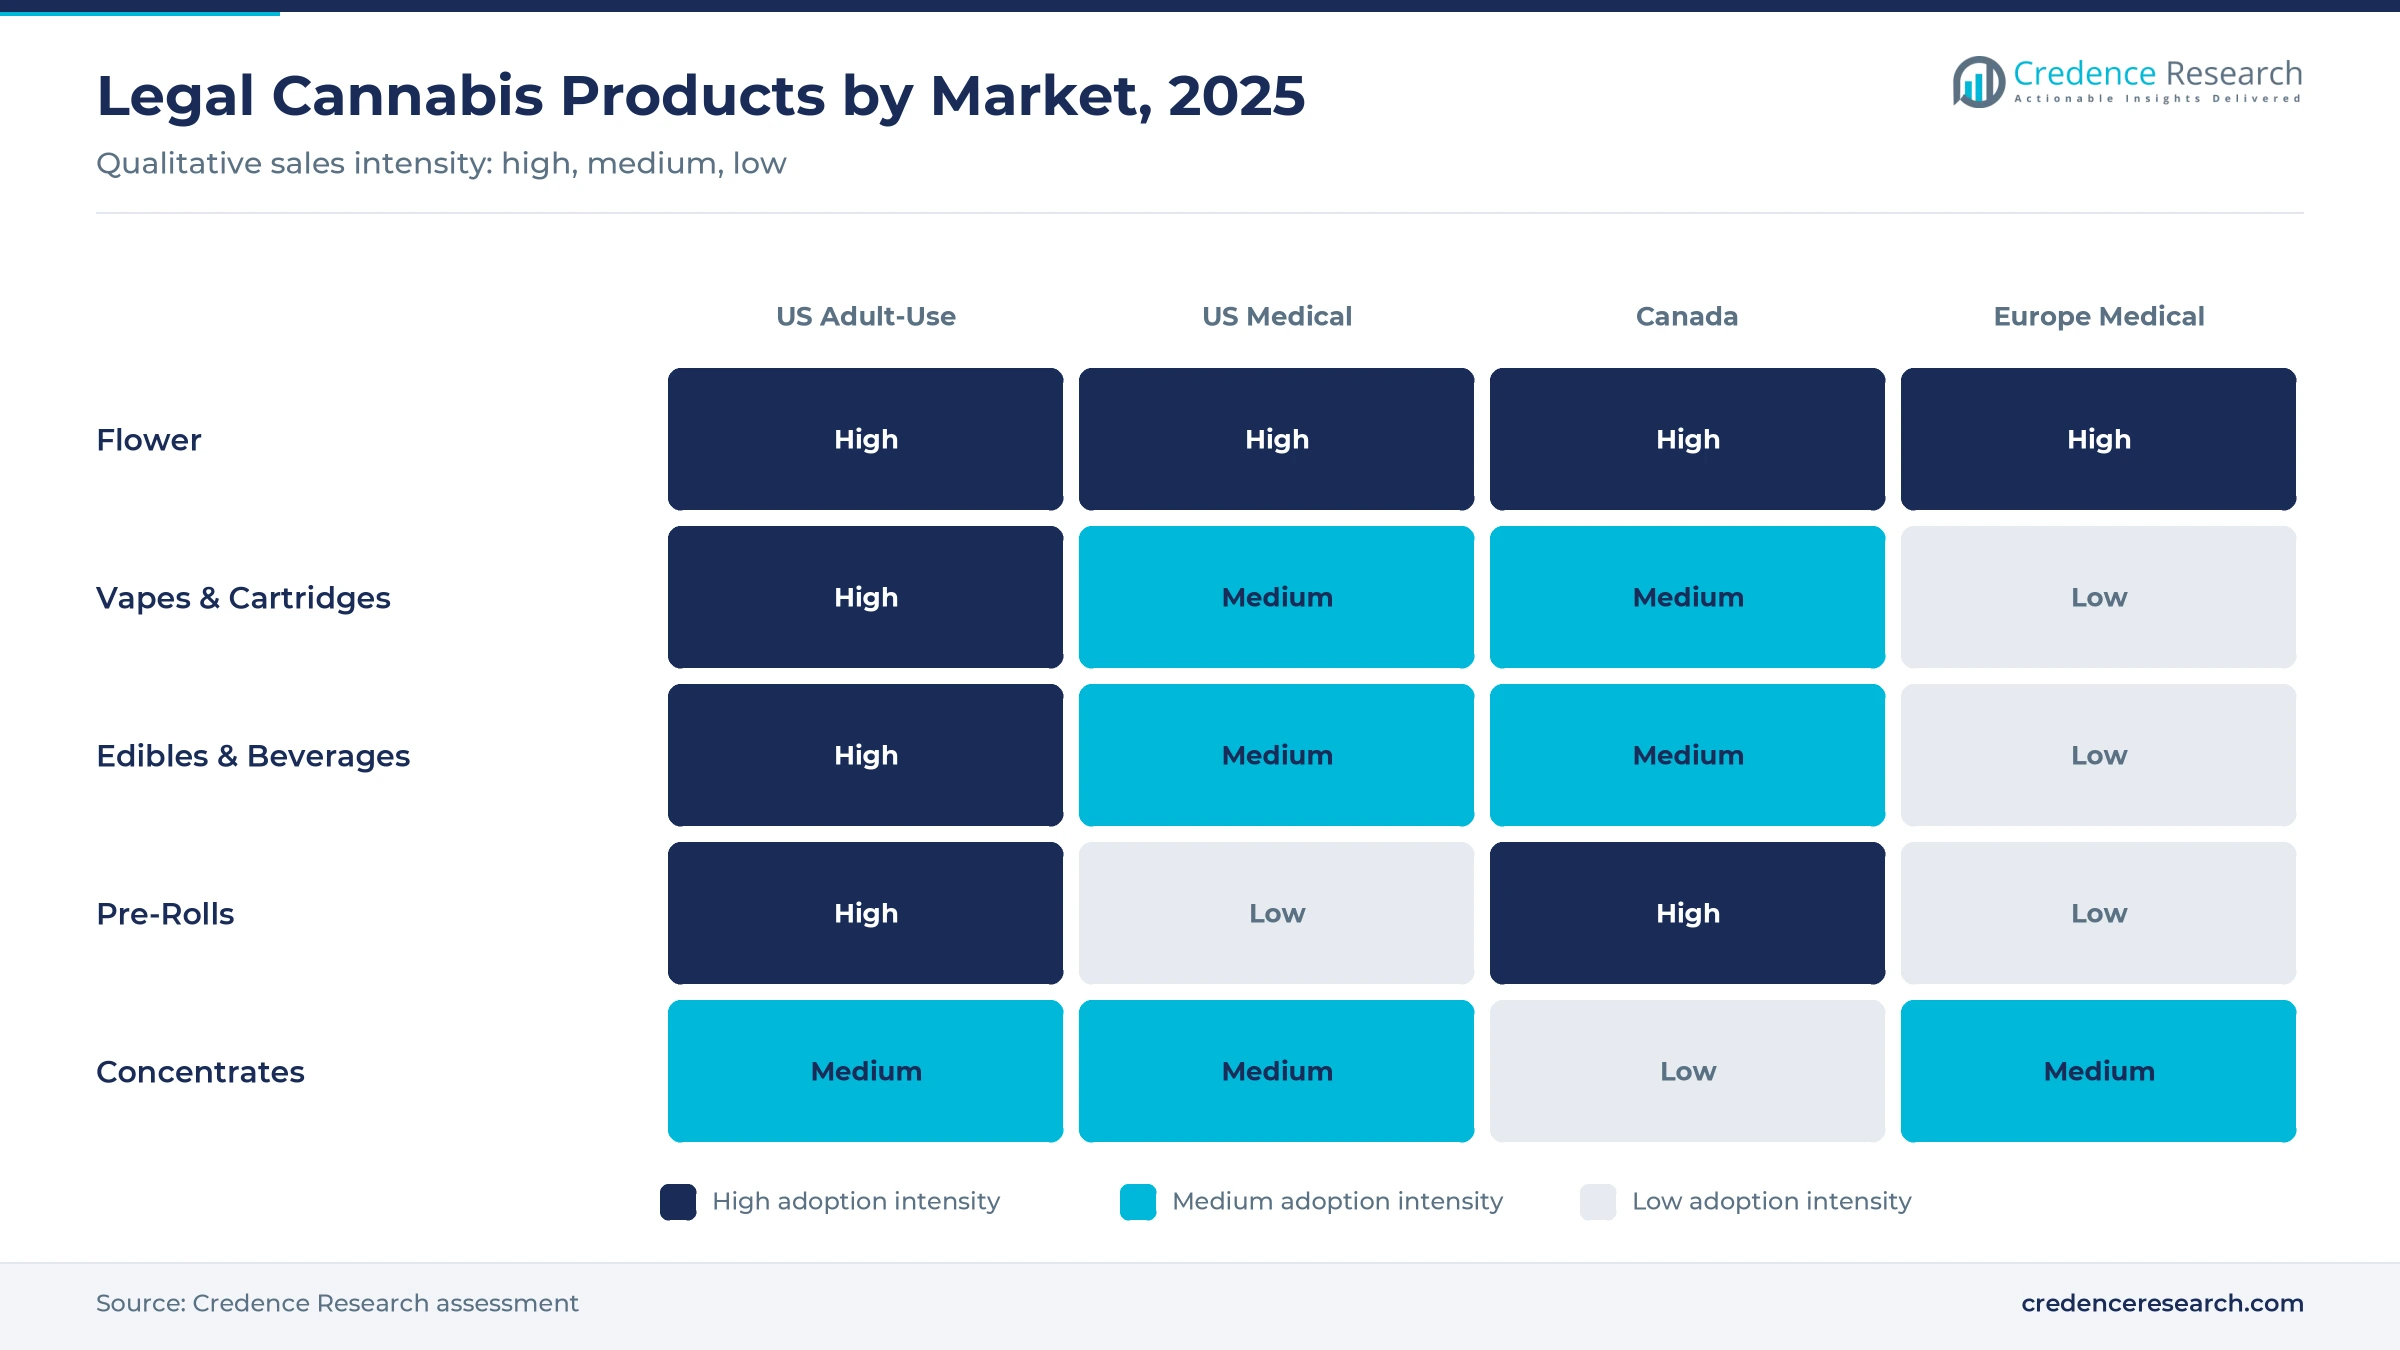
Based on product, the market is categorized into flower, vapes and cartridges, edibles and beverages, pre-rolls and concentrates. Flower led with 41.5% of 2025 value, as it remains the cheapest and most familiar format in every legal market. Edibles and beverages grow fastest at 11.77% a year because low-dose gummies and cannabis drinks bring in consumers who do not smoke. Infused pre-rolls and live-resin vapes also gain share from flower.
| Segment Group | Leading Sub-segment | Share, 2025 | Fastest-growing Sub-segment | CAGR, 2025–2035 |
|---|---|---|---|---|
| By Market Type | Adult-Use | 73.0% | Adult-Use | 8.88% |
| By Product | Flower | 41.5% | Edibles & Beverages | 11.77% |
Request a Free Sample
Fill in your details and we'll send you a free sample report.
- Sample data tables & charts
- Research methodology
Schedule III, new states and German prescriptions lift sales
Schedule III status frees cash for U.S. medical operators
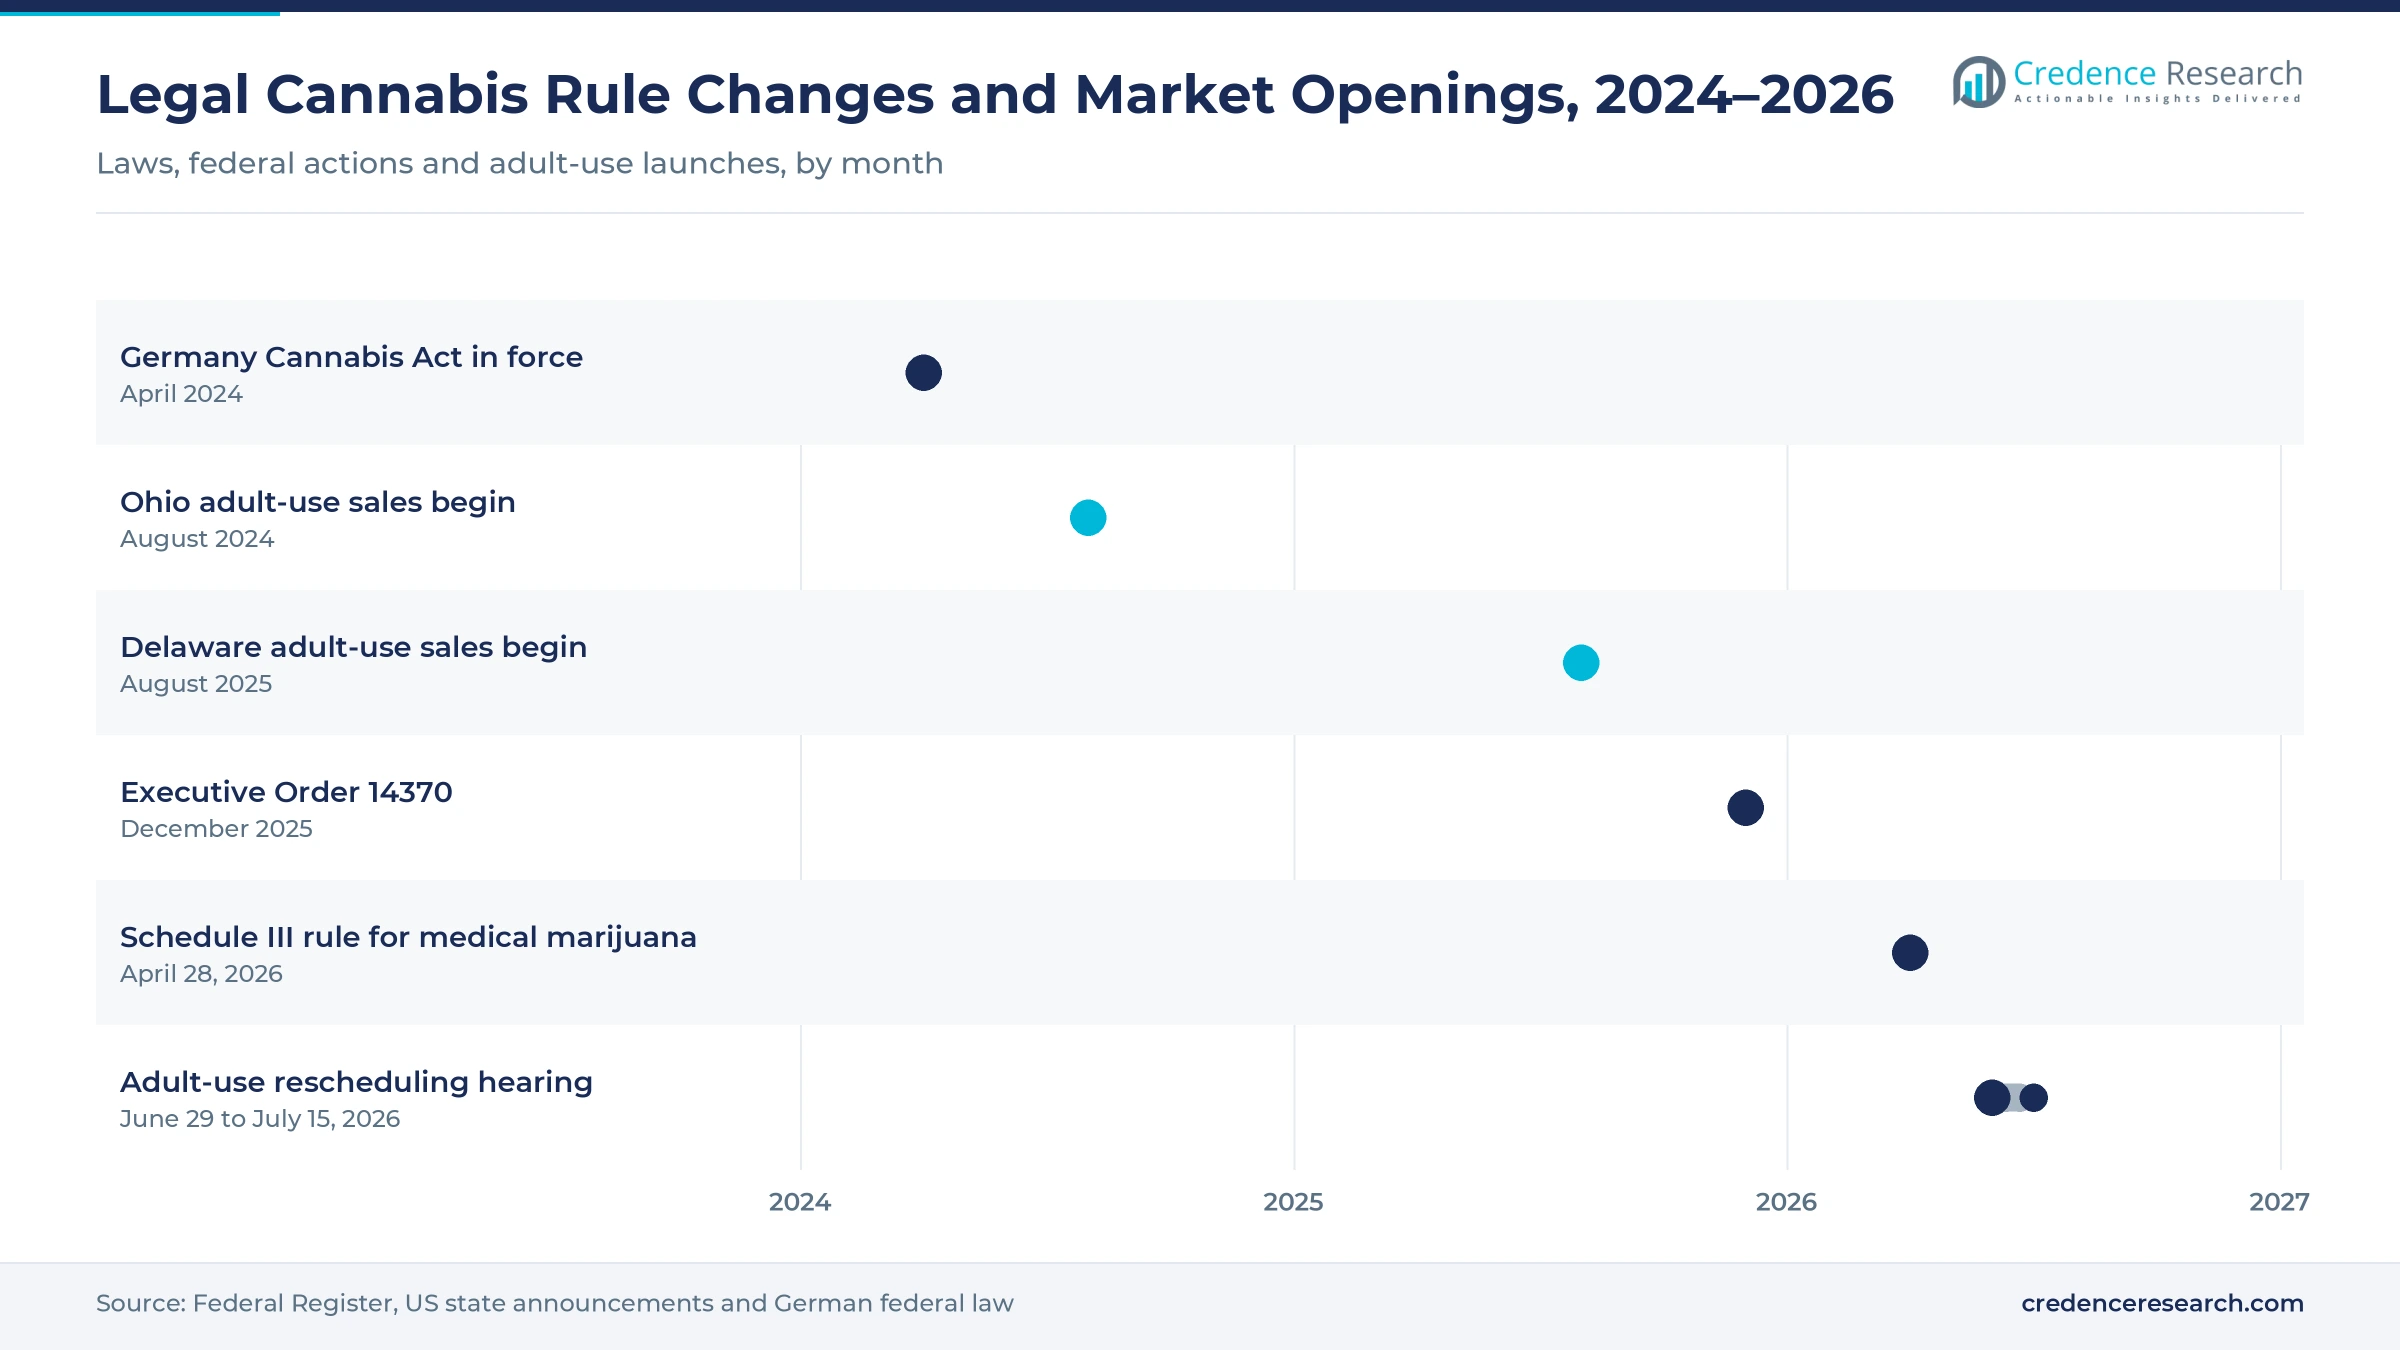
U.S. federal policy is the largest swing factor, and in December 2025, Executive Order 14370 directed the attorney general to complete rescheduling quickly. A final rule in the Federal Register then placed FDA-approved marijuana products and state-licensed medical marijuana in Schedule III from April 28, 2026, with an expedited registration route. For those medical operators, Schedule III lifts the federal tax rule that blocks normal business deductions, freeing cash that operators can spend on stores, products and prices. A hearing on adult-use rescheduling ran from June 29 to July 15, 2026.
New adult-use states pull sales into the legal channel
New adult-use states still add demand, though more slowly than in the last decade. Ohio started adult-use sales in August 2024 and Delaware on Aug. 1, 2025, and Minnesota is building out its licensed store network. Each new state launch shifts purchases from the illicit market and from neighboring states into licensed adult-use stores, which keeps adult-use the larger and faster-growing market type.
Canada keeps taking share from illicit sellers
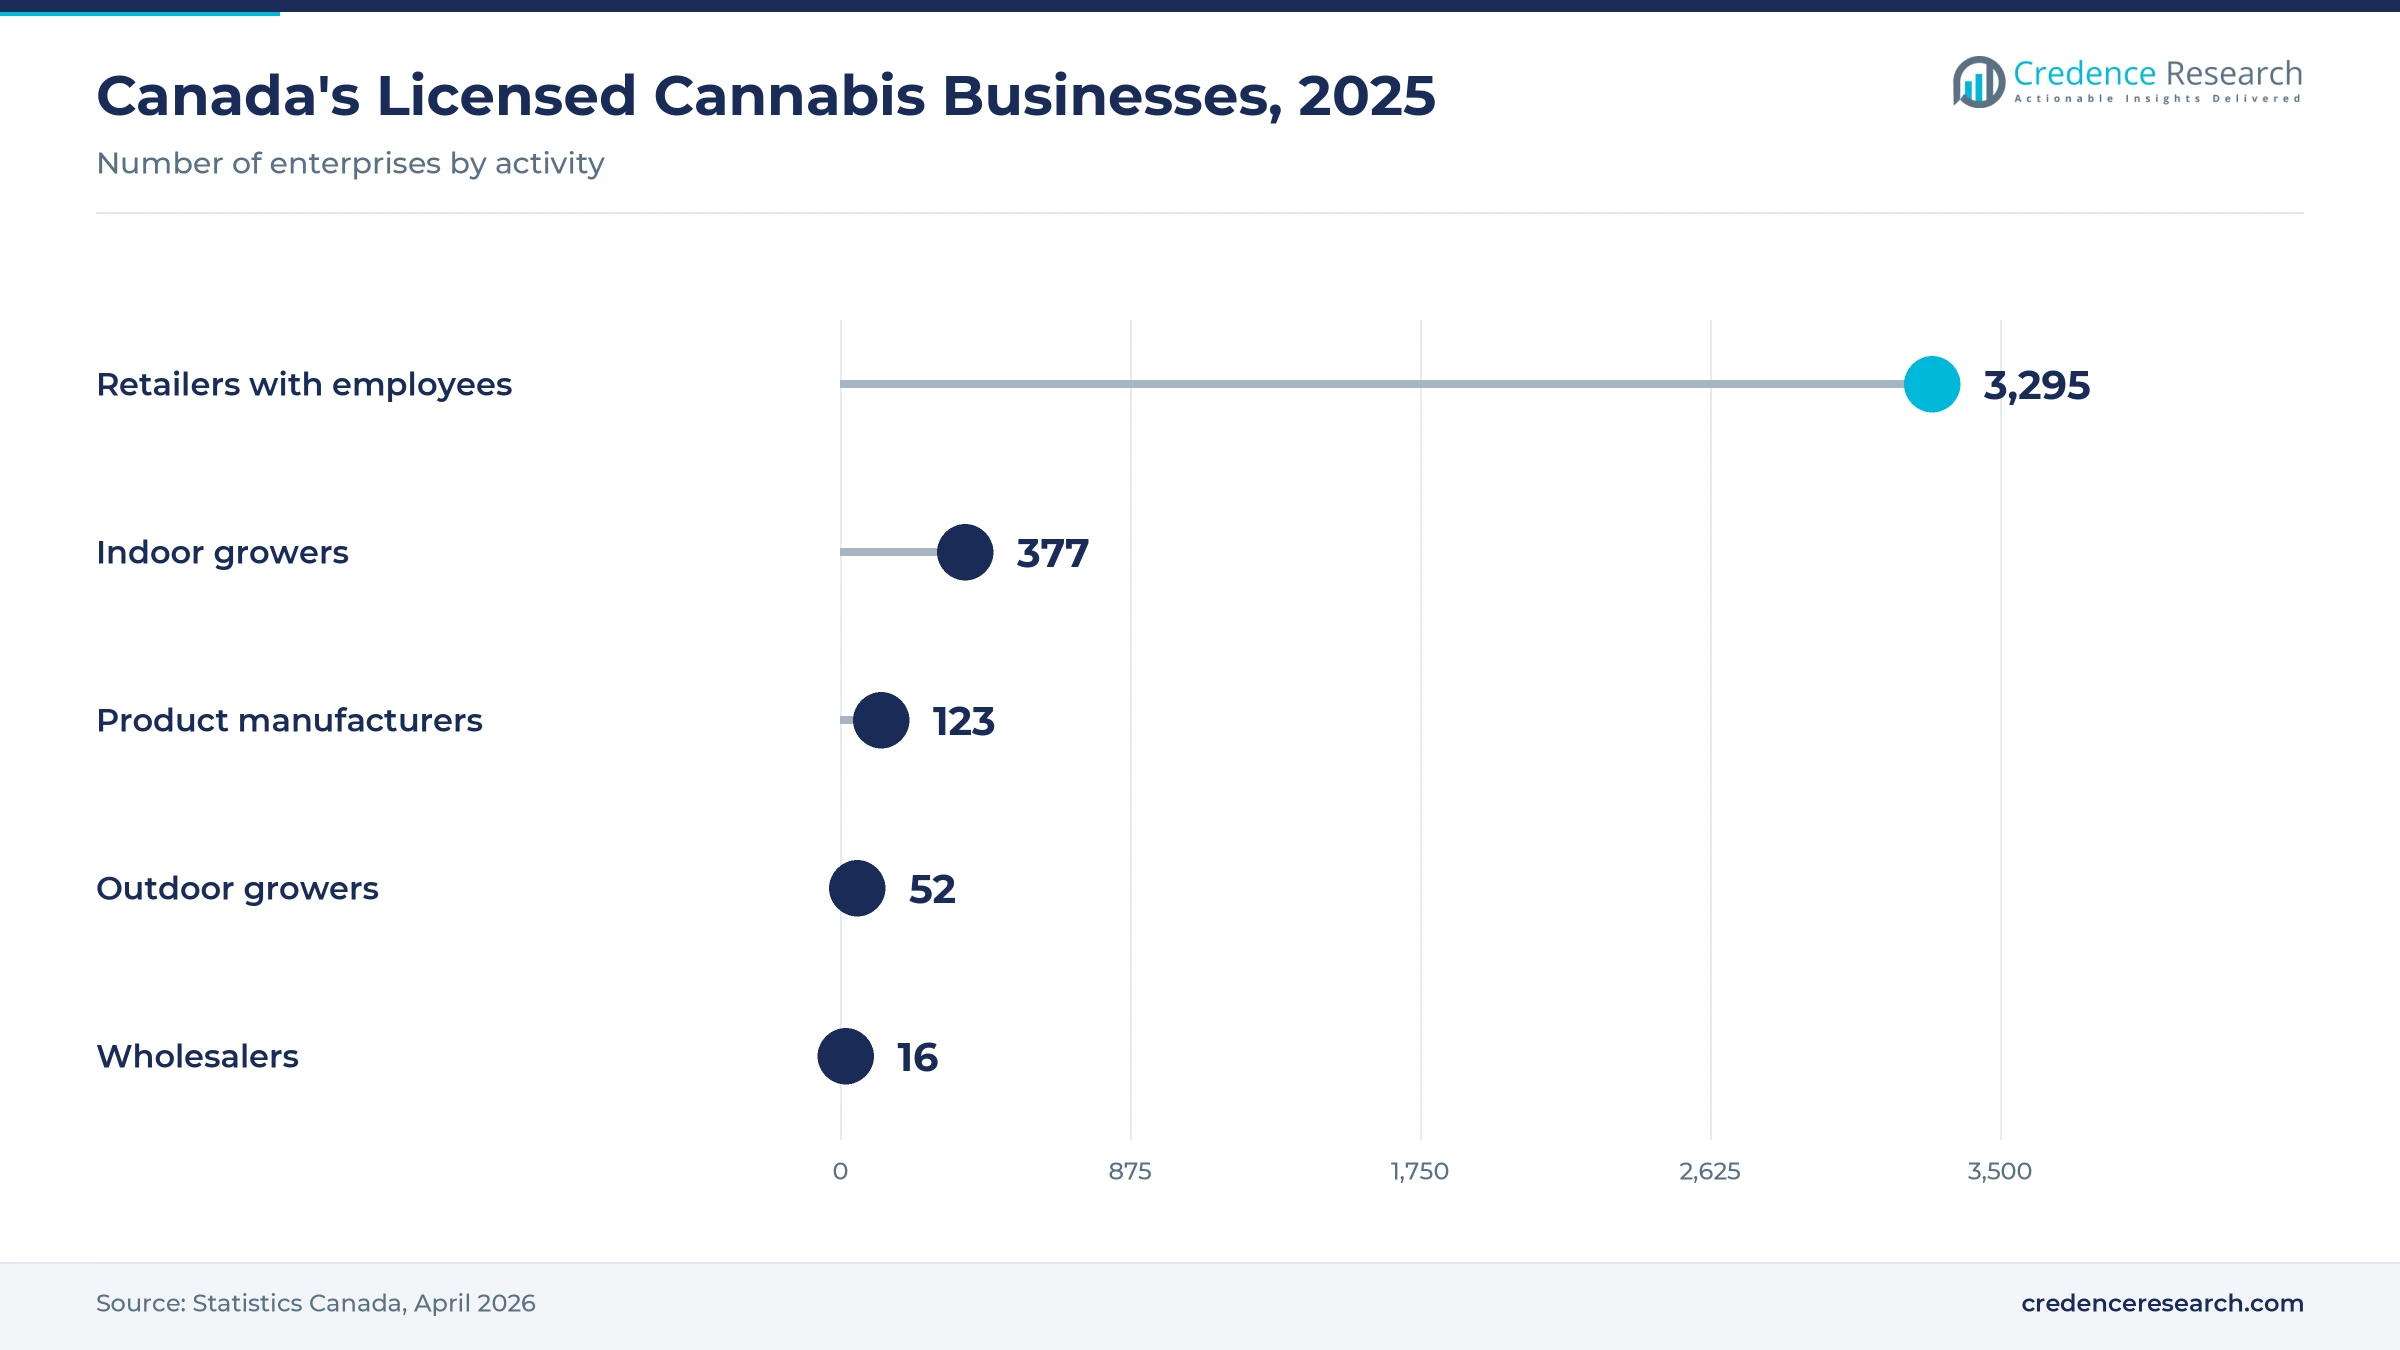
Canada shows how a mature legal market grows, as Statistics Canada reports that cannabis sales rose 6.1% to CAD 5.5 billion in the 2024/2025 fiscal year and 37.1% over three years, while governments collected CAD 2.5 billion in cannabis revenue. The country had 3,295 cannabis retail businesses with employees at the end of 2025, and 51.4% of retailers were small shops with 1 to four employees. However, falling prices and a crowded store network now hold Canadian sales growth to single digits.
Germany opens Europe's largest medical cannabis market
Germany's Cannabis Act took cannabis off the narcotics list in April 2024, making medical prescriptions easier to obtain and allowing home growing and non-profit clubs. Medical imports and telemedicine prescriptions rose sharply after the change, and other EU states are watching the German results. As a result, Europe is the fastest-growing region, building from a 4.1% share of 2025 value. Producers in Canada, Portugal and Germany that meet EU good manufacturing practice standards supply most of that demand.
Easy-dose formats and falling prices reshape store sales
Consumers shift from flower toward convenient formats
Flower still leads, but consumers are moving to pre-rolls, vapes, gummies and drinks that are easier to dose and use discreetly. Infused pre-rolls lead growth within pre-rolls, while live-resin and all-in-one vapes lift the vape category. Edibles and beverages grow fastest at 11.77% a year, so brands offering consistent low doses gain shelf space, while flower growers face pressure to add premium lines.
Price compression caps revenue in mature markets
In Canada and many older U.S. markets, prices per gram have fallen for several years as cultivation capacity outran demand. Lower prices win customers from illicit sellers but cap revenue growth, which is why North America grows at 7.57% a year, below the global rate. Producers respond with both premium craft lines and value brands, while weaker operators sell licenses or close, adding to multi-state operator consolidation.
Pharmacy and telemedicine models for medical cannabis open an opportunity
In Germany, Australia and the United Kingdom, patients increasingly get prescriptions online and receive products from pharmacies. That model resembles specialty pharmaceuticals more than retail, with standardized products and doctor oversight, so suppliers with EU good manufacturing practice certification and consistent cannabinoid profiles can win the channel. If larger EU states follow Germany, Europe's share would rise steadily, and Asia Pacific, growing at 11.17% a year, could follow through Australia.
Pennsylvania, pilot programs and hemp rules offer an opportunity
Pennsylvania, the largest medical-only U.S. state, and several states with pending adult-use bills are the biggest near-term prizes, while Switzerland and the Netherlands run regulated adult-use pilots in Europe. Closing the hemp loophole would also push delta-8 and hemp THC drink demand back into licensed stores. Each of these openings favors operators with licenses and capital ready.
Illicit supply, layered taxes and hemp loopholes cap revenue
Illicit sellers still undercut licensed prices
A large share of cannabis is still bought outside the legal channel, especially in states with high taxes or few stores. Illicit sellers avoid excise and sales taxes and undercut licensed prices, limiting how much consumption reaches regulated stores and squeezing licensed margins. States respond by licensing more stores, adjusting tax rates and enforcing against unlicensed shops, and Canada's 3,295 licensed retail businesses show how wider access helps.
Layered taxes keep many U.S. operators unprofitable
State excise, local and sales taxes raise shelf prices well above illicit prices in some states. Until broader rescheduling, adult-use operators also face federal rules blocking normal business deductions, and high effective tax rates leave many U.S. operators unprofitable, weakening investment and adding distressed license sales. Medical licensees gained relief from April 28, 2026, and the June to July 2026 hearing will decide whether adult-use sellers follow.
Federal limits raise the cost of capital
Adult-use cannabis remains in Schedule I while the DEA completes its review, so banks and payment networks stay cautious, interstate trade is banned and U.S. operators cannot list on major U.S. exchanges. These limits raise capital costs and slow expansion for multi-state operators such as Curaleaf, Trulieve and Green Thumb Industries. Operators manage with state-by-state supply chains and stronger balance sheets, but interstate commerce still requires congressional action.
Intoxicating hemp products compete at lower tax
Intoxicating hemp-derived products such as delta-8 and hemp THC drinks are sold outside cannabis licenses in many states. They compete with licensed edibles and beverages at lower tax, taking sales from the fastest-growing product category and pressuring licensed beverage makers on price. That is why licensed brands and state regulators push for federal and state limits on the hemp loophole.
U.S. and Canadian stores lead as Germany lifts Europe
| Region | Share, 2025 | CAGR, 2025–2035 |
|---|---|---|
| North America | 89.2% | 7.57% |
| Europe | 4.1% | 16.67% |
| Asia Pacific | 3.6% | 11.17% |
| Middle East & Africa | 1.7% | 10.17% |
| Latin America | 1.4% | 13.67% |
North America draws most legal sales from U.S. state programs and Canada
North America held 89.2% of 2025 value and grows at 7.57% a year. The United States supplies most of the region's value through state-licensed adult-use and medical programs led by California, Michigan, Florida, Illinois and New York, with Ohio and Delaware adding sales. Canada adds steady federally legal sales across all provinces, with CAD 5.5 billion in the 2024/2025 fiscal year. Mexico, by contrast, has no regulated cannabis retail market yet.
Europe grows fastest as Germany opens its medical market
Europe held 4.1% of 2025 value and is the fastest-growing region at 16.67% a year. Germany is the largest market after its April 2024 law change, with prescriptions, imports and pharmacy sales rising fast. The United Kingdom, Poland and Italy run medical programs, while Switzerland and the Netherlands test regulated adult-use supply in pilots. EU good manufacturing practice certification is the main barrier for suppliers, which favors established Canadian, Portuguese and German producers.
Asia Pacific is a prescription-based region led by Australia
Asia Pacific held 3.6% of 2025 value and grows at 11.17% a year. Australia has the largest prescription market in the region, with online prescribing and pharmacy dispensing supporting patient growth. Thailand narrowed flower sales to prescriptions in 2025 after a period of open retail, and New Zealand runs a medical scheme. Most of Asia keeps strict bans, so growth depends on medical access in a few countries.
Middle East & Africa and Latin America rely on medical programs and export growers
The Middle East & Africa held 1.7% of 2025 value and grows at 10.17% a year. Israel has one of the world's oldest medical cannabis programs, South Africa allows private use, and several African states license cultivation mainly for export. Latin America held 1.4% and grows at 13.67% a year. Uruguay runs a legal adult-use market through pharmacies and clubs, while Colombia, Brazil and Argentina have medical programs and Colombia exports cultivated cannabis and extracts.
A Schedule III rule and two new adult-use states, 2024–2026
| Development | Status and market relevance |
|---|---|
| In April 2026, a Drug Enforcement Administration final rule took effect on April 28, placing FDA-approved marijuana products and state-licensed medical marijuana in Schedule III and introducing an expedited registration route. | In force. First federal relief for state medical operators. |
| In April 2026, Statistics Canada announced that cannabis sales rose 6.1% to CAD 5.5 billion in the 2024/2025 fiscal year. | Published. Confirms slower, steady growth in Canada. |
| In December 2025, Executive Order 14370 directed the attorney general to complete Schedule III rescheduling as fast as federal law allows. | Signed. Started the federal rule change. |
| In August 2025, Delaware launched adult-use cannabis sales on Aug. 1. | Launched. Adds another U.S. adult-use state. |
| In August 2024, Ohio launched adult-use cannabis sales. | Launched. Opens a large Midwest market. |
Low-dose formats, pharmacy quality and federal rules ahead
- Formulation advances such as better emulsions and precise low-dose gummies make beverages and edibles more consistent, supporting the fastest-growing product category at 11.77% a year.
- Extraction and vapes improve as live-resin extraction and all-in-one vape devices lift quality and convenience, helping vapes and concentrates hold value as flower prices fall.
- Medical quality standards such as EU good manufacturing practice certification and standardized cannabinoid profiles let producers sell to pharmacies in Germany, the United Kingdom and Australia.
- Telemedicine through online consultations and e-prescriptions brings medical patients to pharmacies faster, especially in Germany and Australia.
- Regulation sets the tax and capital terms for U.S. operators through Schedule III status for state-licensed medical marijuana from April 28, 2026, and the pending adult-use decision.
Need a Custom Version of This Report?
Tailor the scope, geography, or segments to your exact requirements.
- Custom geography or segment scope
- Direct access to our analyst team
Multi-state operators and Canadian producers split sales
The legal cannabis market is fragmented because U.S. federal law blocks interstate trade, so no company sells in every state and thousands of single-state brands compete with a few large operators. U.S. multi-state operators, including Curaleaf, Trulieve, Green Thumb Industries, Verano Holdings and Cresco Labs, run the largest store networks; Trulieve leads in Florida's medical market, and Green Thumb and Cresco are strong in Illinois and Pennsylvania. Canadian licensed producers such as Canopy Growth, Tilray Brands, SNDL and Organigram supply provincial stores and fight price compression with brand portfolios and exports. Tilray and Aurora Cannabis also ship medical cannabis to Europe. Entry barriers are license caps in limited-license states and EU good manufacturing practice certification, while packaging rules shape costs. No company reports legal cannabis sales on a comparable basis, so no share ranking is given.
Legal cannabis operators and their roles
| Company | Type | Role in the market |
|---|---|---|
| Curaleaf | U.S. multi-state operator | One of the widest store footprints across states |
| Trulieve | U.S. multi-state operator | Leader in Florida's medical market |
| Green Thumb Industries | U.S. multi-state operator | Strong in Illinois and Pennsylvania |
| Verano Holdings | U.S. multi-state operator | Multi-state store network and brands |
| Cresco Labs | U.S. multi-state operator | Strong in Illinois and Pennsylvania |
| Canopy Growth | Canadian licensed producer | Brands for provincial stores |
| Tilray Brands | Canadian licensed producer | Canadian brands plus medical sales in Germany and other European markets |
| SNDL | Canadian licensed producer | Among the largest Canadian licensed producers |
| Organigram | Canadian licensed producer | Brands for provincial stores |
| Aurora Cannabis | Medical exporter | One of the larger medical cannabis exporters to Europe |
Tax relief and European prescriptions outweigh new votes
Credence Research's view is that legal cannabis is a large but slow-maturing retail category, and that federal tax relief and Europe's medical opening, more than new state votes, set its value through 2035. The largest new revenue lies in edibles, beverages and pre-rolls in U.S. adult-use stores and in pharmacy-dispensed medical cannabis in Germany. Operators with strong balance sheets and medical licenses are best placed, while the main risks are continued price compression and a disappointing adult-use rescheduling decision.
How Credence Research sized licensed cannabis sales
The report uses 2025 as the base year and forecasts to 2035, with CAGR calculated over 2025–2035. Market values come from Credence Research's market model, built from legal sales reported by U.S. state regulators, Canadian statistics and national medical programs, with patient numbers, licensed outlets and import permits used where no sales data exist; segment and regional splits are Credence Research estimates. Supporting evidence comes from regulator data, federal rules, statistics agencies and company filings, though unpublished data in some countries limits precision.
New formats and medical pharmacies set the pace through 2035
Through 2035, legal cannabis sales will shift further from flower toward edibles, beverages, pre-rolls and vapes, while medical demand moves toward pharmacy and telemedicine models in Europe and Australia. North America will remain the largest region, but Europe will gain share if more EU states follow Germany. Consolidation among multi-state operators will continue as weaker sellers exit. The pace will depend on whether adult-use cannabis follows medical cannabis into Schedule III, how states tax licensed products and whether hemp rules close the loophole.
Frequently Asked Questions
What was the size of the legal cannabis market in 2025?
What is the forecast value and CAGR of the legal cannabis market?
What is driving legal cannabis sales?
Which region holds the largest share of the legal cannabis market?
Which market type and product lead the legal cannabis market?
Has U.S. cannabis been rescheduled?
Who are the major companies in the legal cannabis market?
What challenges could slow the legal cannabis market?
Table of Content
Chapter 1 Market Segmentation
- 1.1 Segmentation Framework
- 1.1.1 Product and Service Classification
- 1.1.2 Application and End-Use Classification
- 1.1.3 Technology and Solution Classification
- 1.1.4 Customer and Distribution Channel Classification
- 1.1.5 Geographic Segmentation
- 1.1.6 Market Segment Definitions and Boundaries
- 1.2 By Market Type
- 1.2.1 Adult-Use
- 1.2.2 Medical
- 1.3 By Product
- 1.3.1 Flower
- 1.3.2 Vapes & Cartridges
- 1.3.3 Edibles & Beverages
- 1.3.4 Pre-Rolls
- 1.3.5 Concentrates
Chapter 2 Introduction
- 2.1 Report Objectives and Scope
- 2.2 Product Definition and Industry Terminology
- 2.3 Market Inclusions and Exclusions
- 2.4 Research Process
- 2.4.1 Primary Research and Expert Interviews
- 2.4.2 Secondary Research and Source Review
- 2.4.3 Top-Down and Bottom-Up Estimation
- 2.4.4 Data Triangulation and Verification
- 2.5 Market Size Measurement Basis
- 2.5.1 2025: USD 39.84 billion → 2035: USD 89.25 billion
- 2.6 Historical and Forecast Reference Periods
- 2.6.1 Historical Period: 2018-2025
- 2.6.2 Base Year: 2025
- 2.6.3 Forecast Period: 2025-2035
- 2.7 Research Assumptions and Limitations
Chapter 3 Executive Summary
- 3.1 Market Snapshot and Key Findings
- 3.2 Base-Year Market Size, 2025
- 3.3 Forecast Market Size, 2035
- 3.4 Revenue and Volume Growth Outlook
- 3.5 Key Demand and Supply Indicators
- 3.6 Leading Market Segments
- 3.7 Fastest-Growing Market Opportunities
- 3.8 Regional Performance Highlights
- 3.9 Technology and Industry Transformation
- 3.10 Competitive Landscape Summary
- 3.11 Analyst View and Strategic Implications
Chapter 4 Global Legal Cannabis Market Trends and Developments
- 4.1 Historical Industry Development, 2018-2025
- 4.2 Recent Market Trends and Developments
- 4.3 Demand and Customer Behavior Trends
- 4.4 Technology and Product Innovation
- 4.5 Artificial Intelligence, Automation and Digitalization
- 4.6 Local Manufacturing and Supply Chain Realignment
- 4.7 Industry Partnerships, Mergers and Acquisitions
- 4.8 Sustainability and Circular Economy Developments
- 4.9 Government and Private Sector Investment Trends
- 4.10 Emerging Business Models and Commercialization
- 4.11 Industry Developments and Announcements
Chapter 5 Global Legal Cannabis Market Production, Supply and Demand Analysis
- 5.1 Demand Trend and Consumption Analysis, 2018-2025
- 5.2 Demand Forecast, 2025-2035
- 5.3 Production and Output Trend, 2018-2025
- 5.4 Production and Output Forecast, 2025-2035
- 5.5 Installed Capacity and Capacity Utilization
- 5.6 Company-Wise Production Plants and Statistics
- 5.6.1 Installed Production Capacity
- 5.6.2 Actual Production
- 5.6.3 Planned Capacity and Expansion Targets
- 5.7 Supply Chain Structure and Procurement Trends
- 5.8 Supply-Demand Gap and Bottlenecks
- 5.9 Import Dependence and Sourcing Structure
- 5.10 Contract Manufacturing and Outsourcing
- 5.11 Regional Supply and Demand Concentration
Chapter 6 Global Legal Cannabis Market Pricing Analysis
- 6.1 Pricing Structure and Measurement
- 6.2 Historical Pricing Trends, 2018-2025
- 6.3 Pricing Outlook, 2025-2035
- 6.4 Average Selling Price and Unit Economics
- 6.5 Pricing by Product and Market Segment
- 6.6 Geographic Pricing Differences
- 6.7 Key Input, Energy, Labor and Logistics Costs
- 6.8 Contract Pricing and Purchasing Models
- 6.9 Pricing Sensitivity and Competitive Positioning
- 6.10 Price, Margin and Profitability Implications
Chapter 7 Global Legal Cannabis Market Dynamics
- 7.1 Market Growth Drivers
- 7.1.1 Demand-Side Drivers
- 7.1.2 Technology and Innovation Drivers
- 7.1.3 Infrastructure and Investment Drivers
- 7.1.4 Regulatory and Policy Drivers
- 7.2 Market Restraints
- 7.2.1 Cost and Affordability Constraints
- 7.2.2 Technology and Adoption Barriers
- 7.2.3 Supply Chain and Operational Constraints
- 7.3 Market Challenges
- 7.3.1 Competitive Pressure and Margin Erosion
- 7.3.2 Skills, Infrastructure and Implementation Gaps
- 7.4 Emerging Market Opportunities
- 7.5 Market Dynamics Impact and Time-Horizon Assessment
Chapter 8 Global Legal Cannabis Value Chain Analysis
- 8.1 Industry Value Chain Overview
- 8.2 Upstream Suppliers and Critical Inputs
- 8.3 Technology and Component Providers
- 8.4 Manufacturing or Service Delivery
- 8.5 Distribution, Channel Partners and Integrators
- 8.6 Downstream Applications and End Users
- 8.7 Value Addition and Profit Pools
- 8.8 Vertical Integration and Outsourcing
- 8.9 Supplier Concentration and Risk
- 8.10 Supply Chain Localization and Resilience
Chapter 9 Global Legal Cannabis Market Regulations and Policies
- 9.1 Relevant Laws, Standards and Compliance Frameworks
- 9.2 Product, Service, Safety and Quality Requirements
- 9.3 Government Policies, Incentives and Subsidies
- 9.4 Imports, Exports and Trade Barriers
- 9.5 Public Procurement and Local Content Requirements
- 9.6 Environmental and Sustainability Compliance
- 9.7 Upcoming Policy Changes and Market Implications
Chapter 10 Global Legal Cannabis Market Hotspots and Opportunities
- 10.1 Market Opportunity Mapping and Growth Hotspots
- 10.2 High-Growth Applications and Customer Groups
- 10.3 Underserved Markets and White-Space Opportunities
- 10.4 Emerging Technology and Product Opportunities
- 10.5 New Capacity and Investment Hotspots
- 10.6 Market Entry and Expansion Opportunities
- 10.7 Distribution and Partnership Opportunities
- 10.8 Near-Term and Long-Term Commercial Potential
- 10.9 Opportunity Attractiveness and Execution Risks
Chapter 11 Global Legal Cannabis Market Outlook, 2025-2035
- 11.1 Market Size and Analysis
- 11.1.1 Revenue (Market Measurement: 2025: USD 39.84 billion → 2035: USD 89.25 billion)
- 11.1.2 Market Volume and Quantity Sold
- 11.1.3 Historical Market Size, 2018-2025
- 11.1.4 Base-Year Market Size, 2025
- 11.2 Market Forecast, 2025-2035
- 11.2.1 Revenue Forecast to 2035
- 11.2.2 Volume Forecast to 2035
- 11.2.3 CAGR and Year-on-Year Growth
- 11.2.4 Incremental Revenue Opportunity
- 11.3 Forecast Assumptions and Scenario Analysis
- 11.3.1 Base-Case Forecast
- 11.3.2 Optimistic and Conservative Scenarios
- 11.3.3 Technology, Pricing and Policy Sensitivities
- 11.4 Market Attractiveness and Growth Outlook
Chapter 12 Global Legal Cannabis Market Segmentation and Outlook
- 12.1 Segmentation Summary and Market Shares, 2025
- 12.2 Largest and Fastest-Growing Segments
- 12.3 By Market Type - Market Size and Forecast, 2025-2035
- 12.3.1 Segment Definition and Scope
- 12.3.2 Historical Market Size, 2018-2025
- 12.3.3 Revenue Forecast, 2025-2035
- 12.3.4 Volume Forecast, 2025-2035
- 12.3.5 Base-Year Market Share, 2025
- 12.3.6 Segment CAGR and Growth Drivers
- 12.3.7 Subsegment Market Size and Forecast
- 12.3.7.1 Adult-Use
- 12.3.7.2 Medical
- 12.3.8 Subsegment Pricing and Adoption Trends
- 12.3.9 Leading Suppliers and Competition
- 12.3.10 Regional Demand and Opportunities
- 12.4 By Product - Market Size and Forecast, 2025-2035
- 12.4.1 Segment Definition and Scope
- 12.4.2 Historical Market Size, 2018-2025
- 12.4.3 Revenue Forecast, 2025-2035
- 12.4.4 Volume Forecast, 2025-2035
- 12.4.5 Base-Year Market Share, 2025
- 12.4.6 Segment CAGR and Growth Drivers
- 12.4.7 Subsegment Market Size and Forecast
- 12.4.7.1 Flower
- 12.4.7.2 Vapes & Cartridges
- 12.4.7.3 Edibles & Beverages
- 12.4.7.4 Pre-Rolls
- 12.4.7.5 Concentrates
- 12.4.8 Subsegment Pricing and Adoption Trends
- 12.4.9 Leading Suppliers and Competition
- 12.4.10 Regional Demand and Opportunities
- 12.5 Segment Growth Comparison
- 12.6 Segment Attractiveness and Priority Matrix
Chapter 13 Global Legal Cannabis Geographic Market Outlook, 2025-2035
- 13.1 Regional Market Size and Share, 2025
- 13.2 Regional Market Forecast, 2025-2035
- 13.3 Regional Pricing, Production and Demand Differences
- 13.4 North America
- 13.4.1 United States
- 13.4.2 Canada
- 13.4.3 Mexico
- 13.5 Europe
- 13.5.1 Germany
- 13.5.2 France
- 13.5.3 Italy
- 13.5.4 United Kingdom
- 13.5.5 Spain
- 13.5.6 Poland
- 13.5.7 Russia
- 13.5.8 Netherlands
- 13.5.9 Belgium
- 13.5.10 Sweden
- 13.5.11 Denmark
- 13.5.12 Norway
- 13.5.13 Rest of Europe
- 13.6 Asia Pacific
- 13.6.1 China
- 13.6.2 India
- 13.6.3 Japan
- 13.6.4 South Korea
- 13.6.5 Thailand
- 13.6.6 Indonesia
- 13.6.7 Vietnam
- 13.6.8 Malaysia
- 13.6.9 Australia
- 13.6.10 Rest of Asia Pacific
- 13.7 Latin America
- 13.7.1 Brazil
- 13.7.2 Argentina
- 13.7.3 Colombia
- 13.7.4 Chile
- 13.7.5 Rest of Latin America
- 13.8 Middle East
- 13.8.1 Saudi Arabia
- 13.8.2 United Arab Emirates
- 13.8.3 Turkey
- 13.8.4 Israel
- 13.8.5 Iran
- 13.8.6 Rest of the Middle East
- 13.9 Africa
- 13.9.1 South Africa
- 13.9.2 Egypt
- 13.9.3 Nigeria
- 13.9.4 Morocco
- 13.9.5 Rest of Africa
- 13.10 Regional Investment, Policy and Supply Chain Differences
- 13.11 Regional Competitive Landscape
- 13.12 Geographic Growth Hotspots
Chapter 14 Global Legal Cannabis Technology, Innovation and Sustainability Outlook
- 14.1 Technology Landscape and Maturity
- 14.2 Product, Process and Service Innovation
- 14.3 AI, Automation and Digital Tools in the Industry
- 14.4 Technology Adoption and Performance Benchmarking
- 14.5 Innovation Pipeline and R&D Investment
- 14.6 Patent and Intellectual Property Trends
- 14.7 Energy Efficiency and Resource Management
- 14.8 Sustainability, Recycling and Circularity
- 14.9 Technology Roadmap, 2025-2035
- 14.10 Risks of Obsolescence and Technology Substitution
Chapter 15 Global Legal Cannabis Market Key Strategic Imperatives
- 15.1 Growth and Market Entry Priorities
- 15.2 High-Return Products and Segments
- 15.3 Pricing, Profitability and Cost Optimization
- 15.4 Technology Investment and Product Differentiation
- 15.5 Supply Chain Localization and Resilience
- 15.6 Distribution and Customer Acquisition
- 15.7 Partnership, Acquisition and Capacity Strategy
- 15.8 Regional Expansion Priorities
- 15.9 Short-, Medium- and Long-Term Actions
Chapter 16 Competition Outlook
- 16.1 Industry Competition Characteristics
- 16.2 Market Structure and Concentration
- 16.3 Market Share and Competitive Positioning, 2025
- 16.4 Company-Wise Revenue and Product Benchmarking
- 16.5 Production and Service Capacity Benchmarking
- 16.6 Technology, Pricing and Differentiation
- 16.7 Regional Footprint and Distribution Strength
- 16.8 Mergers, Acquisitions and Strategic Alliances
- 16.9 New Entrants and Competitive Threats
- 16.10 Porter's Five Forces and Industry Attractiveness
- 16.11 Competitive Outlook, 2025-2035
Chapter 17 Company Profiles
- 17.1 Company Coverage and Selection Criteria
- 17.2 Curaleaf
- 17.2.1 Business Description
- 17.2.2 Company Ownership and Geographic Presence
- 17.2.3 Product and Service Portfolio
- 17.2.4 Manufacturing and Operating Footprint
- 17.2.5 Production Capacity and Expansion Plans
- 17.2.6 Financial Performance and Investment
- 17.2.7 Market Share and Competitive Position
- 17.2.8 Technology and Innovation Capabilities
- 17.2.9 Strategic Alliances or Partnerships
- 17.2.10 Recent Developments
- 17.2.11 Growth Strategy and Outlook
- 17.3 Trulieve
- 17.4 Green Thumb Industries
- 17.5 Verano Holdings
- 17.6 Cresco Labs
- 17.7 Canopy Growth
- 17.8 Tilray Brands
- 17.9 SNDL
- 17.10 Organigram
- 17.11 Aurora Cannabis
- 17.12 Other Relevant Market Participants
Note: Every listed company is profiled on the structure shown under the first company. The company list is preliminary and may change based on research findings, market developments, data availability and client requirements.
Chapter 18 Disclaimer
- 18.1 Research and Forecast Disclaimer
- 18.2 Data Source and Estimation Limitations
Note: The depth of individual sections depends on data availability for this market. Volume, capacity, trade and other unit-based metrics are included where applicable.

