Market Overview
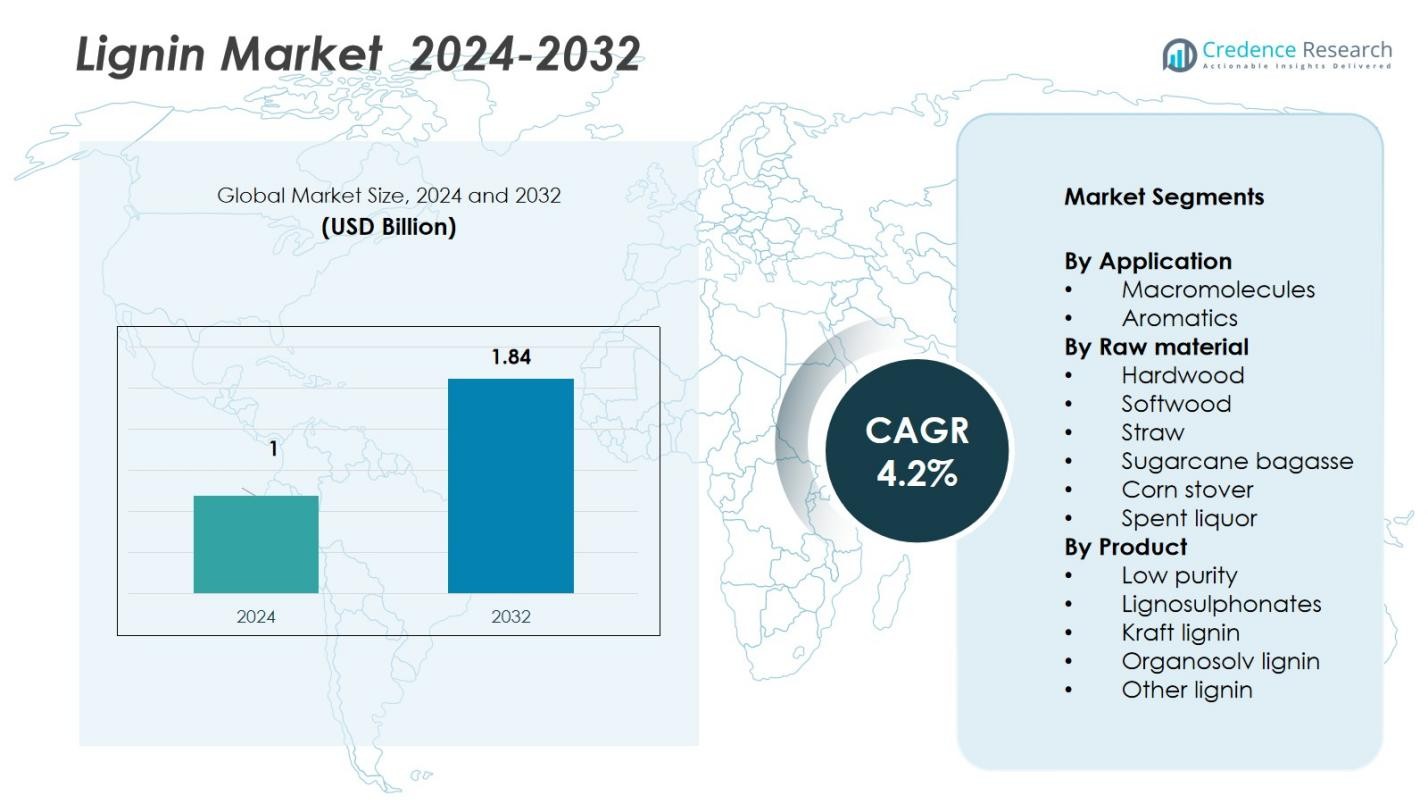
The Lignin Market was valued at USD 1 Billion in 2024 and is projected to reach USD 1.84 Billion by 2032, growing at a CAGR of 4.2% during the forecast period.
| REPORT ATTRIBUTE |
DETAILS |
| Historical Period |
2020-2023 |
| Base Year |
2024 |
| Forecast Period |
2025-2032 |
| Lignin Market Size 2024 |
USD 1 Billion |
| Lignin Market, CAGR |
4.2% |
| Lignin Market Size 2032 |
USD 1.84 Billion |
The competitive landscape of the Lignin Market features established players including Stora Enso, West Fraser, UPM Biochemicals, Sweetwater Energy, Borregaard LignoTech, Rayonier Advanced Materials, Domsjö Fabriker, Changzhou Shanfeng Chemical Industry Co Ltd, Domtar Corporation, and Nippon Paper Industries Co., Ltd. These firms are advancing through strategic alliances, capacity expansions, and R&D investments to enhance high‑purity lignin products and specialty applications. Regionally, Europe leads with around a 32 % share of the global market, driven by strong sustainable manufacturing practices and regulatory support. North America holds 28 % of the market, supported by pulp‑and‑paper infrastructure and advanced application demand.
 Market Insights
- The global Lignin Market size reached USD 1 billion in 2024 and will grow at a CAGR of 4.2 % through 2032.
- High demand for sustainable, bio‑based materials across construction, adhesives and polymers drives the market.
- A growing trend involves using agricultural residues and waste biomass to produce lignin, enabling circular economy models.
- Major companies are scaling capacity and innovating specialty lignin products, creating a competitive and evolving market landscape.
- Europe commands about 32 % of the market share, North America around 28 %, Asia‑Pacific about 24 %, Latin America about 9 % and Middle East & Africa roughly 7 %.
Access crucial information at unmatched prices!
Request your sample report today & start making informed decisions powered by Credence Research Inc.!
Download Sample
Market Segmentation Analysis:
By Application
The application segment of the lignin market is dominated by the macromolecules sub‑segment, which held 58.63% of share in 2024. This dominance is driven by rising use of lignin‑derived macromolecules in carbon fibres, activated carbon, and bio‑based polymers, especially in automotive, construction, and aerospace sectors. Lightweighting and sustainability mandates are encouraging substitution of petroleum‑based materials, boosting demand for macromolecule uses of lignin. The aromatics sub‑segment is growing steadily but remains smaller in scale.
- For instance, the production of lignin-based activated carbon with high performance in adsorption, where iodine adsorption exceeds 800 mg/g and wear-resisting strength is over 85%, developed via phosphoric acid activation processes for uses in environmental purification.
By Raw Material
In the raw material category, the hardwood feedstock segment leads the market due to its favourable chemical profile and processing advantages. Hardwood sourced lignin captures the largest share in 2024. Its dominance is supported by higher extractability, desirable lower molecular weight profiles, and established pulping infrastructure. Other sources such as softwood, straw, sugarcane bagasse, corn stover, and spent liquor are gaining interest but currently trail behind hardwood in commercial volume.
- For instance, the SWEETWOODS project demonstrated industrial-scale production of high-purity lignin from hardwood, utilizing at least 95% of the initial carbon content of the biomass, which supports the efficiency and sustainability of hardwood lignin extraction.
By Product
Within the product segmentation, the lignosulphonates sub‑segment dominates, accounting for an estimated 91.3% of the market share in 2025. This dominance stems from lignosulphonates’ broad utility in dispersants, concrete admixtures, animal feed binders, and oil‑field drilling fluids, along with mature production via the sulfite pulping route. Other products such as kraft lignin, organosolv lignin, low‑purity lignin, and “other lignin” are growing, particularly in advanced applications, but remain niche compared to lignosulphonates.
Key Growth Drivers
Growing Demand for Sustainable Materials
The lignin market is expanding due to increasing demand for eco-friendly and bio-based alternatives to petroleum-derived materials. Industries are adopting lignin for polymers, adhesives, and coatings to reduce carbon emissions and comply with sustainability regulations. Automotive, construction, and consumer goods sectors increasingly use lignin to replace conventional materials. Rising focus on green manufacturing, environmental responsibility, and renewable feedstocks drives the market, supporting broader adoption of lignin across multiple industrial applications globally.
- For instance, Lignin Industries has developed Renol, a bio-based plastic filler used in automotive applications such as the SsangYong Tivoli SUV, which reduces carbon emissions and supports lightweight vehicle parts through advanced microcellular injection molding technology, the Ku-Fizz process.
Infrastructure and Construction Activity
Global infrastructure development is fueling the consumption of lignin-based concrete admixtures, dispersants, and dust control agents. Lignin’s inherent binding and dispersing properties make it highly suitable for construction applications. Urbanization, industrial projects, and government initiatives promoting durable and sustainable construction materials drive consistent growth. Increasing demand for high-performance, eco-friendly building solutions encourages manufacturers to integrate lignin, supporting stable expansion and stronger penetration of lignin products in construction and related sectors worldwide.
- For instance, lignosulfonate-based superplasticizers used in ready-mix concrete to reduce water use by 10-20%, enhancing workability and durability in structures such as roads and bridges.
Expansion of Advanced End‑uses (Carbon Fiber & Biopolymers)
Technological advancements are enabling the use of lignin in high-value applications such as carbon fiber, activated carbon, and biopolymers. Ongoing research improves purity, consistency, and performance, allowing lignin to replace traditional materials in advanced industrial applications. Adoption in automotive, aerospace, and specialty chemical sectors is increasing, while investment in innovative production techniques expands opportunities. These developments strengthen market growth, enhance product versatility, and create new avenues for lignin in high-value applications across diverse industrial segments.
Key Trends & Opportunities
Valorization of Agri‑biomass and Waste Streams
Circular economy initiatives are promoting lignin recovery from agricultural residues, pulping by-products, and other biomass sources. Feedstocks such as straw, sugarcane bagasse, and corn stover are being increasingly utilized to produce value-added lignin. Integrated biorefineries convert waste streams into commercially viable products, reducing environmental impact while supporting sustainable industrial practices. This trend allows lignin producers to diversify applications, create additional revenue streams, and meet growing sustainability requirements across multiple sectors, strengthening market adoption globally.
- For instance, Andaltec in Spain developed a patented microwave depolymerization method for lignin extracted from agricultural by-products like river cane and wheat straw, achieving a depolymerization rate of over 90%, and generating valuable compounds such as vanillin and ferulic acid.
Regulatory Push for Bio‑based Packaging and Coatings
Stricter regulations on single-use plastics and increasing consumer demand for sustainable products are driving the adoption of lignin-based biopolymers. Lignin is being integrated into packaging, coatings, and adhesives to meet environmental standards and regulatory compliance. Rising corporate focus on eco-friendly materials, combined with increasing sustainability awareness, presents opportunities for innovation in bio-based solutions. This trend supports growth in demand, encourages product development, and enables manufacturers to expand lignin usage in environmentally conscious industrial applications.
- For instance, Stora Enso has commercialized lignin-based barrier coatings for food packaging, offering recyclable and renewable options that meet recent EU directives on packaging waste reduction.
Key Challenges
Complex Chemical Structure and Processing Costs
Lignin’s heterogeneous chemical structure limits its direct use in many industrial processes. Achieving consistent quality and high purity requires advanced extraction and processing technologies, which increase costs. These technical challenges restrict widespread adoption in high-value applications such as carbon fiber and specialty chemicals. Developing cost-effective, scalable methods for processing lignin is essential to overcome these barriers, enabling broader commercial utilization while ensuring product consistency and maintaining competitive advantages in industrial markets.
Low Market Awareness and Value Capture
Despite large lignin production from pulp and biomass industries, many end-users remain unaware of its potential applications. Limited market awareness reduces demand for advanced products and slows commercialization of high-value lignin solutions. Producers must invest in education, marketing, and demonstration of lignin’s functional benefits, environmental advantages, and versatility. Overcoming this challenge is critical to increasing adoption, enhancing market penetration, and enabling producers to fully capture the material’s economic value in industrial and specialty applications worldwide.
Regional Analysis
North America
North America holds a market share of 28% in the global lignin market, driven by high demand for bio-based polymers, adhesives, and concrete additives. Strong industrial infrastructure, rising adoption of sustainable materials, and government regulations promoting renewable resources support growth. The United States dominates regional consumption due to its extensive pulp and paper industry, coupled with investments in R&D for high-purity lignin applications. Canada and Mexico are also contributing to regional expansion through the utilization of hardwood and softwood feedstocks for lignin extraction and downstream applications across construction, automotive, and specialty chemicals.
Europe
Europe accounts for a market share of 32%, led by Germany, Sweden, and Finland, where sustainable manufacturing practices and renewable energy initiatives are well established. High demand for lignosulphonates in concrete admixtures, animal feed, and adhesives drives market growth. Strong pulp and paper industries provide abundant raw material supply, while stringent environmental regulations encourage adoption of lignin-based alternatives to fossil-based products. The region also benefits from research initiatives in carbon fiber and biopolymers, enhancing lignin’s application potential in advanced industrial sectors, fostering innovation and consistent market expansion.
Asia-Pacific
Asia-Pacific captures a market share of 24%, with China, Japan, and India leading regional consumption. Rapid industrialization, urbanization, and infrastructure development drive demand for lignin-based construction additives and dispersants. Abundant availability of agricultural residues, such as sugarcane bagasse, corn stover, and straw, supports raw material supply. Increasing adoption of bio-based materials in automotive, packaging, and specialty chemicals further fuels growth. Investments in lignin processing technologies and expansion of pulp and paper facilities enhance production capacities. Emerging markets in Southeast Asia are also contributing to regional growth through innovative applications and sustainability-driven projects.
Latin America
Latin America holds a market share of 9%, led by Brazil and Chile, supported by large-scale forestry and pulp industries. The region’s abundant hardwood and softwood resources provide cost-effective raw materials for lignin production. Growing demand for lignosulphonates in concrete, dust control, and animal feed applications drives adoption. Government initiatives promoting sustainable and renewable resources, along with expansion in construction and industrial activities, further boost market growth. Brazil’s investment in biorefineries and value-added lignin applications enhances production and diversifies applications, positioning Latin America as an emerging market with increasing influence in the global lignin industry.
Middle East & Africa
Middle East & Africa contributes a market share of 7%, with South Africa and Egypt leading regional consumption. The region’s growth is driven by increasing industrialization, infrastructure development, and demand for sustainable construction materials. Availability of agricultural residues like straw and sugarcane bagasse supports lignin extraction. Rising adoption of lignin-based dispersants and adhesives in construction, oilfield drilling, and industrial applications encourages market expansion. Despite limited high-purity lignin production facilities, government initiatives for renewable materials and growing environmental awareness are creating opportunities for market development and investment in downstream lignin applications across the region.
Market Segmentations:
By Application
By Raw material
- Hardwood
- Softwood
- Straw
- Sugarcane bagasse
- Corn stover
- Spent liquor
By Product
- Low purity
- Lignosulphonates
- Kraft lignin
- Organosolv lignin
- Other lignin
By Downstream potential
- Vanillin
- Carbon fiber
- Phenol
- BTX
- Phenolic resins
- Adhesives
- Epoxy resins
- Activated carbon
By Region
- North America
- Europe
- Germany
- France
- U.K.
- Italy
- Spain
- Rest of Europe
- Asia Pacific
- China
- Japan
- India
- South Korea
- South-east Asia
- Rest of Asia Pacific
- Latin America
- Brazil
- Argentina
- Rest of Latin America
- Middle East & Africa
- GCC Countries
- South Africa
- Rest of the Middle East and Africa
Competitive Landscape
The competitive landscape of the lignin market includes key players such as Stora Enso, West Fraser, UPM Biochemicals, Sweetwater Energy, Borregaard LignoTech, Rayonier Advanced Materials, Domsjö Fabriker, Changzhou Shanfeng Chemical Industry Co Ltd, Domtar Corporation, and Nippon Paper Industries Co., Ltd. Companies are focusing on strategic initiatives such as mergers, acquisitions, partnerships, and capacity expansions to strengthen their market positions. Product innovation and investment in research and development are critical, with many firms developing high-purity lignin and specialty lignin products for carbon fiber, adhesives, and bio-based polymers. Regional expansion, particularly in Asia-Pacific and Latin America, is driving growth. Sustainable practices, including utilization of agricultural residues and waste streams, enhance product portfolios. Companies are also leveraging advanced extraction technologies to improve quality and consistency, meeting increasing industrial demand. The competitive environment is dynamic, emphasizing innovation, sustainability, and global presence to maintain a strong foothold in the evolving lignin market.
Key Player Analysis
- West Fraser
- Changzhou Shanfeng Chemical Industry Co Ltd
- Borregaard LignoTech
- Nippon Paper Industries Co., Ltd
- Domsjö Fabriker
- Rayonier Advanced Materials
- Stora Enso
- Sweetwater Energy
- Domtar Corporation
- UPM Biochemicals
Recent Developments
- In May 2023, UPM Biochemicals partnered with URSA to launch eco-friendly building insulation. URSA produces sustainable glass wool using an advanced binder that incorporates UPM’s BioPiva™ lignin, aiming to reduce CO₂ emissions and energy consumption.
- In March 2023, Metsä Group announced a collaboration with Kemira to develop a renewable, fossil-free raw material for the forest industry by 2027. This initiative supports Metsä’s sustainability strategy to achieve zero fossil emissions and entirely fossil-free products by 2030.
- In February 2023, Nippon Paper Industries Co., Ltd. joined forces with Sumitomo Corporation and Green Earth Institute Co., Ltd. to commercially produce cellulosic bioethanol from woody biomass and develop it into biochemical products in Japan.
Shape Your Report to Specific Countries or Regions & Enjoy 30% Off!
Report Coverage
The research report offers an in-depth analysis based on Application, Raw Material, Product, Downstream Potential and Region. It details leading market players, providing an overview of their business, product offerings, investments, revenue streams, and key applications. Additionally, the report includes insights into the competitive environment, SWOT analysis, current market trends, as well as the primary drivers and constraints. Furthermore, it discusses various factors that have driven market expansion in recent years. The report also explores market dynamics, regulatory scenarios, and technological advancements that are shaping the industry. It assesses the impact of external factors and global economic changes on market growth. Lastly, it provides strategic recommendations for new entrants and established companies to navigate the complexities of the market.
Future Outlook
- Demand for bio-based and sustainable materials will continue to drive market growth.
- Expansion of carbon fiber and biopolymer applications will create new high-value opportunities.
- Increased adoption of lignin-based concrete admixtures and dispersants will support industrial demand.
- Agricultural residues and waste streams will become key sources for lignin production.
- Regulatory push for eco-friendly packaging and coatings will boost market adoption.
- Technological advancements will improve lignin purity, consistency, and process efficiency.
- Emerging markets in Asia-Pacific and Latin America will contribute to regional growth.
- Investment in integrated biorefineries will enhance value-added lignin production.
- Strategic partnerships, mergers, and acquisitions will strengthen competitive positioning.
- Focus on research and development will expand specialty applications in automotive, aerospace, and chemicals.


