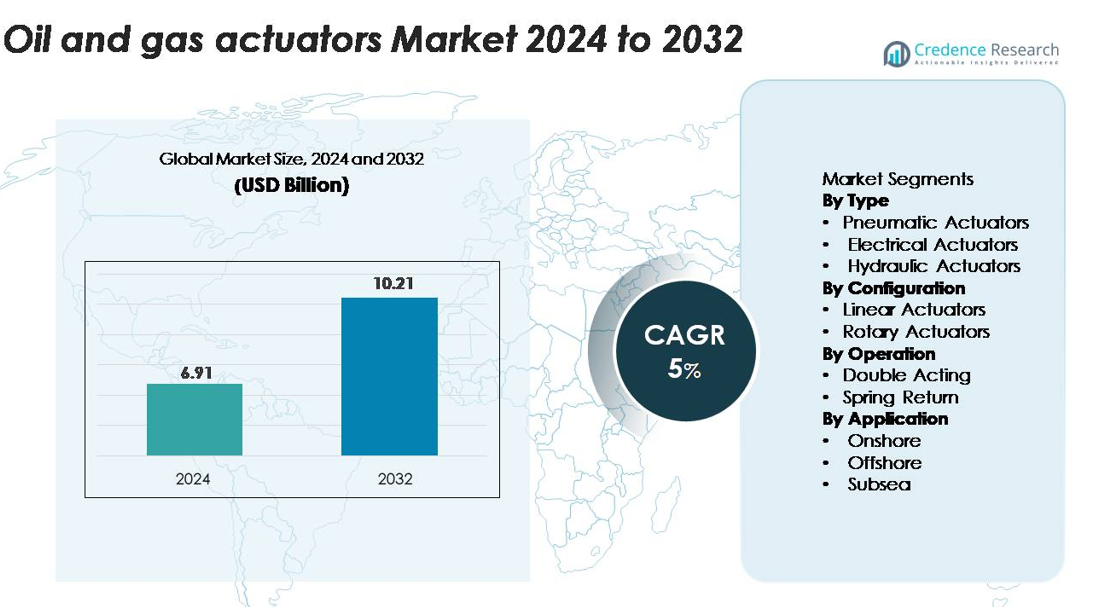
Home » Energy » Oil & Gas » Oil And Gas Actuators Market

Oil And Gas Actuators Market By Body Material (Cast, Forged) By Application (Upstream. Midstream, Downstream)-Growth, Future Prospects & Competitive Analysis, 2016 – 2030

Price: $4999

Published: | Report ID: 20012 | Report Format : PDF

Market Insights

  • The global demand for Oil and Gas Actuators was valued at USD 7.1 Billion in 2022 and is expected to reach USD 8.67 Billion in 2030, growing at a CAGR of 2.90% between 2023 and 2030.
  • Gates comprise the largest product type category in the oil and gas actuators market.
  • The 0.25 to 8-inch size range is the largest market segment for oil and gas actuators in 2022.
  • In 2022, Cast is the most popular body material in the oil and gas actuators market.
  • Upstream represents the largest application segment in the oil and gas actuators industry in 2022.
  • North America is the largest market for oil and gas actuators, with a share of 35% in 2022.

Oil and Gas Actuators market

Key Highlights of the Report

The global Oil and Gas Actuators market is segmented by product type, size, body material, application, and regionIn terms of market share, the Gates and 0.25 to 8-inch categories dominated the oil and gas actuators market in 2022. In addition, the cast category led the market in body material segment, while upstream category also dominated the market in application segment. North America is the largest market for oil and gas actuators, with a share of 35% in 2022.

Oil and gas pipelines employ actuators to regulate valves, assisting in properly regulating fluid flow. Actuators are in high demand as the oil and gas sector becomes increasingly automated.

Actuators can also help the oil and gas industry increase environmental compliance and safety. Actuators, for instance, can be used to close valves in the event of a leak, assisting in preventing spills. The market is anticipated to be driven by the oil and gas sector’s rising demand for automation, the expansion of the shale gas and oil sector, and the increased emphasis on environmental compliance and safety.

Design Element 2

Access crucial information at unmatched prices!

Request your free sample report today & start making informed decisions powered by Credence Research!

Download Free Sample
CTA Design Element 3

Market Overview

The global Oil and Gas Actuators market has witnessed steady growth in recent years and is expected to grow at a CAGR of 2.90% between 2023 and 2030. The market was valued at USD 7.1 Billion in 2022 and is expected to reach USD 8.67 Billion in 2030.

What Are The Main Drivers Of The Global Oil and Gas Actuators Market?

A strong growth rate is anticipated for the worldwide oil and gas actuators industry in the upcoming years. Several causes, such as the rising demand for automation, the shale gas and oil industry expansion, and the growing emphasis on environmental compliance, contribute to this growth.

What Are The Major Challenges Faced By The Global Oil and Gas Actuators Market?

The price of oil and gas can change dramatically, and the sector is cyclical. The global market for oil and gas actuators has significant hurdles, making it challenging for actuator producers to estimate demand and plan their production accordingly.

What Are The Growth Opportunities In The Global Oil and Gas Actuators Market?

High-pressure actuators are used more frequently in equipment like drilling rigs and pipelines in the oil and gas sector. This is because actuators in these applications must be able to endure the high pressures that are present. As a result, the market for oil and gas actuators will benefit from the rising need for high-pressure actuators.

Oil and Gas Actuators market

Executive Summary

Overview of the Global Oil and Gas Actuators Market

Several factors are driving the market, including the rising demand for automation in the oil and gas sector, the shale gas and oil industry expansion, and the increased emphasis on environmental compliance and safety. The oil and gas actuators market is expanding significantly due largely to the shale gas and oil industry. This is because manually managing valves can be challenging, given how frequently shale gas and oil wells are found in outlying regions. These wells’ valves can be remotely controlled by actuators, which enhances efficiency and safety. Additionally, the oil and gas actuators market is expanding due to the growing emphasis on environmental compliance and safety. In the event of a leak, actuators can close valves, reducing the chance of spills.

Market Definition

Actuators that use oil and gas transform energy into action. They manage valves in oil and gas pipelines, assisting in properly regulating fluid flow. The three basic varieties are electric, pneumatic, and hydraulic oil and gas actuators. Oil and gas actuators are used in the industry for a number of purposes, including valve control, process control, and safety and security. The market is developing as a result of increased demand for automation in the oil and gas industry, the growth of the shale gas and oil industry, and the increased focus on environmental compliance and safety.

Segmentation by Product Type

  • Gates comprise the largest product type category in the oil and gas actuators market.
  • The most frequent type of valve used in oil and gas applications is a gate, and actuators operate them.
  • To ensure that the flow of fluids is correctly managed, gates are employed to control the flow of fluids in pipelines.
  • Throughout the anticipated period, the checks segment will grow at a substantial rate in the oil and gas actuators market.

Segmentation by Size

  • The 0.25 to 8-inch size range is the largest market segment for oil and gas actuators. This is because valves used in oil and gas applications typically fall within this size range.
  • Pipelines, wellheads, pressure vessels, and other structures all require valves in this size range.
  • The 8 to 20 inches segment will grow at a substantial rate in the oil and gas actuators market.

Segmentation by Body Material

  • The cast is the most popular body material in the oil and gas actuators market. This is because cast actuators are less expensive than forged actuators.
  • Cast actuators have a larger range of uses, making them more adaptable.
  • Over the anticipated period, the forges segment will grow at a substantial rate in the oil and gas actuators market.

Segmentation by Application

  • Upstream represents the largest application segment in the oil and gas actuators industry. This is so because the most crucial phases in the oil and gas industry—oil and gas exploration and production—fall under the upstream segment.
  • In the upstream sector, actuators are employed in numerous applications such as pressure relief, wellhead control, and pipeline management.
  • Throughout the anticipated period, the midsream sector will grow at a substantial rate in the oil and gas actuators market.

Segmentation by Region

  • North America is the largest market for oil and gas actuators, with a share of 35% in 2022.
  • This results from the region’s numerous pipelines and oil and gas wells.
  • The biggest market in North America is the United States, followed by Canada.

From 2023 to 2030, the oil and gas actuators market in the United States is anticipated to expand at the quickest CAGR. The market is expanding due to the rising need for automation in the oil and gas sector, the shale gas and oil industry expansion, and the growing emphasis on environmental compliance and safety. One of the world’s biggest markets for oil and gas actuators is the United States.

The second-largest market in the world for oil and gas actuators is China. This results from the nation’s substantial oil and gas reserves and emphasis on automation and safety in the oil and gas sector. In the upcoming years, China’s economy is expected to expand further, increasing demand for oil and gas. As a result, the need for oil and gas actuators will increase.

Actuators are rising in demand as the oil and gas sector becomes more automated. Oil and gas pipelines employ actuators to regulate valves, assisting in properly regulating fluid flow. Actuators are in high demand as the oil and gas sector becomes increasingly automated.

Safety and environmental compliance are increasingly prioritized in the oil and gas sector. Manufacturers of actuators who can produce goods that match these specifications will now have new prospects. In the event of a leak, actuators can close valves, reducing the chance of spills.

The Development Of Smart Actuators

Actuators with sensors and those that may be remotely operated are referred to as smart actuators. They are, therefore, perfect for use in far-off oil and gas wells. Data on the performance of valves can also be gathered by smart actuators and used to increase safety and effectiveness. Electric actuators are also becoming more and more common in the oil and gas sector due to their dependability, effectiveness, and simplicity of maintenance. Actuators are also made from novel materials, including composites and ceramics, which are stronger, lighter, and longer-lasting. These materials also have higher wear and corrosion resistance, making them perfect for usage in severe situations.

Increased Focus On Safety And Environmental Compliance

Safety and environmental compliance are becoming increasingly important to the gas and oil sector. Numerous causes are to blame, such as more stringent laws, growing public awareness, and a desire to cut expenses. Actuators that can assist the industry in achieving its safety and environmental compliance goals are in greater demand.

Oil and gas pipelines employ actuators to regulate valves, assisting in properly regulating fluid flow. This is crucial for safety as it helps avoid spills and leaks. To stop spills, actuators can also be employed to seal valves in case of a leak. Actuators can also be used to track the performance of valves, which can aid in spotting possible issues before they become serious. This can enhance safety and help prevent accidents. Last but not least, actuators can automate valve operations, thereby lowering human error and enhancing safety.

Volatility In Oil And Gas Prices

The price of oil and gas can vary widely, and the oil and gas business is cyclical. Because of this, it may be challenging for actuator makers to predict demand and justify investments. For instance, demand for actuators usually decreases when oil and gas prices are low. Customers are less inclined to invest in actuators when prices are low. After all, they are a relatively pricey component. On the other hand, demand for actuators often rises when oil and gas prices are high. Customers are more likely to purchase actuators when prices are high since they can increase productivity and cut costs.

Strict Environmental Regulations

The global regulatory community looks more closely at the oil and gas sector. As a result, environmental standards are becoming more stringent, which may drive up the price of actuators. For instance, more stringent emissions criteria must now be met by actuators used to produce oil and gas. As a result, manufacturers may need to invest more in new technologies to produce actuators that adhere to these criteria.

Growth Of The Shale Gas And Oil Industry

Actuators are becoming increasingly in demand due to the booming shale gas and oil sector. Since shale gas wells are frequently situated in isolated locations, manually operating valves can be challenging. These wells’ valves can be remotely controlled by actuators, which enhances efficiency and safety.

Additionally, the shale gas and oil business employs more sophisticated machinery than conventional oil and gas extraction. Actuators can give the more precise control this equipment needs. As a result, the shale gas and oil sector’s expansion is opening up new business potential for actuator producers.

The Development Of The Internet of Things

Actuators now have more options due to the Internet of Things (IoT), which connects machines and gadgets in novel ways. Actuators, for instance, can be used to manage valves in intelligent factories and buildings. In these situations, this will help to increase efficiency and lower costs. The IoT is used in the oil and gas sector to develop intelligent oilfields. Sensors and actuators are used in smart oilfields to monitor and manage machinery continuously. This enhances production, effectiveness, and safety.

Competitive Landscape

Key Players

Key competitors compete for market share in the highly competitive global oil and gas actuators industry. The following are a few of the market’s major players:

  • Emerson Electric Co.
  • Schlumberger Limited
  • Alfa Laval Corporate AB
  • Flowserve Corporation
  • Crane Co.
  • Rotork Plc
  • Metso Oyj
  • KITZ Corporation
  • IMI Critical Engineering
  • Samson Controls Inc.

These are just a few of the top companies in the world market for oil and gas actuators. Several smaller businesses are also in the industry and striving for market share. As competitors continue to innovate and create new products, the competitive environment in the market is anticipated to stay intense in the next years.

To create new and improved actuators, businesses are investing in product innovation. This includes creating novel actuator technologies, such as intelligent and IoT-connected actuators.

To increase their product options and access new markets, businesses partner with other businesses and purchase smaller competitors.

Emerson Electric announced the introduction of its new range of intelligent actuators for the oil and gas sector in January 2023. These actuators have sensors that can gather performance data, which can then be used to increase effectiveness and prevent problems.

Schneider Electric declared the inauguration of a new manufacturing site in China in April 2023. This factory will enable Schneider Electric to increase its presence in this area by producing actuators for the Chinese market.

Shape Your Report to Specific Countries or Regions & Enjoy 30% Off!

Summary of Key Findings

  • The growth of the shale gas and oil industry, the rising demand for automation in the oil and gas sector, and the increased emphasis on environmental compliance and safety are all factors driving the market.
  • Gates comprise the largest product type category in the oil and gas actuators market.
  • The 0.25 to 8-inch size range is the largest market segment for oil and gas actuators.
  • The Cast will dominate the oil and gas actuators market by body material in 2022.
  • Upstream represents the largest application segment in the oil and gas actuators industry.
  • With a 20% market share in 2022, Asia Pacific will be the third-largest market for oil and gas actuators. The expansion of the local shale gas and oil industries brings this on. The biggest markets in the Asia Pacific region are China, India, and Japan.

Future Outlook

  • The need for smart actuators is anticipated to rise over the next few years. These actuators have sensors that can gather performance data, which can then be used to increase effectiveness and prevent problems.
  • In the upcoming years, it is anticipated that the development of novel actuator technologies will continue. As a result, the market will develop, and actuator producers will have new chances.
  • The oil and gas actuators market is growing in new areas, including Asia Pacific and Latin America. The development of the oil and gas sector in these areas will be the main driver of this expansion.

Segmentation

  • By Product Type
    • Gates
    • Globes
    • Bails
    • Butterflies
    • Checks
    • PRVs
    • Others
  • By Size
    • 0.25 to 8 inches
    • 8 to 20 inches
    • Above 20 inches
  • By Body Material
    • Cast
    • Forged
  • By Application
    • Upstream
    • Midstream
    • Downstream
  • By Region
  • North America
    • USA
    • Canada
    • Mexico
  • Europe
    • Germany
    • France
    • U.K.
    • Italy
    • Spain
    • Rest of Europe
  • Asia Pacific
    • China
    • Japan
    • India
    • South Korea
    • South-east Asia
    • Rest of Asia Pacific
  • Latin America
    • Brazil
    • Argentina
    • Rest of Latin America
  • Middle East & Africa
    • GCC Countries
    • South Africa
    • Rest of the Middle East and Africa

1. Preface
1.1. Report Description
1.1.1. Purpose of the Report
1.1.2. Target Audience
1.1.3. USP and Key Offerings
1.2. Research Scope
1.3. Research Methodology
1.3.1. Phase I – Secondary Research
1.3.2. Phase II – Data Modelling
1.3.2.1. Company Share Analysis Model
1.3.2.2. Revenue Based Modelling
1.3.3. Phase III – Primary Research
1.3.4. Research Limitations
1.3.5. Assumptions
1.4. Market Introduction
1.5. Market Research Scope

2. Executive Summary
2.1. Market Snapshot: Global Oil and Gas Actuators Market
2.2. Global Oil and Gas Actuators Market, By Product Type
2.3. Global Oil and Gas Actuators Market, By Size
2.4. Global Oil and Gas Actuators Market, By Body Material
2.5. Global Oil and Gas Actuators Market, By Application
2.6. Global Oil and Gas Actuators Market, By Region

3. Market Dynamics & Factors Analysis
3.1. Introduction
3.1.1. Global Oil and Gas Actuators Market Value, 2017-2030, (US$ Bn)
3.1.2. Y-o-Y Growth Trend Analysis
3.2. Market Dynamics
3.2.1. Market Drivers
3.2.2. Market Restraints
3.2.3. Market Opportunities
3.2.4. Major Industry Challenges
3.3. Growth and Development Patterns
3.4. Investment Feasibility Analysis
3.5. Market Opportunity Analysis
3.5.1. Product Type
3.5.2. Size
3.5.3. Body Material
3.5.4. Application
3.5.5. Geography

4. Premium Insights
4.1. STAR (Situation, Task, Action, Results) Analysis
4.2. Porter’s Five Forces Analysis
4.2.1. Threat of New Entrants
4.2.2. Bargaining Power of Buyers/Consumers
4.2.3. Bargaining Power of Suppliers
4.2.4. Threat of Substitute Types
4.2.5. Intensity of Competitive Rivalry
4.3. Key Market Trends
4.3.1. Demand Side Trends
4.3.2. Supply Side Trends
4.4. Value Chain Analysis
4.5. Product Type Analysis
4.6. Analysis and Recommendations
4.7. Marketing Strategy Analysis
4.7.1. Direct Marketing
4.7.2. Indirect Marketing
4.7.3. Marketing Channel Development Trend

5. Market Positioning of Key Players, 2022
5.1. Company market share of key players, 2022
5.2. Competitive Benchmarking
5.3. Market Positioning of Key Vendors
5.4. Geographical Presence Analysis
5.5. Major Strategies Adopted by Key Players
5.5.1. Key Strategies Analysis
5.5.2. Mergers and Acquisitions
5.5.3. Partnerships
5.5.4. Product Launch
5.5.5. Geographical Expansion
5.5.6. Others

6. Economic Impact Analysis
6.1. Recession Impact
6.1.1. North America
6.1.2. Europe
6.1.3. Asia Pacific
6.1.4. Latin America
6.1.5. Middle East and Africa
6.2. Ukraine-Russia War Impact
6.2.1. North America
6.2.2. Europe
6.2.3. Asia Pacific
6.2.4. Latin America
6.2.5. Middle East and Africa
6.3. COVID-19 Impact Analysis
6.3.1. North America
6.3.2. Europe
6.3.3. Asia Pacific
6.3.4. Latin America
6.3.5. Middle East and Africa

7. Global Oil and Gas Actuators Market, By Product Type
7.1. Global Oil and Gas Actuators Market Overview, by Product Type
7.1.1. Global Oil and Gas Actuators Market Revenue Share, By Product Type, 2022 Vs 2030 (in %)
7.2. Gates
7.2.1. Global Oil and Gas Actuators Market, By Region, 2017-2030 (US$ Bn)
7.3. Globes
7.3.1. Global Oil and Gas Actuators Market, By Region, 2017-2030 (US$ Bn)
7.4. Bails
7.4.1. Global Oil and Gas Actuators Market, By Region, 2017-2030 (US$ Bn)
7.5. Butterflies
7.5.1. Global Oil and Gas Actuators Market, By Region, 2017-2030 (US$ Bn)
7.6. Checks
7.6.1. Global Oil and Gas Actuators Market, By Region, 2017-2030 (US$ Bn)
7.7. PRVs
7.7.1. Global Oil and Gas Actuators Market, By Region, 2017-2030 (US$ Bn)
7.8. Others
7.8.1. Global Oil and Gas Actuators Market, By Region, 2017-2030 (US$ Bn)

8. Global Oil and Gas Actuators Market, By Size
8.1. Global Oil and Gas Actuators Market Overview, by Size
8.1.1. Global Oil and Gas Actuators Market, By Size, 2022 vs 2030 (in %)
8.2. 0.25 to 8 inches
8.2.1. Global Oil and Gas Actuators Market, By Region, 2017-2030 (US$ Bn)
8.3. 8 to 20 inches
8.3.1. Global Oil and Gas Actuators Market, By Region, 2017-2030 (US$ Bn)
8.4. Above 20 inches
8.4.1. Global Oil and Gas Actuators Market, By Region, 2017-2030 (US$ Bn)

9. Global Oil and Gas Actuators Market, by Body Material, 2017-2030 (US$ Bn)
9.1. Global Oil and Gas Actuators Market Overview, by Body Material
9.1.1. Global Oil and Gas Actuators Market, By Body Material, 2022 vs 2030 (in%)
9.2. Cast
9.2.1. Global Oil and Gas Actuators Market, By Region, 2017-2030 (US$ Bn)
9.3. Forged
9.3.1. Global Oil and Gas Actuators Market, By Region, 2017-2030 (US$ Bn)

10. Global Oil and Gas Actuators Market, by Application, 2017-2030 (US$ Bn)
10.1. Global Oil and Gas Actuators Market Overview, by Application
10.1.1. Global Oil and Gas Actuators Market, By Application, 2022 vs 2030 (in%)
10.2. Upstream
10.2.1. Global Oil and Gas Actuators Market, By Region, 2017-2030 (US$ Bn)
10.3. Midstream
10.3.1. Global Oil and Gas Actuators Market, By Region, 2017-2030 (US$ Bn)
10.4. Downstream
10.4.1. Global Oil and Gas Actuators Market, By Region, 2017-2030 (US$ Bn)

11. Global Oil and Gas Actuators Market, By Region
11.1. Global Oil and Gas Actuators Market Overview, by Region
11.1.1. Global Oil and Gas Actuators Market, By Region, 2022 vs 2030 (in%)
11.2. Product Type
11.2.1. Global Oil and Gas Actuators Market, By Product Type, 2017-2030 (US$ Bn)
11.3. Size
11.3.1. Global Oil and Gas Actuators Market, By Size, 2017-2030 (US$ Bn)
11.4. Body Material
11.4.1. Global Oil and Gas Actuators Market, By Body Material, 2017-2030 (US$ Bn)
11.5. Application
11.5.1. Global Oil and Gas Actuators Market, By Body Material, 2017-2030 (US$ Bn)

12. North America Oil and Gas Actuators Market Analysis
12.1. North America Oil and Gas Actuators Market, by Product Type, 2017-2030(US$ Bn)
12.1.1. Overview
12.1.2. SRC Analysis
12.2. North America Oil and Gas Actuators Market, by Size, 2017-2030(US$ Bn)
12.2.1. Overview
12.2.2. SRC Analysis
12.3. North America Oil and Gas Actuators Market, by Body Material, 2017-2030(US$ Bn)
12.3.1. Overview
12.3.2. SRC Analysis
12.4. North America Oil and Gas Actuators Market, by Application, 2017-2030(US$ Bn)
12.4.1. Overview
12.4.2. SRC Analysis
12.5. North America Oil and Gas Actuators Market, by Country, 2017-2030 (US$ Bn)
12.5.1. North America Oil and Gas Actuators Market, by Country, 2022 Vs 2030 (in%)
12.5.2. U.S.
12.5.2.1. U.S. Oil and Gas Actuators Market Estimates and Forecast, 2017-2030 (US$ Bn)
12.5.2.2. U.S. Oil and Gas Actuators, By Product Type, 2017-2030 (US$ Bn)
12.5.2.3. U.S. Oil and Gas Actuators, By Size, 2017-2030 (US$ Bn)
12.5.2.4. U.S. Oil and Gas Actuators, By Body Material, 2017-2030 (US$ Bn)
12.5.2.5. U.S. Oil and Gas Actuators, By Application, 2017-2030 (US$ Bn)
12.5.3. Canada
12.5.3.1. Canada Oil and Gas Actuators Market Estimates and Forecast, 2017-2030 (US$ Bn)
12.5.3.2. Canada Oil and Gas Actuators, By Product Type, 2017-2030 (US$ Bn)
12.5.3.3. Canada Oil and Gas Actuators, By Size, 2017-2030 (US$ Bn)
12.5.3.4. Canada Oil and Gas Actuators, By Body Material, 2017-2030 (US$ Bn)
12.5.3.5. Canada Oil and Gas Actuators, By Application, 2017-2030 (US$ Bn)
12.5.4. Mexico
12.5.4.1. Mexico Oil and Gas Actuators Market Estimates and Forecast, 2017-2030 (US$ Bn)
12.5.4.2. Mexico Oil and Gas Actuators, By Product Type, 2017-2030 (US$ Bn)
12.5.4.3. Mexico Oil and Gas Actuators, By Size, 2017-2030 (US$ Bn)
12.5.4.4. Mexico Oil and Gas Actuators, By Body Material, 2017-2030 (US$ Bn)
12.5.4.5. Mexico Oil and Gas Actuators, By Application, 2017-2030 (US$ Bn)

13. Europe Oil and Gas Actuators Market Analysis
13.1. Europe Oil and Gas Actuators Market, by Product Type, 2017-2030(US$ Bn)
13.1.1. Overview
13.1.2. SRC Analysis
13.2. Europe Oil and Gas Actuators Market, by Size, 2017-2030(US$ Bn)
13.2.1. Overview
13.2.2. SRC Analysis
13.3. Europe Oil and Gas Actuators Market, by Body Material, 2017-2030(US$ Bn)
13.3.1. Overview
13.3.2. SRC Analysis
13.4. Europe Oil and Gas Actuators Market, by Application, 2017-2030(US$ Bn)
13.4.1. Overview
13.4.2. SRC Analysis
13.5. Europe Oil and Gas Actuators Market, by Country, 2017-2030 (US$ Bn)
13.5.1. Europe Oil and Gas Actuators Market, by Country, 2022 Vs 2030 (in%)
13.5.2. Germany
13.5.2.1. Germany Oil and Gas Actuators Market Estimates and Forecast, 2017-2030 (US$ Bn)
13.5.2.2. Germany Oil and Gas Actuators, By Product Type, 2017-2030 (US$ Bn)
13.5.2.3. Germany Oil and Gas Actuators, By Size, 2017-2030 (US$ Bn)
13.5.2.4. Germany Oil and Gas Actuators, By Body Material, 2017-2030 (US$ Bn)
13.5.2.5. Germany Oil and Gas Actuators, By Application, 2017-2030 (US$ Bn)
13.5.3. France
13.5.3.1. France Oil and Gas Actuators Market Estimates and Forecast, 2017-2030 (US$ Bn)
13.5.3.2. France Oil and Gas Actuators, By Product Type, 2017-2030 (US$ Bn)
13.5.3.3. France Oil and Gas Actuators, By Size, 2017-2030 (US$ Bn)
13.5.3.4. France Oil and Gas Actuators, By Body Material, 2017-2030 (US$ Bn)
13.5.3.5. France Oil and Gas Actuators, By Application, 2017-2030 (US$ Bn)
13.5.4. UK
13.5.4.1. UK Oil and Gas Actuators Market Estimates and Forecast, 2017-2030 (US$ Bn)
13.5.4.2. UK Oil and Gas Actuators, By Product Type, 2017-2030 (US$ Bn)
13.5.4.3. UK Oil and Gas Actuators, By Size, 2017-2030 (US$ Bn)
13.5.4.4. UK Oil and Gas Actuators, By Body Material, 2017-2030 (US$ Bn)
13.5.4.5. UK Oil and Gas Actuators, By Application, 2017-2030 (US$ Bn)
13.5.5. Italy
13.5.5.1. Italy Oil and Gas Actuators Market Estimates and Forecast, 2017-2030 (US$ Bn)
13.5.5.2. Italy Oil and Gas Actuators, By Product Type, 2017-2030 (US$ Bn)
13.5.5.3. Italy Oil and Gas Actuators, By Size, 2017-2030 (US$ Bn)
13.5.5.4. Italy Oil and Gas Actuators, By Body Material, 2017-2030 (US$ Bn)
13.5.5.5. Italy Oil and Gas Actuators, By Application, 2017-2030 (US$ Bn)
13.5.6. Spain
13.5.6.1. Spain Oil and Gas Actuators Market Estimates and Forecast, 2017-2030 (US$ Bn)
13.5.6.2. Spain Oil and Gas Actuators, By Product Type, 2017-2030 (US$ Bn)
13.5.6.3. Spain Oil and Gas Actuators, By Size, 2017-2030 (US$ Bn)
13.5.6.4. Spain Oil and Gas Actuators, By Body Material, 2017-2030 (US$ Bn)
13.5.6.5. Spain Oil and Gas Actuators, By Application, 2017-2030 (US$ Bn)
13.5.7. Rest of Europe
13.5.7.1. Rest of Europe Oil and Gas Actuators Market Estimates and Forecast, 2017-2030 (US$ Bn)
13.5.7.2. Rest of Europe Oil and Gas Actuators, By Product Type, 2017-2030 (US$ Bn)
13.5.7.3. Rest of Europe Oil and Gas Actuators, By Size, 2017-2030 (US$ Bn)
13.5.7.4. Rest of Europe Oil and Gas Actuators, By Body Material, 2017-2030 (US$ Bn)
13.5.7.5. Rest of Europe Oil and Gas Actuators, By Application, 2017-2030 (US$ Bn)+

14. Asia Pacific Oil and Gas Actuators Market Analysis
14.1. Asia Pacific Oil and Gas Actuators Market, by Product Type, 2017-2030(US$ Bn)
14.1.1. Overview
14.1.2. SRC Analysis
14.2. Asia Pacific Oil and Gas Actuators Market, by Size, 2017-2030(US$ Bn)
14.2.1. Overview
14.2.2. SRC Analysis
14.3. Asia Pacific Oil and Gas Actuators Market, by Body Material, 2017-2030(US$ Bn)
14.3.1. Overview
14.3.2. SRC Analysis
14.4. Asia Pacific Oil and Gas Actuators Market, by Application, 2017-2030(US$ Bn)
14.4.1. Overview
14.4.2. SRC Analysis
14.5. Asia Pacific Oil and Gas Actuators Market, by Country, 2017-2030 (US$ Bn)
14.5.1. Asia Pacific Oil and Gas Actuators Market, by Country, 2022 Vs 2030 (in%)
14.5.2. China
14.5.2.1. China Oil and Gas Actuators Market Estimates and Forecast, 2017-2030 (US$ Bn)
14.5.2.2. China Oil and Gas Actuators, By Product Type, 2017-2030 (US$ Bn)
14.5.2.3. China Oil and Gas Actuators, By Size, 2017-2030 (US$ Bn)
14.5.2.4. China Oil and Gas Actuators, By Body Material, 2017-2030 (US$ Bn)
14.5.2.5. China Oil and Gas Actuators, By Application, 2017-2030 (US$ Bn)
14.5.3. Japan
14.5.3.1. Japan Oil and Gas Actuators Market Estimates and Forecast, 2017-2030 (US$ Bn)
14.5.3.2. Japan Oil and Gas Actuators, By Product Type, 2017-2030 (US$ Bn)
14.5.3.3. Japan Oil and Gas Actuators, By Size, 2017-2030 (US$ Bn)
14.5.3.4. Japan Oil and Gas Actuators, By Body Material, 2017-2030 (US$ Bn)
14.5.3.5. Japan Oil and Gas Actuators, By Application, 2017-2030 (US$ Bn)
14.5.4. India
14.5.4.1. India Oil and Gas Actuators Market Estimates and Forecast, 2017-2030 (US$ Bn)
14.5.4.2. India Oil and Gas Actuators, By Product Type, 2017-2030 (US$ Bn)
14.5.4.3. India Oil and Gas Actuators, By Size, 2017-2030 (US$ Bn)
14.5.4.4. India Oil and Gas Actuators, By Body Material, 2017-2030 (US$ Bn)
14.5.4.5. India Oil and Gas Actuators, By Application, 2017-2030 (US$ Bn)
14.5.5. South Korea
14.5.5.1. South Korea Oil and Gas Actuators Market Estimates and Forecast, 2017-2030 (US$ Bn)
14.5.5.2. South Korea Oil and Gas Actuators, By Product Type, 2017-2030 (US$ Bn)
14.5.5.3. South Korea Oil and Gas Actuators, By Size, 2017-2030 (US$ Bn)
14.5.5.4. South Korea Oil and Gas Actuators, By Body Material, 2017-2030 (US$ Bn)
14.5.5.5. South Korea Oil and Gas Actuators, By Application, 2017-2030 (US$ Bn)
14.5.6. South-East Asia
14.5.6.1. South-East Asia Oil and Gas Actuators Market Estimates and Forecast, 2017-2030 (US$ Bn)
14.5.6.2. South-East Asia Oil and Gas Actuators, By Product Type, 2017-2030 (US$ Bn)
14.5.6.3. South-East Asia Oil and Gas Actuators, By Size, 2017-2030 (US$ Bn)
14.5.6.4. South-East Asia Oil and Gas Actuators, By Body Material, 2017-2030 (US$ Bn)
14.5.6.5. South-East Asia Oil and Gas Actuators, By Application, 2017-2030 (US$ Bn)
14.5.7. Rest of Asia Pacific
14.5.7.1. Rest of Asia Pacific Oil and Gas Actuators Market Estimates and Forecast, 2017-2030 (US$ Bn)
14.5.7.2. Rest of Asia Pacific Oil and Gas Actuators, By Product Type, 2017-2030 (US$ Bn)
14.5.7.3. Rest of Asia Pacific Oil and Gas Actuators, By Size, 2017-2030 (US$ Bn)
14.5.7.4. Rest of Asia Pacific Oil and Gas Actuators, By Body Material, 2017-2030 (US$ Bn)
14.5.7.5. Rest of Asia Pacific Oil and Gas Actuators, By Application, 2017-2030 (US$ Bn)

15. Latin America Oil and Gas Actuators Market Analysis
15.1. Latin America Oil and Gas Actuators Market, by Product Type, 2017-2030(US$ Bn)
15.1.1. Overview
15.1.2. SRC Analysis
15.2. Latin America Oil and Gas Actuators Market, by Size, 2017-2030(US$ Bn)
15.2.1. Overview
15.2.2. SRC Analysis
15.3. Latin America Oil and Gas Actuators Market, by Body Material, 2017-2030(US$ Bn)
15.3.1. Overview
15.3.2. SRC Analysis
15.4. Latin America Oil and Gas Actuators Market, by Application, 2017-2030(US$ Bn)
15.4.1. Overview
15.4.2. SRC Analysis
15.5. Latin America Oil and Gas Actuators Market, by Country, 2017-2030 (US$ Bn)
15.5.1. Latin America Oil and Gas Actuators Market, by Country, 2022 Vs 2030 (in%)
15.5.2. Brazil
15.5.2.1. Brazil Oil and Gas Actuators Market Estimates and Forecast, 2017-2030 (US$ Bn)
15.5.2.2. Brazil Oil and Gas Actuators, By Product Type, 2017-2030 (US$ Bn)
15.5.2.3. Brazil Oil and Gas Actuators, By Size, 2017-2030 (US$ Bn)
15.5.2.4. Brazil Oil and Gas Actuators, By Body Material, 2017-2030 (US$ Bn)
15.5.2.5. Brazil Oil and Gas Actuators, By Application, 2017-2030 (US$ Bn)
15.5.3. Argentina
15.5.3.1. Argentina Oil and Gas Actuators Market Estimates and Forecast, 2017-2030 (US$ Bn)
15.5.3.2. Argentina Oil and Gas Actuators, By Product Type, 2017-2030 (US$ Bn)
15.5.3.3. Argentina Oil and Gas Actuators, By Size, 2017-2030 (US$ Bn)
15.5.3.4. Argentina Oil and Gas Actuators, By Body Material, 2017-2030 (US$ Bn)
15.5.3.5. Argentina Oil and Gas Actuators, By Application, 2017-2030 (US$ Bn)
15.5.4. Rest of Latin America
15.5.4.1. Rest of Latin America Oil and Gas Actuators Market Estimates and Forecast, 2017-2030 (US$ Bn)
15.5.4.2. Rest of Latin America Oil and Gas Actuators, By Product Type, 2017-2030 (US$ Bn)
15.5.4.3. Rest of Latin America Oil and Gas Actuators, By Size, 2017-2030 (US$ Bn)
15.5.4.4. Rest of Latin America Oil and Gas Actuators, By Body Material, 2017-2030 (US$ Bn)
15.5.4.5. Rest of Latin America Oil and Gas Actuators, By Application, 2017-2030 (US$ Bn)

16. Middle East and Africa Oil and Gas Actuators Market Analysis
16.1. Middle East and Africa Oil and Gas Actuators Market, by Product Type, 2017-2030(US$ Bn)
16.1.1. Overview
16.1.2. SRC Analysis
16.2. Middle East and Africa Oil and Gas Actuators Market, by Size, 2017-2030(US$ Bn)
16.2.1. Overview
16.2.2. SRC Analysis
16.3. Middle East and Africa Oil and Gas Actuators Market, by Body Material, 2017-2030(US$ Bn)
16.3.1. Overview
16.3.2. SRC Analysis
16.4. Middle East and Africa Oil and Gas Actuators Market, by Application, 2017-2030(US$ Bn)
16.4.1. Overview
16.4.2. SRC Analysis
16.5. Middle East and Africa Oil and Gas Actuators Market, by Country, 2017-2030 (US$ Bn)
16.5.1. Middle East and Africa Oil and Gas Actuators Market, by Country, 2022 Vs 2030 (in%)
16.5.2. GCC Countries
16.5.2.1. GCC Countries Oil and Gas Actuators Market Estimates and Forecast, 2017-2030 (US$ Bn)
16.5.2.2. GCC Countries Oil and Gas Actuators, By Product Type, 2017-2030 (US$ Bn)
16.5.2.3. GCC Countries Oil and Gas Actuators, By Size, 2017-2030 (US$ Bn)
16.5.2.4. GCC Countries Oil and Gas Actuators, By Body Material, 2017-2030 (US$ Bn)
16.5.2.5. GCC Countries Oil and Gas Actuators, By Application, 2017-2030 (US$ Bn)
16.5.3. South Africa
16.5.3.1. South Africa Oil and Gas Actuators Market Estimates and Forecast, 2017-2030 (US$ Bn)
16.5.3.2. South Africa Oil and Gas Actuators, By Product Type, 2017-2030 (US$ Bn)
16.5.3.3. South Africa Oil and Gas Actuators, By Size, 2017-2030 (US$ Bn)
16.5.3.4. South Africa Oil and Gas Actuators, By Body Material, 2017-2030 (US$ Bn)
16.5.3.5. South Africa Oil and Gas Actuators, By Application, 2017-2030 (US$ Bn)
16.5.4. Rest of Middle East and Africa
16.5.4.1. Rest of Middle East and Africa Oil and Gas Actuators Market Estimates and Forecast, 2017-2030 (US$ Bn)
16.5.4.2. Rest of Middle East and Africa Oil and Gas Actuators, By Product Type, 2017-2030 (US$ Bn)
16.5.4.3. Rest of Middle East and Africa Oil and Gas Actuators, By Size, 2017-2030 (US$ Bn)
16.5.4.4. Rest of Middle East and Africa Oil and Gas Actuators, By Body Material, 2017-2030 (US$ Bn)
16.5.4.5. Rest of Middle East and Africa Oil and Gas Actuators, By Application, 2017-2030 (US$ Bn)

17. Company Profiles
17.1. Emerson Electric Co.
17.1.1. Company Overview
17.1.2. Products/Services Portfolio
17.1.3. Geographical Presence
17.1.4. Financial Summary
17.1.4.1. Market Revenue and Net Profit (2019-2022)
17.1.4.2. Business Segment Revenue Analysis
17.1.4.3. Geographical Revenue Analysis
17.2. Schlumberger Limited
17.3. Alfa Laval Corporate AB
17.4. Flowserve Corporation
17.5. Crane Co.
17.6. Rotork Plc
17.7. Metso Oyj
17.8. KITZ Corporation
17.9. IMI Critical Engineering
17.10. Samson Controls Inc.

List of Figures
FIG. 1 Global Oil and Gas Actuators Market: Research Methodology
FIG. 2 Market Size Estimation – Top Down & Bottom up Approach
FIG. 3 Global Oil and Gas Actuators Market Segmentation
FIG. 4 Global Oil and Gas Actuators Market, by Product Type, 2022 (US$ Bn)
FIG. 5 Global Oil and Gas Actuators Market, by Size, 2022 (US$ Bn)
FIG. 6 Global Oil and Gas Actuators Market, by Body Material, 2022 (US$ Bn)
FIG. 7 Global Oil and Gas Actuators Market, by Application, 2022 (US$ Bn)
FIG. 8 Global Oil and Gas Actuators Market, by Geography, 2022 (US$ Bn)
FIG. 9 Attractive Investment Proposition, by Product Type, 2022
FIG. 10 Attractive Investment Proposition, by Size, 2022
FIG. 11 Attractive Investment Proposition, by Body Material, 2022
FIG. 12 Attractive Investment Proposition, by Application, 2022
FIG. 13 Attractive Investment Proposition, by Geography, 2022
FIG. 14 Global Market Share Analysis of Key Oil and Gas Actuators Market Manufacturers, 2022
FIG. 15 Global Market Positioning of Key Oil and Gas Actuators Market Manufacturers, 2022
FIG. 16 Global Oil and Gas Actuators Market Value Contribution, By Product Type, 2022 & 2030 (Value %)
FIG. 17 Global Oil and Gas Actuators Market, by Gates, Value, 2017-2030 (US$ Bn)
FIG. 18 Global Oil and Gas Actuators Market, by Globes, Value, 2017-2030 (US$ Bn)
FIG. 19 Global Oil and Gas Actuators Market, by Bails, Value, 2017-2030 (US$ Bn)
FIG. 20 Global Oil and Gas Actuators Market, by Butterflies, Value, 2017-2030 (US$ Bn)
FIG. 21 Global Oil and Gas Actuators Market, by Checks, Value, 2017-2030 (US$ Bn)
FIG. 22 Global Oil and Gas Actuators Market, by PRVs, Value, 2017-2030 (US$ Bn)
FIG. 23 Global Oil and Gas Actuators Market, by Others, Value, 2017-2030 (US$ Bn)
FIG. 24 Global Oil and Gas Actuators Market Value Contribution, By Size, 2022 & 2030 (Value %)
FIG. 25 Global Oil and Gas Actuators Market, by 0.25 to 8 inches, Value, 2017-2030 (US$ Bn)
FIG. 26 Global Oil and Gas Actuators Market, by 8 to 20 inches, 2017-2030 (US$ Bn)
FIG. 27 Global Oil and Gas Actuators Market, by 8 to 20 inches, 2017-2030 (US$ Bn)
FIG. 28 Global Oil and Gas Actuators Market Value Contribution, By Body Material, 2022 & 2030 (Value %)
FIG. 29 Global Oil and Gas Actuators Market, by Cast, Value, 2017-2030 (US$ Bn)
FIG. 30 Global Oil and Gas Actuators Market, by Forged, 2017-2030 (US$ Bn)
FIG. 31 Global Oil and Gas Actuators Market Value Contribution, By Application, 2022 & 2030 (Value %)
FIG. 32 Global Oil and Gas Actuators Market, by Upstream, Value, 2017-2030 (US$ Bn)
FIG. 33 Global Oil and Gas Actuators Market, by Midstream, 2017-2030 (US$ Bn)
FIG. 34 Global Oil and Gas Actuators Market, by Downstream, 2017-2030 (US$ Bn)
FIG. 35 North America Oil and Gas Actuators Market, 2017-2030 (US$ Bn)
FIG. 36 U.S. Oil and Gas Actuators Market, 2017-2030 (US$ Bn)
FIG. 37 Canada Oil and Gas Actuators Market, 2017-2030 (US$ Bn)
FIG. 38 Europe Oil and Gas Actuators Market, 2017-2030 (US$ Bn)
FIG. 39 Germany Oil and Gas Actuators Market, 2017-2030 (US$ Bn)
FIG. 40 France Oil and Gas Actuators Market, 2017-2030 (US$ Bn)
FIG. 41 U.K. Oil and Gas Actuators Market, 2017-2030 (US$ Bn)
FIG. 42 Italy Oil and Gas Actuators Market, 2017-2030 (US$ Bn)
FIG. 43 Spain Oil and Gas Actuators Market, 2017-2030 (US$ Bn)
FIG. 44 Rest of Europe Oil and Gas Actuators Market, 2017-2030 (US$ Bn)
FIG. 45 Asia Pacific Oil and Gas Actuators Market, 2017-2030 (US$ Bn)
FIG. 46 China Oil and Gas Actuators Market, 2017-2030 (US$ Bn)
FIG. 47 Japan Oil and Gas Actuators Market, 2017-2030 (US$ Bn)
FIG. 48 India Oil and Gas Actuators Market, 2017-2030 (US$ Bn)
FIG. 49 South Korea Oil and Gas Actuators Market, 2017-2030 (US$ Bn)
FIG. 50 South-East Asia Oil and Gas Actuators Market, 2017-2030 (US$ Bn)
FIG. 51 Rest of Asia Pacific Oil and Gas Actuators Market, 2017-2030 (US$ Bn)
FIG. 52 Latin America Oil and Gas Actuators Market, 2017-2030 (US$ Bn)
FIG. 53 Brazil Oil and Gas Actuators Market, 2017-2030 (US$ Bn)
FIG. 54 Mexico Oil and Gas Actuators Market, 2017-2030 (US$ Bn)
FIG. 55 Rest of Latin America Oil and Gas Actuators Market, 2017-2030 (US$ Bn)
FIG. 56 Middle East & Africa Oil and Gas Actuators Market, 2017-2030 (US$ Bn)
FIG. 57 GCC Countries Oil and Gas Actuators Market, 2017-2030 (US$ Bn)
FIG. 58 South Africa Oil and Gas Actuators Market, 2017-2030 (US$ Bn)
FIG. 59 Rest of Middle East and Africa Oil and Gas Actuators Market, 2017-2030 (US$ Bn)

List of Tables
TABLE 1 Market Snapshot: Global Oil and Gas Actuators Market
TABLE 2 Global Oil and Gas Actuators Market: Market Drivers Impact Analysis
TABLE 3 Global Oil and Gas Actuators Market: Market Restraints Impact Analysis
TABLE 4 Global Oil and Gas Actuators Market, by Competitive Benchmarking, 2022
TABLE 5 Global Oil and Gas Actuators Market, by Geographical Presence Analysis, 2022
TABLE 6 Global Oil and Gas Actuators Market, by Key Strategies Analysis, 2022
TABLE 7 Global Oil and Gas Actuators Market, by Gates, By Region, 2017-2022 (US$ Bn)
TABLE 8 Global Oil and Gas Actuators Market, by Gates, By Region, 2023-2030 (US$ Bn)
TABLE 9 Global Oil and Gas Actuators Market, by Globes, By Region, 2017-2022 (US$ Bn)
TABLE 10 Global Oil and Gas Actuators Market, by Globes, By Region, 2023-2030 (US$ Bn)
TABLE 11 Global Oil and Gas Actuators Market, by Bails, By Region, 2017-2022 (US$ Bn)
TABLE 12 Global Oil and Gas Actuators Market, by Bails, By Region, 2023-2030 (US$ Bn)
TABLE 13 Global Oil and Gas Actuators Market, by Butterflies, By Region, 2017-2022 (US$ Bn)
TABLE 14 Global Oil and Gas Actuators Market, by Butterflies, By Region, 2023-2030 (US$ Bn)
TABLE 15 Global Oil and Gas Actuators Market, by Checks, By Region, 2017-2022 (US$ Bn)
TABLE 16 Global Oil and Gas Actuators Market, by Checks, By Region, 2023-2030 (US$ Bn)
TABLE 17 Global Oil and Gas Actuators Market, by PRVs, By Region, 2017-2022 (US$ Bn)
TABLE 18 Global Oil and Gas Actuators Market, by PRVs, By Region, 2023-2030 (US$ Bn)
TABLE 19 Global Oil and Gas Actuators Market, by Others, By Region, 2017-2022 (US$ Bn)
TABLE 20 Global Oil and Gas Actuators Market, by Others, By Region, 2023-2030 (US$ Bn)
TABLE 21 Global Oil and Gas Actuators Market, by 0.25 to 8 inches, By Region, 2017-2022 (US$ Bn)
TABLE 22 Global Oil and Gas Actuators Market, by 0.25 to 8 inches, By Region, 2023-2030 (US$ Bn)
TABLE 23 Global Oil and Gas Actuators Market, by 8 to 20 inches, By Region, 2017-2022 (US$ Bn)
TABLE 24 Global Oil and Gas Actuators Market, by 8 to 20 inches, By Region, 2023-2030 (US$ Bn)
TABLE 25 Global Oil and Gas Actuators Market, by Above 20 inches, By Region, 2017-2022 (US$ Bn)
TABLE 26 Global Oil and Gas Actuators Market, by Above 20 inches, By Region, 2023-2030 (US$ Bn)
TABLE 27 Global Oil and Gas Actuators Market, by Cast, By Region, 2017-2022 (US$ Bn)
TABLE 28 Global Oil and Gas Actuators Market, by Cast, By Region, 2023-2030 (US$ Bn)
TABLE 29 Global Oil and Gas Actuators Market, by Forgeds, By Region, 2017-2022 (US$ Bn)
TABLE 30 Global Oil and Gas Actuators Market, by Forgeds, By Region, 2023-2030 (US$ Bn)
TABLE 31 Global Oil and Gas Actuators Market, by Upstream, By Region, 2017-2022 (US$ Bn)
TABLE 32 Global Oil and Gas Actuators Market, by Upstream, By Region, 2023-2030 (US$ Bn)
TABLE 33 Global Oil and Gas Actuators Market, by Midstream, By Region, 2017-2022 (US$ Bn)
TABLE 34 Global Oil and Gas Actuators Market, by Midstream, By Region, 2023-2030 (US$ Bn)
TABLE 35 Global Oil and Gas Actuators Market, by Downstream, By Region, 2017-2022 (US$ Bn)
TABLE 36 Global Oil and Gas Actuators Market, by Downstream, By Region, 2023-2030 (US$ Bn)
TABLE 37 Global Oil and Gas Actuators Market, by Product Type, 2017-2022 (US$ Bn)
TABLE 38 Global Oil and Gas Actuators Market, by Product Type, 2023-2030 (US$ Bn)
TABLE 39 Global Oil and Gas Actuators Market, by Size, 2017-2022 (US$ Bn)
TABLE 40 Global Oil and Gas Actuators Market, by Size, 2023-2030 (US$ Bn)
TABLE 41 Global Oil and Gas Actuators Market, by Body Material, 2017-2022 (US$ Bn)
TABLE 42 Global Oil and Gas Actuators Market, by Body Material, 2023-2030 (US$ Bn)
TABLE 43 Global Oil and Gas Actuators Market, by Body Material, 2017-2022 (US$ Bn)
TABLE 44 Global Oil and Gas Actuators Market, by Body Material, 2023-2030 (US$ Bn)
TABLE 45 Global Oil and Gas Actuators Market, by Region, 2017-2022 (US$ Bn)
TABLE 46 Global Oil and Gas Actuators Market, by Region, 2023-2030 (US$ Bn)
TABLE 47 North America Oil and Gas Actuators Market, by Product Type, 2017-2022 (US$ Bn)
TABLE 48 North America Oil and Gas Actuators Market, by Product Type, 2023-2030 (US$ Bn)
TABLE 49 North America Oil and Gas Actuators Market, by Size, 2017-2022 (US$ Bn)
TABLE 50 North America Oil and Gas Actuators Market, by Size, 2023-2030 (US$ Bn)
TABLE 51 North America Oil and Gas Actuators Market, by Body Material, 2017-2022 (US$ Bn)
TABLE 52 North America Oil and Gas Actuators Market, by Body Material, 2023-2030 (US$ Bn)
TABLE 53 North America Oil and Gas Actuators Market, by Body Material, 2017-2022 (US$ Bn)
TABLE 54 North America Oil and Gas Actuators Market, by Body Material, 2023-2030 (US$ Bn)
TABLE 55 North America Oil and Gas Actuators Market, by Country, 2017-2022 (US$ Bn)
TABLE 56 North America Oil and Gas Actuators Market, by Country, 2023-2030 (US$ Bn)
TABLE 57 United States Oil and Gas Actuators Market, by Product Type, 2017-2022 (US$ Bn)
TABLE 58 United States Oil and Gas Actuators Market, by Product Type, 2023-2030 (US$ Bn)
TABLE 59 United States Oil and Gas Actuators Market, by Size, 2017-2022 (US$ Bn)
TABLE 60 United States Oil and Gas Actuators Market, by Size, 2023-2030 (US$ Bn)
TABLE 61 United States Oil and Gas Actuators Market, by Body Material, 2017-2022 (US$ Bn)
TABLE 62 United States Oil and Gas Actuators Market, by Body Material, 2023-2030 (US$ Bn)
TABLE 63 United States Oil and Gas Actuators Market, by Application, 2017-2022 (US$ Bn)
TABLE 64 United States Oil and Gas Actuators Market, by Application, 2023-2030 (US$ Bn)
TABLE 65 Canada Oil and Gas Actuators Market, by Product Type, 2017-2022 (US$ Bn)
TABLE 66 Canada Oil and Gas Actuators Market, by Product Type, 2023-2030 (US$ Bn)
TABLE 67 Canada Oil and Gas Actuators Market, by Size, 2017-2022 (US$ Bn)
TABLE 68 Canada Oil and Gas Actuators Market, by Size, 2023-2030 (US$ Bn)
TABLE 69 Canada Oil and Gas Actuators Market, by Body Material, 2017-2022 (US$ Bn)
TABLE 70 Canada Oil and Gas Actuators Market, by Body Material, 2023-2030 (US$ Bn)
TABLE 71 Canada Oil and Gas Actuators Market, by Application, 2017-2022 (US$ Bn)
TABLE 72 Canada Oil and Gas Actuators Market, by Application, 2023-2030 (US$ Bn)
TABLE 73 Mexico Oil and Gas Actuators Market, by Product Type, 2017-2022 (US$ Bn)
TABLE 74 Mexico Oil and Gas Actuators Market, by Product Type, 2023-2030 (US$ Bn)
TABLE 75 Mexico Oil and Gas Actuators Market, by Size, 2017-2022 (US$ Bn)
TABLE 76 Mexico Oil and Gas Actuators Market, by Size, 2023-2030 (US$ Bn)
TABLE 77 Mexico Oil and Gas Actuators Market, by Body Material, 2017-2022 (US$ Bn)
TABLE 78 Mexico Oil and Gas Actuators Market, by Body Material, 2023-2030 (US$ Bn)
TABLE 79 Mexico Oil and Gas Actuators Market, by Application, 2017-2022 (US$ Bn)
TABLE 80 Mexico Oil and Gas Actuators Market, by Application, 2023-2030 (US$ Bn)
TABLE 81 Europe Oil and Gas Actuators Market, by Product Type, 2017-2022 (US$ Bn)
TABLE 82 Europe Oil and Gas Actuators Market, by Product Type, 2023-2030 (US$ Bn)
TABLE 83 Europe Oil and Gas Actuators Market, by Size, 2017-2022 (US$ Bn)
TABLE 84 Europe Oil and Gas Actuators Market, by Size, 2023-2030 (US$ Bn)
TABLE 85 Europe Oil and Gas Actuators Market, by Body Material, 2017-2022 (US$ Bn)
TABLE 86 Europe Oil and Gas Actuators Market, by Body Material, 2023-2030 (US$ Bn)
TABLE 87 Europe Oil and Gas Actuators Market, by Application, 2017-2022 (US$ Bn)
TABLE 88 Europe Oil and Gas Actuators Market, by Application, 2023-2030 (US$ Bn)
TABLE 89 Europe Oil and Gas Actuators Market, by Country, 2017-2022 (US$ Bn)
TABLE 90 Europe Oil and Gas Actuators Market, by Country, 2023-2030 (US$ Bn)
TABLE 91 Germany Oil and Gas Actuators Market, by Product Type, 2017-2022 (US$ Bn)
TABLE 92 Germany Oil and Gas Actuators Market, by Product Type, 2023-2030 (US$ Bn)
TABLE 93 Germany Oil and Gas Actuators Market, by Size, 2017-2022 (US$ Bn)
TABLE 94 Germany Oil and Gas Actuators Market, by Size, 2023-2030 (US$ Bn)
TABLE 95 Germany Oil and Gas Actuators Market, by Body Material, 2017-2022 (US$ Bn)
TABLE 96 Germany Oil and Gas Actuators Market, by Body Material, 2023-2030 (US$ Bn)
TABLE 97 Germany Oil and Gas Actuators Market, by Application, 2017-2022 (US$ Bn)
TABLE 98 Germany Oil and Gas Actuators Market, by Application, 2023-2030 (US$ Bn)
TABLE 99 France Oil and Gas Actuators Market, by Product Type, 2017-2022 (US$ Bn)
TABLE 100 France Oil and Gas Actuators Market, by Product Type, 2023-2030 (US$ Bn)
TABLE 101 France Oil and Gas Actuators Market, by Size, 2017-2022 (US$ Bn)
TABLE 102 France Oil and Gas Actuators Market, by Size, 2023-2030 (US$ Bn)
TABLE 103 France Oil and Gas Actuators Market, by Body Material, 2017-2022 (US$ Bn)
TABLE 104 France Oil and Gas Actuators Market, by Body Material, 2023-2030 (US$ Bn)
TABLE 105 France Oil and Gas Actuators Market, by Application, 2017-2022 (US$ Bn)
TABLE 106 France Oil and Gas Actuators Market, by Application, 2023-2030 (US$ Bn)
TABLE 107 United Kingdom Oil and Gas Actuators Market, by Product Type, 2017-2022 (US$ Bn)
TABLE 108 United Kingdom Oil and Gas Actuators Market, by Product Type, 2023-2030 (US$ Bn)
TABLE 109 United Kingdom Oil and Gas Actuators Market, by Size, 2017-2022 (US$ Bn)
TABLE 110 United Kingdom Oil and Gas Actuators Market, by Size, 2023-2030 (US$ Bn)
TABLE 111 United Kingdom Oil and Gas Actuators Market, by Body Material, 2017-2022 (US$ Bn)
TABLE 112 United Kingdom Oil and Gas Actuators Market, by Body Material, 2023-2030 (US$ Bn)
TABLE 113 United Kingdom Oil and Gas Actuators Market, by Application, 2017-2022 (US$ Bn)
TABLE 114 United Kingdom Oil and Gas Actuators Market, by Application, 2023-2030 (US$ Bn)
TABLE 115 Italy Oil and Gas Actuators Market, by Product Type, 2017-2022 (US$ Bn)
TABLE 116 Italy Oil and Gas Actuators Market, by Product Type, 2023-2030 (US$ Bn)
TABLE 117 Italy Oil and Gas Actuators Market, by Size, 2017-2022 (US$ Bn)
TABLE 118 Italy Oil and Gas Actuators Market, by Size, 2023-2030 (US$ Bn)
TABLE 119 Italy Oil and Gas Actuators Market, by Body Material, 2017-2022 (US$ Bn)
TABLE 120 Italy Oil and Gas Actuators Market, by Body Material, 2023-2030 (US$ Bn)
TABLE 121 Italy Oil and Gas Actuators Market, by Application, 2017-2022 (US$ Bn)
TABLE 122 Italy Oil and Gas Actuators Market, by Application, 2023-2030 (US$ Bn)
TABLE 123 Spain Oil and Gas Actuators Market, by Product Type, 2017-2022 (US$ Bn)
TABLE 124 Spain Oil and Gas Actuators Market, by Product Type, 2023-2030 (US$ Bn)
TABLE 125 Spain Oil and Gas Actuators Market, by Size, 2017-2022 (US$ Bn)
TABLE 126 Spain Oil and Gas Actuators Market, by Size, 2023-2030 (US$ Bn)
TABLE 127 Spain Oil and Gas Actuators Market, by Body Material, 2017-2022 (US$ Bn)
TABLE 128 Spain Oil and Gas Actuators Market, by Body Material, 2023-2030 (US$ Bn)
TABLE 129 Spain Oil and Gas Actuators Market, by Application, 2017-2022 (US$ Bn)
TABLE 130 Spain Oil and Gas Actuators Market, by Application, 2023-2030 (US$ Bn)
TABLE 131 Rest of Europe Oil and Gas Actuators Market, by Product Type, 2017-2022 (US$ Bn)
TABLE 132 Rest of Europe Oil and Gas Actuators Market, by Product Type, 2023-2030 (US$ Bn)
TABLE 133 Rest of Europe Oil and Gas Actuators Market, by Size, 2017-2022 (US$ Bn)
TABLE 134 Rest of Europe Oil and Gas Actuators Market, by Size, 2023-2030 (US$ Bn)
TABLE 135 Rest of Europe Oil and Gas Actuators Market, by Body Material, 2017-2022 (US$ Bn)
TABLE 136 Rest of Europe Oil and Gas Actuators Market, by Body Material, 2023-2030 (US$ Bn)
TABLE 137 Rest of Europe Oil and Gas Actuators Market, by Application, 2017-2022 (US$ Bn)
TABLE 138 Rest of Europe Oil and Gas Actuators Market, by Application, 2023-2030 (US$ Bn)
TABLE 139 Asia Pacific Oil and Gas Actuators Market, by Product Type, 2017-2022 (US$ Bn)
TABLE 140 Asia Pacific Oil and Gas Actuators Market, by Product Type, 2023-2030 (US$ Bn)
TABLE 141 Asia Pacific Oil and Gas Actuators Market, by Size, 2017-2022 (US$ Bn)
TABLE 142 Asia Pacific Oil and Gas Actuators Market, by Size, 2023-2030 (US$ Bn)
TABLE 143 Asia Pacific Oil and Gas Actuators Market, by Body Material, 2017-2022 (US$ Bn)
TABLE 144 Asia Pacific Oil and Gas Actuators Market, by Body Material, 2023-2030 (US$ Bn)
TABLE 145 Asia Pacific Oil and Gas Actuators Market, by Application, 2017-2022 (US$ Bn)
TABLE 146 Asia Pacific Oil and Gas Actuators Market, by Application, 2023-2030 (US$ Bn)
TABLE 147 China Oil and Gas Actuators Market, by Product Type, 2017-2022 (US$ Bn)
TABLE 148 China Oil and Gas Actuators Market, by Product Type, 2023-2030 (US$ Bn)
TABLE 149 China Oil and Gas Actuators Market, by Size, 2017-2022 (US$ Bn)
TABLE 150 China Oil and Gas Actuators Market, by Size, 2023-2030 (US$ Bn)
TABLE 151 China Oil and Gas Actuators Market, by Body Material, 2017-2022 (US$ Bn)
TABLE 152 China Oil and Gas Actuators Market, by Body Material, 2023-2030 (US$ Bn)
TABLE 153 China Oil and Gas Actuators Market, by Application, 2017-2022 (US$ Bn)
TABLE 154 China Oil and Gas Actuators Market, by Application, 2023-2030 (US$ Bn)
TABLE 155 Japan Oil and Gas Actuators Market, by Product Type, 2017-2022 (US$ Bn)
TABLE 156 Japan Oil and Gas Actuators Market, by Product Type, 2023-2030 (US$ Bn)
TABLE 157 Japan Oil and Gas Actuators Market, by Size, 2017-2022 (US$ Bn)
TABLE 158 Japan Oil and Gas Actuators Market, by Size, 2023-2030 (US$ Bn)
TABLE 159 Japan Oil and Gas Actuators Market, by Body Material, 2017-2022 (US$ Bn)
TABLE 160 Japan Oil and Gas Actuators Market, by Body Material, 2023-2030 (US$ Bn)
TABLE 161 Japan Oil and Gas Actuators Market, by Application, 2017-2022 (US$ Bn)
TABLE 162 Japan Oil and Gas Actuators Market, by Application, 2023-2030 (US$ Bn)
TABLE 163 India Oil and Gas Actuators Market, by Product Type, 2017-2022 (US$ Bn)
TABLE 164 India Oil and Gas Actuators Market, by Product Type, 2023-2030 (US$ Bn)
TABLE 165 India Oil and Gas Actuators Market, by Size, 2017-2022 (US$ Bn)
TABLE 166 India Oil and Gas Actuators Market, by Size, 2023-2030 (US$ Bn)
TABLE 167 India Oil and Gas Actuators Market, by Body Material, 2017-2022 (US$ Bn)
TABLE 168 India Oil and Gas Actuators Market, by Body Material, 2023-2030 (US$ Bn)
TABLE 169 India Oil and Gas Actuators Market, by Application, 2017-2022 (US$ Bn)
TABLE 170 India Oil and Gas Actuators Market, by Application, 2023-2030 (US$ Bn)
TABLE 171 South Korea Oil and Gas Actuators Market, by Product Type, 2017-2022 (US$ Bn)
TABLE 172 South Korea Oil and Gas Actuators Market, by Product Type, 2023-2030 (US$ Bn)
TABLE 173 South Korea Oil and Gas Actuators Market, by Size, 2017-2022 (US$ Bn)
TABLE 174 South Korea Oil and Gas Actuators Market, by Size, 2023-2030 (US$ Bn)
TABLE 175 South Korea Oil and Gas Actuators Market, by Body Material, 2017-2022 (US$ Bn)
TABLE 176 South Korea Oil and Gas Actuators Market, by Body Material, 2023-2030 (US$ Bn)
TABLE 177 South Korea Oil and Gas Actuators Market, by Application, 2017-2022 (US$ Bn)
TABLE 178 South Korea Oil and Gas Actuators Market, by Application, 2023-2030 (US$ Bn)
TABLE 179 South-East Asia Oil and Gas Actuators Market, by Product Type, 2017-2022 (US$ Bn)
TABLE 180 South-East Asia Oil and Gas Actuators Market, by Product Type, 2023-2030 (US$ Bn)
TABLE 181 South-East Asia Oil and Gas Actuators Market, by Size, 2017-2022 (US$ Bn)
TABLE 182 South-East Asia Oil and Gas Actuators Market, by Size, 2023-2030 (US$ Bn)
TABLE 183 South-East Asia Oil and Gas Actuators Market, by Body Material, 2017-2022 (US$ Bn)
TABLE 184 South-East Asia Oil and Gas Actuators Market, by Body Material, 2023-2030 (US$ Bn)
TABLE 185 South-East Asia Oil and Gas Actuators Market, by Application, 2017-2022 (US$ Bn)
TABLE 186 South-East Asia Oil and Gas Actuators Market, by Application, 2023-2030 (US$ Bn)
TABLE 187 Rest of Asia Pacific Oil and Gas Actuators Market, by Product Type, 2017-2022 (US$ Bn)
TABLE 188 Rest of Asia Pacific Oil and Gas Actuators Market, by Product Type, 2023-2030 (US$ Bn)
TABLE 189 Rest of Asia Pacific Oil and Gas Actuators Market, by Size, 2017-2022 (US$ Bn)
TABLE 190 Rest of Asia Pacific Oil and Gas Actuators Market, by Size, 2023-2030 (US$ Bn)
TABLE 191 Rest of Asia Pacific Oil and Gas Actuators Market, by Body Material, 2017-2022 (US$ Bn)
TABLE 192 Rest of Asia Pacific Oil and Gas Actuators Market, by Body Material, 2023-2030 (US$ Bn)
TABLE 193 Rest of Asia Pacific Oil and Gas Actuators Market, by Application, 2017-2022 (US$ Bn)
TABLE 194 Rest of Asia Pacific Oil and Gas Actuators Market, by Application, 2023-2030 (US$ Bn)
TABLE 195 Latin America Oil and Gas Actuators Market, by Product Type, 2017-2022 (US$ Bn)
TABLE 196 Latin America Oil and Gas Actuators Market, by Product Type, 2023-2030 (US$ Bn)
TABLE 197 Latin America Oil and Gas Actuators Market, by Size, 2017-2022 (US$ Bn)
TABLE 198 Latin America Oil and Gas Actuators Market, by Size, 2023-2030 (US$ Bn)
TABLE 199 Latin America Oil and Gas Actuators Market, by Body Material, 2017-2022 (US$ Bn)
TABLE 200 Latin America Oil and Gas Actuators Market, by Body Material, 2023-2030 (US$ Bn)
TABLE 201 Latin America Oil and Gas Actuators Market, by Application, 2017-2022 (US$ Bn)
TABLE 202 Latin America Oil and Gas Actuators Market, by Application, 2023-2030 (US$ Bn)
TABLE 203 Brazil Oil and Gas Actuators Market, by Product Type, 2017-2022 (US$ Bn)
TABLE 204 Brazil Oil and Gas Actuators Market, by Product Type, 2023-2030 (US$ Bn)
TABLE 205 Brazil Oil and Gas Actuators Market, by Size, 2017-2022 (US$ Bn)
TABLE 206 Brazil Oil and Gas Actuators Market, by Size, 2023-2030 (US$ Bn)
TABLE 207 Brazil Oil and Gas Actuators Market, by Body Material, 2017-2022 (US$ Bn)
TABLE 208 Brazil Oil and Gas Actuators Market, by Body Material, 2023-2030 (US$ Bn)
TABLE 209 Brazil Oil and Gas Actuators Market, by Application, 2017-2022 (US$ Bn)
TABLE 210 Brazil Oil and Gas Actuators Market, by Application, 2023-2030 (US$ Bn)
TABLE 211 Argentina Oil and Gas Actuators Market, by Product Type, 2017-2022 (US$ Bn)
TABLE 212 Argentina Oil and Gas Actuators Market, by Product Type, 2023-2030 (US$ Bn)
TABLE 213 Argentina Oil and Gas Actuators Market, by Size, 2017-2022 (US$ Bn)
TABLE 214 Argentina Oil and Gas Actuators Market, by Size, 2023-2030 (US$ Bn)
TABLE 215 Argentina Oil and Gas Actuators Market, by Body Material, 2017-2022 (US$ Bn)
TABLE 216 Argentina Oil and Gas Actuators Market, by Body Material, 2023-2030 (US$ Bn)
TABLE 217 Argentina Oil and Gas Actuators Market, by Application, 2017-2022 (US$ Bn)
TABLE 218 Argentina Oil and Gas Actuators Market, by Application, 2023-2030 (US$ Bn)
TABLE 219 Rest of Latin America Oil and Gas Actuators Market, by Product Type, 2017-2022 (US$ Bn)
TABLE 220 Rest of Latin America Oil and Gas Actuators Market, by Product Type, 2023-2030 (US$ Bn)
TABLE 221 Rest of Latin America Oil and Gas Actuators Market, by Size, 2017-2022 (US$ Bn)
TABLE 222 Rest of Latin America Oil and Gas Actuators Market, by Size, 2023-2030 (US$ Bn)
TABLE 223 Rest of Latin America Oil and Gas Actuators Market, by Body Material, 2017-2022 (US$ Bn)
TABLE 224 Rest of Latin America Oil and Gas Actuators Market, by Body Material, 2023-2030 (US$ Bn)
TABLE 225 Rest of Latin America Oil and Gas Actuators Market, by Application, 2017-2022 (US$ Bn)
TABLE 226 Rest of Latin America Oil and Gas Actuators Market, by Application, 2023-2030 (US$ Bn)
TABLE 227 Middle East and Africa Oil and Gas Actuators Market, by Product Type, 2017-2022 (US$ Bn)
TABLE 228 Middle East and Africa Oil and Gas Actuators Market, by Product Type, 2023-2030 (US$ Bn)
TABLE 229 Middle East and Africa Oil and Gas Actuators Market, by Size, 2017-2022 (US$ Bn)
TABLE 230 Middle East and Africa Oil and Gas Actuators Market, by Size, 2023-2030 (US$ Bn)
TABLE 231 Middle East and Africa Oil and Gas Actuators Market, by Body Material, 2017-2022 (US$ Bn)
TABLE 232 Middle East and Africa Oil and Gas Actuators Market, by Body Material, 2023-2030 (US$ Bn)
TABLE 233 Middle East and Africa Oil and Gas Actuators Market, by Application, 2017-2022 (US$ Bn)
TABLE 234 Middle East and Africa Oil and Gas Actuators Market, by Application, 2023-2030 (US$ Bn)
TABLE 235 GCC Countries Oil and Gas Actuators Market, by Product Type, 2017-2022 (US$ Bn)
TABLE 236 GCC Countries Oil and Gas Actuators Market, by Product Type, 2023-2030 (US$ Bn)
TABLE 237 GCC Countries Oil and Gas Actuators Market, by Size, 2017-2022 (US$ Bn)
TABLE 238 GCC Countries Oil and Gas Actuators Market, by Size, 2023-2030 (US$ Bn)
TABLE 239 GCC Countries Oil and Gas Actuators Market, by Body Material, 2017-2022 (US$ Bn)
TABLE 240 GCC Countries Oil and Gas Actuators Market, by Body Material, 2023-2030 (US$ Bn)
TABLE 241 GCC Countries Oil and Gas Actuators Market, by Application, 2017-2022 (US$ Bn)
TABLE 242 GCC Countries Oil and Gas Actuators Market, by Application, 2023-2030 (US$ Bn)
TABLE 243 South Africa Oil and Gas Actuators Market, by Product Type, 2017-2022 (US$ Bn)
TABLE 244 South Africa Oil and Gas Actuators Market, by Product Type, 2023-2030 (US$ Bn)
TABLE 245 South Africa Oil and Gas Actuators Market, by Size, 2017-2022 (US$ Bn)
TABLE 246 South Africa Oil and Gas Actuators Market, by Size, 2023-2030 (US$ Bn)
TABLE 247 South Africa Oil and Gas Actuators Market, by Body Material, 2017-2022 (US$ Bn)
TABLE 248 South Africa Oil and Gas Actuators Market, by Body Material, 2023-2030 (US$ Bn)
TABLE 249 South Africa Oil and Gas Actuators Market, by Application, 2017-2022 (US$ Bn)
TABLE 250 South Africa Oil and Gas Actuators Market, by Application, 2023-2030 (US$ Bn)
TABLE 251 Rest of Middle East and Africa Oil and Gas Actuators Market, by Product Type, 2017-2022 (US$ Bn)
TABLE 252 Rest of Middle East and Africa Oil and Gas Actuators Market, by Product Type, 2023-2030 (US$ Bn)
TABLE 253 Rest of Middle East and Africa Oil and Gas Actuators Market, by Size, 2017-2022 (US$ Bn)
TABLE 254 Rest of Middle East and Africa Oil and Gas Actuators Market, by Size, 2023-2030 (US$ Bn)
TABLE 255 Rest of Middle East and Africa Oil and Gas Actuators Market, by Body Material, 2017-2022 (US$ Bn)
TABLE 256 Rest of Middle East and Africa Oil and Gas Actuators Market, by Body Material, 2023-2030 (US$ Bn)
TABLE 257 Rest of Middle East and Africa Oil and Gas Actuators Market, by Application, 2017-2022 (US$ Bn)
TABLE 258 Rest of Middle East and Africa Oil and Gas Actuators Market, by Application, 2023-2030 (US$ Bn)

Frequently Asked Questions

What is the current size of the global Oil and Gas Actuators market?

The global Oil and Gas Actuators market was valued at USD 7.1 Billion in 2022.

What is the expected growth rate of the Oil and Gas Actuators market between 2023 and 2030?

The Oil and Gas Actuators market is expected to grow at a CAGR of 2.90% between 2023 and 2030, reaching USD 8.67 Billion in 2030.

Which segment is leading the market share in terms of Product Type?

Regarding product type, the Gates category dominates the oil and gas actuators market globally.

Which Size segment governs the demand for Oil and Gas Actuators worldwide?

By 2022, the 0.25 to 8 inches category is anticipated to hold a market share of more than 40%.

Which segment is expected to post the highest CAGR during the forecast period?

Throughout the anticipated period, the casting segment will continue to be the largest oil and gas actuators market.

Which region is fueling the growth of the Oil and Gas Actuators industry?

By 2022, North America is anticipated to hold a market share of over 40%.

Who are the major players in the global Oil and Gas Actuators market?

The top players include Emerson Electric Co., Schlumberger Limited, Alfa Laval Corporate AB, Flowserve Corporation, Crane Co., Rotork Plc, Metso Oyj, KITZ Corporation, IMI Critical Engineering, and Samson Controls Inc.

What are the major market drivers of the Oil and Gas Actuators industry?

In the upcoming years, the oil and gas actuators industry is anticipated to expand due to various causes, such as the development of novel actuator applications, the penetration of new markets, and the emergence of the IoT.

What are the major market restraints of the Oil and Gas Actuators industry?

A variety of market constraints could impede expansion. The high price of actuators, the absence of standards, the erratic nature of the oil and gas sector, and regulatory difficulties are a few of these limitations.

What are the major market opportunities of the Oil and Gas Actuators industry?

Actuators are now in greater demand due to the complexity and difficulty of offshore oil and gas activities, which are the major opportunities in the Oil and Gas Actuators industry.

Artificial Lift Systems Market

Published:
Report ID: 2043

Drilling Fluids Market

Published:
Report ID: 5398

Intelligent Pigging Services Market

Published:
Report ID: 6909

Drill Bits Market

Published:
Report ID: 5399

Pipeline Leak Detection Market

Published:
Report ID: 9703

Pressure Pumping Market

Published:
Report ID: 6029

Sulphur Recovery Technology Market

Published:
Report ID: 10000

Production Oilfield Services & Equipment Market

Published:
Report ID: 8057

Gas Detection Equipment Market

Published:
Report ID: 6046

Drilling Polymers Market

Published:
Report ID: 23676

Biodiesel Market

Published:
Report ID: 3129

Liner Hanger System Market

Published:
Report ID: 19184

Purchase Options

$2999
Delivery Format: Excel.
$4999
Designed for the individual purchaser.
$6999
Users located at a single corporate site or regional office.
$7999
Allowed for unlimited sharing globally within one company.
Smallform of Sample request

Have a question?

User Profile

Don’t settle for less – trust Mitul to help you find the best solution.

Report delivery within 24 to 48 hours

– Other Info –

What people say?-

User Review

I am very impressed with the information in this report. The author clearly did their research when they came up with this product and it has already given me a lot of ideas.

Jana Schmidt
CEDAR CX Technologies

– Connect with us –

Phone

+91 6232 49 3207


support

24/7 Research Support


sales@credenceresearch.com

– Research Methodology –

Going beyond the basics: advanced techniques in research methodology

– Trusted By –

Pepshi, LG, Nestle
Motorola, Honeywell, Johnson and johnson
LG Chem, SIEMENS, Pfizer
Unilever, Samsonite, QIAGEN