Market Overview:
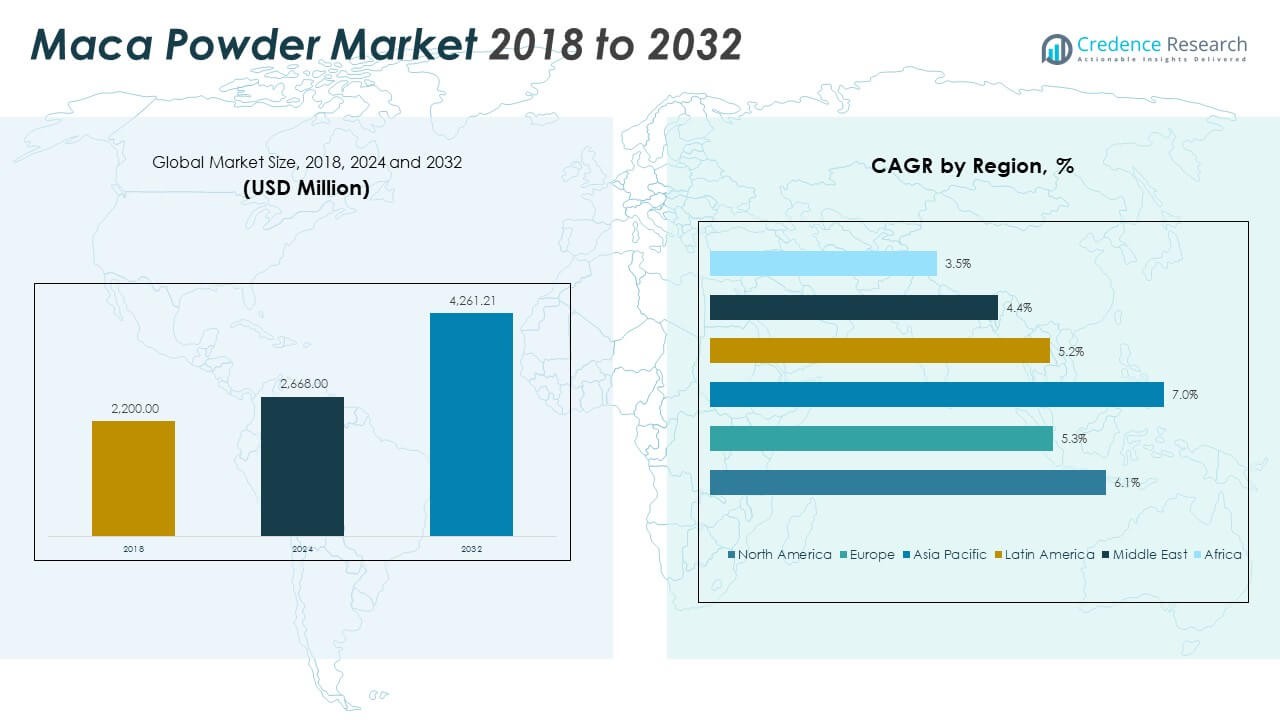
The Maca Powder Market size was valued at USD 2,200.00 million in 2018 to USD 2,668.00 million in 2024 and is anticipated to reach USD 4,261.21 million by 2032, at a CAGR of 6.08% during the forecast period.
| REPORT ATTRIBUTE |
DETAILS |
| Historical Period |
2020-2023 |
| Base Year |
2024 |
| Forecast Period |
2025-2032 |
| Maca Powder Market Size 2024 |
USD 2,668.00 Million |
| Maca Powder Market, CAGR |
6.08% |
| Maca Powder Market Size 2032 |
USD 4,261.21 Million |
Market growth is primarily driven by the increasing demand for natural, plant-based, and functional food ingredients. Consumers are becoming more health-conscious and are shifting toward superfoods like maca powder for their nutritional and adaptogenic benefits. It is widely used for improving stamina, hormonal balance, and vitality, attracting both sports and wellness consumers. The rising preference for clean-label and organic products is prompting manufacturers to invest in product diversification and certifications to meet evolving consumer expectations.
Regionally, Asia Pacific leads the market due to growing consumer awareness and expanding dietary supplement consumption across China, Japan, and India. North America follows closely, supported by a mature health and wellness industry and strong e-commerce penetration. Europe records consistent growth, fueled by the rising vegan population and sustainable sourcing trends. Latin America remains a key production base, particularly Peru, while the Middle East and Africa show emerging potential driven by lifestyle transitions and increasing urbanization.
Market Insights:
- The market was valued at USD 2,200.00 million in 2018, reached USD 2,668.00 million in 2024, and is anticipated to hit USD 4,261.21 million by 2032, with a CAGR of 6.08%.
- The top three regional shares are Asia Pacific (~34 %), North America (~26 %), and Europe (~23 %). Asia Pacific dominates due to rising disposable income and wellness adoption; North America leads with mature health-nutrient industries; Europe benefits from strong vegan and organic markets.
- The fastest-growing region is Asia Pacific, holding roughly 34 % share, backed by a large population base, growing e-commerce access, and increasing health-supplement penetration.
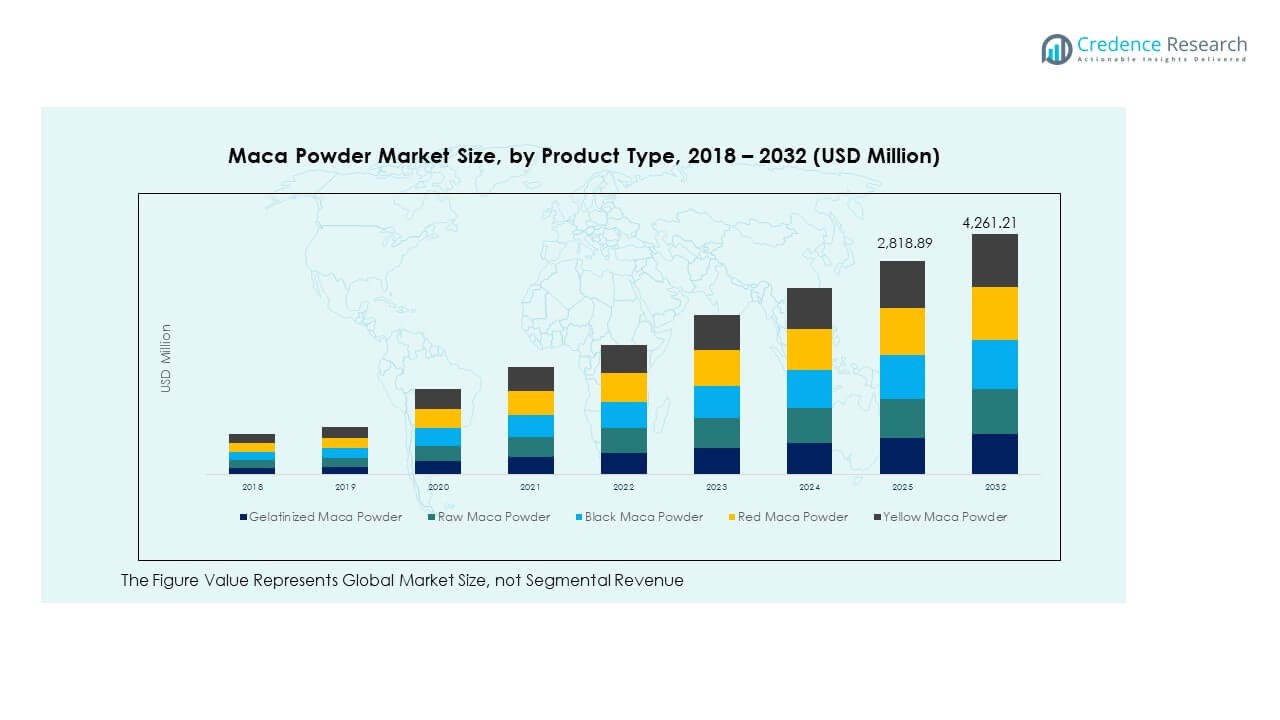
- In product-type segmentation, yellow maca powder accounts for around 60 % of the market share owing to its broader production and acceptance, while gelatinized and raw formats together capture a significant complementary portion.
- By distribution channel, online stores command the largest share due to convenience and global reach, followed by supermarkets/hypermarkets and specialty stores, which serve niche and premium consumers.
Market Drivers
Rising Global Focus on Plant-Based Nutrition and Functional Food Consumption
Growing consumer awareness of plant-based nutrition has accelerated the use of maca powder in dietary products. It is valued for its natural energy-boosting and adaptogenic properties that support hormonal balance and stamina. The increasing adoption of functional foods has encouraged manufacturers to include maca powder in supplements, smoothies, and snack formulations. Consumers seeking clean-label, chemical-free ingredients prefer maca powder due to its organic origin. The Maca Powder Market benefits from this shift toward preventive health and natural wellness solutions. Its versatility across food and pharmaceutical applications strengthens market demand. Expanding e-commerce platforms enable global access to premium maca-based products. Rising endorsements by nutrition experts further promote consistent market growth.
- For instance, Navitas Organics offers USDA-certified organic maca powder that undergoes third-party testing to ensure product quality and purity. The company emphasizes sustainable sourcing and nutrient retention to support consumer wellness and adaptogenic nutrition needs.
Expanding Applications Across Nutraceuticals, Sports Nutrition, and Cosmetics
Maca powder has become integral in nutraceuticals, sports supplements, and skincare products. Companies are utilizing it in protein blends and energy boosters due to its amino acid profile and bioactive compounds. Sports nutrition brands emphasize its role in muscle recovery and endurance. The Maca Powder Market gains momentum from cosmetic brands introducing maca-based formulations that support skin vitality and elasticity. Manufacturers are also expanding product ranges with flavored or encapsulated variants. Its compatibility with multiple product forms increases its demand across industries. Consumers prefer multi-benefit ingredients, and maca powder fits this growing trend. Continuous R&D enhances its bioavailability, boosting its global appeal.
Increasing Demand for Organic and Non-GMO Certified Products
Consumer preference for organic and non-GMO certified products has significantly influenced the maca powder segment. Retailers are responding by introducing certified organic maca products that meet international quality standards. The Maca Powder Market reflects a broader movement toward transparency in sourcing and labeling. Organic certification helps brands attract health-conscious consumers seeking pesticide-free and sustainably harvested ingredients. Government regulations promoting clean food practices reinforce this transition. Manufacturers invest in traceability systems to ensure product integrity. E-commerce channels highlight organic labeling, which drives higher purchase confidence. Demand continues to rise in developed and emerging economies alike.
Health Awareness and Inclusion in Functional Beverage and Food Innovation
Health-focused consumers are increasingly integrating maca powder into daily diets through beverages and functional foods. It supports hormonal health, energy balance, and fertility, making it popular among both men and women. Beverage producers use maca powder in protein shakes, teas, and flavored drinks targeting active lifestyles. The Maca Powder Market benefits from partnerships between superfood brands and food technology startups. Innovation in product formulation enables better taste and solubility without compromising nutritional content. Health-conscious demographics in urban centers drive consistent growth in retail and online segments. Rising clinical studies on maca’s bioactive potential further reinforce consumer trust.
- For instance, in February 2024, Four Sigmatic introduced its Organic Instant Teas line at Natural Products Expo West, featuring functional mushrooms and adaptogens designed to support focus, mood, and immunity. The launch reflected the company’s continued expansion in natural, wellness-focused beverages.
Market Trends
Growing Popularity of Superfood Blends and Nutrient-Enriched Formulations
Superfood blends combining maca with spirulina, matcha, or ashwagandha are becoming mainstream. Consumers seek holistic nutrition solutions that provide energy and mood enhancement in one serving. Brands leverage this interest by creating multipurpose powders for smoothies and breakfasts. The Maca Powder Market experiences strong traction from personalized nutrition and health-focused meal trends. Companies are developing ready-to-use blends to cater to busy lifestyles. These formulations align with the growing preference for convenience and natural performance boosters. Market players use advanced drying and micronization technologies to improve solubility and nutrient retention. This trend continues to shape the evolution of functional food innovation.
- For instance, The Maca Team offers “The Morning Motivator Blend,” a caffeine-free organic superfood using gelatinized maca, cacao, and mesquite. It also sells “Maca Blue,” a blend of tri-color gelatinized maca and blue spirulina positioned for energy and immune support. Both blends are proprietary and sold directly by The Maca Team.
Technological Advancements in Processing and Product Standardization
Technological improvements in drying and encapsulation enhance the purity and potency of maca powder. Advanced freeze-drying processes preserve nutrient content while extending shelf life. Manufacturers employ standardized extraction techniques to maintain consistent quality across batches. The Maca Powder Market benefits from precision technology that ensures uniformity in color, aroma, and nutrient levels. Automation reduces contamination risks and production costs. Producers adopt sustainable processing methods to minimize environmental impact. Technological integration also allows for custom blending for specific dietary needs. Such improvements strengthen consumer trust and open pathways for pharmaceutical-grade maca formulations.
Rising Influence of E-Commerce and Direct-to-Consumer Wellness Brands
E-commerce platforms have transformed maca powder distribution across global markets. Online retail channels allow smaller producers to reach niche health-conscious consumers. The Maca Powder Market sees increasing collaborations with direct-to-consumer wellness brands. Influencer-driven marketing and digital campaigns highlight maca’s benefits for vitality and mental clarity. Subscription models offering personalized superfood packages increase recurring sales. Online analytics help brands understand regional demand variations. Growing demand for sustainable packaging aligns with digital-first brand positioning. This digital integration ensures transparency, ease of access, and improved customer retention.
- For instance, Organifi offers USDA-certified organic superfood blends, including formulas containing maca powder to support energy and hormonal balance. The company focuses on direct-to-consumer online sales and subscription-based wellness packages to enhance customer retention and accessibility.
Expanding Role of Sustainable Farming and Ethical Sourcing Practices
Sustainable farming practices in Peru and the Andes are strengthening the maca supply chain. Ethical sourcing helps preserve local biodiversity and ensures fair compensation for farmers. The Maca Powder Market aligns closely with the global sustainability movement. Companies promote traceable supply chains to meet consumer expectations for authenticity. Investment in regenerative agriculture enhances soil fertility and yield consistency. Certification programs validate ethical production and environmental protection. Consumers associate such initiatives with product quality and social responsibility. Sustainable sourcing practices have become a core competitive differentiator for major players.
Market Challenges Analysis
Quality Inconsistencies and Supply Chain Vulnerabilities Due to Climatic and Processing Factors
The industry faces challenges in maintaining consistent quality due to varied soil and climatic conditions. Seasonal changes affect yield, altering the concentration of key nutrients in maca roots. Limited processing facilities in growing regions lead to inconsistent drying and powdering standards. The Maca Powder Market encounters issues with adulteration and mislabeling, which reduce consumer confidence. Supply disruptions caused by environmental stressors or labor shortages impact production timelines. Companies struggle to balance cost efficiency with stringent purity requirements. Ensuring traceability across decentralized farming systems remains complex. Addressing these gaps demands continuous monitoring and investment in standardized processing units.
Regulatory Barriers, Price Volatility, and Limited Consumer Awareness in Emerging Regions
Global trade regulations and varying import standards create hurdles for market expansion. Price fluctuations caused by harvest uncertainty and export costs challenge long-term profitability. The Maca Powder Market also contends with limited awareness in developing economies where superfoods are still niche. Misleading marketing claims lead to skepticism among new consumers. Regulatory compliance for labeling and organic certification adds operational costs for producers. Small manufacturers face entry barriers due to certification expenses and trade restrictions. Educational campaigns and collaborations with health experts can help improve acceptance. Addressing these barriers is vital for building a sustainable global presence.
Market Opportunities
Rising Demand for Functional Ingredients in Personalized Health and Wellness Products
Growing consumer interest in personalized health solutions has created strong opportunities for maca-based innovations. The Maca Powder Market benefits from rising adoption of customized nutrition plans and smart supplements. Producers can leverage AI-driven formulation platforms to tailor blends for individual needs. Functional beverages, fortified snacks, and holistic wellness products represent high-growth potential areas. Expansion into pharmaceutical-grade and clinical-use categories may further enhance profitability. Global consumers are favoring adaptogenic and mood-enhancing natural ingredients, strengthening maca’s future demand. Health-conscious millennials and aging populations drive parallel adoption curves worldwide.
Expansion Through Product Diversification and Strategic Brand Collaborations
Diversifying product portfolios through flavored, encapsulated, or instant maca formats attracts wider audiences. Collaborations with fitness brands, beauty labels, and online retailers increase visibility. The Maca Powder Market benefits from the growing convergence of nutrition and lifestyle branding. Innovative packaging and digital marketing reinforce premium positioning. Partnerships with local farmers ensure steady raw material supply and sustainable sourcing credibility. Companies investing in R&D can explore synergistic combinations with probiotics and botanical extracts. Such innovation-driven approaches open new avenues in global wellness markets.
Market Segmentation Analysis:
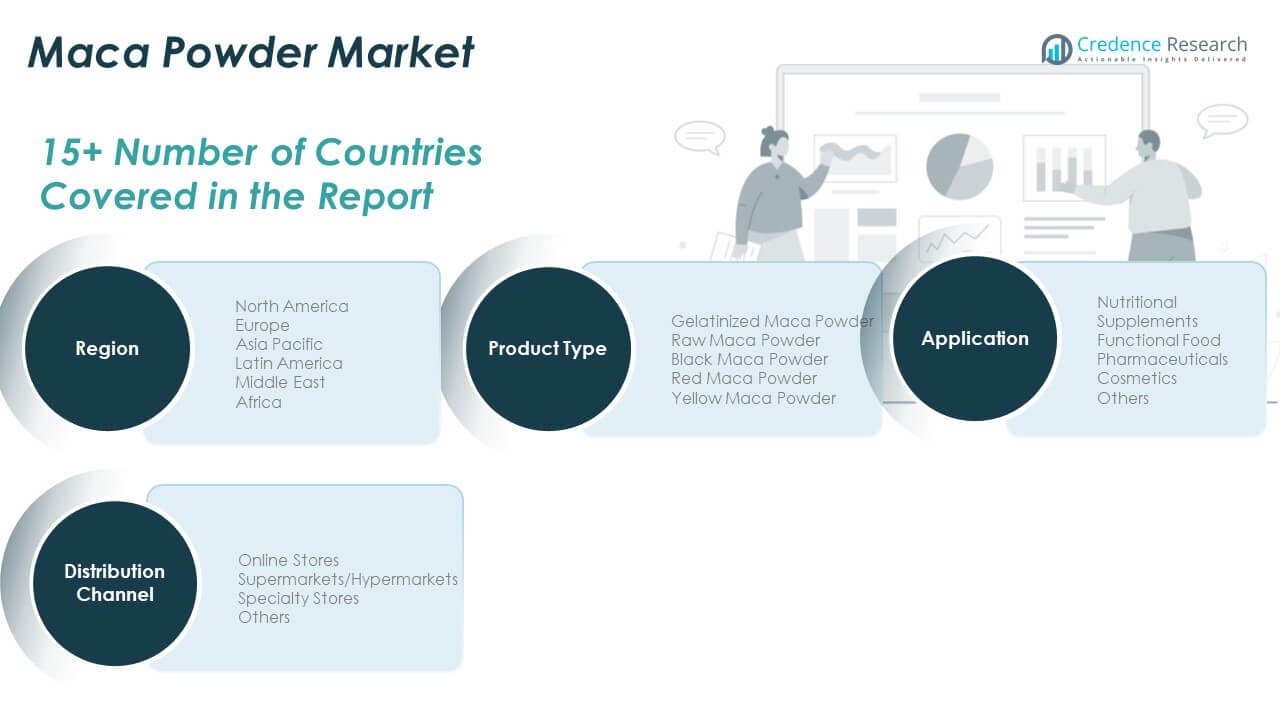
The Maca Powder Market is segmented by product type, application, and distribution channel.
By product type, gelatinized maca powder dominates due to its improved digestibility and higher solubility, making it suitable for supplements and food formulations. Raw maca powder follows, supported by its organic profile and unprocessed nutritional integrity. Black maca powder gains popularity for energy and stamina enhancement, while red maca is valued for hormonal and fertility benefits. Yellow maca remains the most commonly produced variant due to wide consumer acceptance and affordability.
- For instance, Sevenhills Wholefoods offers raw maca powder that is certified organic by the Soil Association and registered with the Vegan Society. The company highlights clear labeling on every pack to ensure transparency and product authenticity for health-conscious consumers.
By application, nutritional supplements lead due to high adoption in sports nutrition and wellness products. Functional foods form the second-largest segment, driven by increasing demand for plant-based and nutrient-dense ingredients. Pharmaceuticals and cosmetics also incorporate maca powder for its adaptogenic and antioxidant properties, while other applications include beverages and fortified snacks.
By distribution channel, online stores dominate due to the growing preference for digital health and wellness purchases. Supermarkets and hypermarkets maintain strong presence through diversified product availability and promotional access. Specialty stores cater to consumers seeking certified organic or premium-quality powders, while smaller outlets and local distributors continue to serve regional markets. This diverse segmentation structure supports sustained growth and wider consumer reach.
- For instance, Tesco PLC in the UK offers organic and gluten-free Peruvian maca powder within its health food range. The retailer lists these products under its wellness and superfood category, catering to consumers seeking natural and certified-quality nutrition options.
Segmentation:
By Product Type
- Gelatinized Maca Powder
- Raw Maca Powder
- Black Maca Powder
- Red Maca Powder
- Yellow Maca Powder
By Application
- Nutritional Supplements
- Functional Food
- Pharmaceuticals
- Cosmetics
- Others
By Distribution Channel
- Online Stores
- Supermarkets/Hypermarkets
- Specialty Stores
- Others
By Region
- North America
- Europe
- Germany
- France
- U.K.
- Italy
- Spain
- Rest of Europe
- Asia Pacific
- China
- Japan
- India
- South Korea
- South-east Asia
- Rest of Asia Pacific
- Latin America
- Brazil
- Argentina
- Rest of Latin America
- Middle East & Africa
- GCC Countries
- South Africa
- Rest of the Middle East and Africa
Regional Analysis:
North America
The North America Maca Powder Market size was valued at USD 587.40 million in 2018 to USD 700.60 million in 2024 and is anticipated to reach USD 1,116.87 million by 2032, at a CAGR of 6.1% during the forecast period. North America holds a 26% share of the global market, driven by high demand for plant-based and functional nutrition products. Consumers are increasingly adopting maca powder in dietary supplements and energy formulations. It benefits from the region’s established nutraceutical and wellness industries. Retailers focus on organic, non-GMO, and ethically sourced products to meet clean-label demand. Major manufacturers invest in advanced packaging and digital distribution to enhance shelf visibility. Rising interest in hormone balance and endurance-boosting supplements supports continued growth. Regulatory clarity and strong consumer awareness sustain its expansion across the United States and Canada.
Europe
The Europe Maca Powder Market size was valued at USD 534.60 million in 2018 to USD 621.04 million in 2024 and is anticipated to reach USD 932.15 million by 2032, at a CAGR of 5.3% during the forecast period. Europe accounts for a 23% share of the global market, supported by growing veganism and demand for sustainable nutrition. Health-conscious consumers prefer maca-based supplements for stress management and energy improvement. It gains traction in functional beverages and skincare formulations. Manufacturers focus on certified organic sourcing to align with EU health regulations. Germany, the UK, and France are major contributors due to advanced retail and e-commerce networks. Rising awareness about adaptogenic herbs has increased its use in personal wellness regimes. Partnerships between local distributors and South American producers strengthen supply reliability.
Asia Pacific
The Asia Pacific Maca Powder Market size was valued at USD 809.60 million in 2018 to USD 1,010.76 million in 2024 and is anticipated to reach USD 1,727.07 million by 2032, at a CAGR of 7.0% during the forecast period. Asia Pacific dominates with a 34% share of the market, fueled by increasing disposable incomes and a growing health-conscious population. It witnesses high product adoption in China, Japan, India, and Australia due to expanding dietary supplement sectors. Local brands highlight maca’s benefits for vitality and reproductive health. E-commerce platforms play a crucial role in distributing premium maca products. Rising investments in nutraceutical manufacturing facilities strengthen domestic production. Regional innovation in flavor and format diversification supports market penetration. Growing awareness among millennials about natural energy enhancers continues to elevate demand.
Latin America
The Latin America Maca Powder Market size was valued at USD 156.20 million in 2018 to USD 187.80 million in 2024 and is anticipated to reach USD 280.69 million by 2032, at a CAGR of 5.2% during the forecast period. Latin America contributes 9% of the total market share, largely driven by Peru’s production dominance. It benefits from being the native cultivation region of maca root, ensuring consistent raw material availability. Local producers focus on export-oriented growth strategies supported by fair-trade certifications. Increasing regional awareness about natural superfoods improves domestic consumption. Brazil and Mexico represent key emerging markets with expanding distribution networks. Government support for agricultural modernization enhances production efficiency. It continues to strengthen its global export footprint through quality assurance and sustainability programs.
Middle East
The Middle East Maca Powder Market size was valued at USD 69.30 million in 2018 to USD 77.62 million in 2024 and is anticipated to reach USD 109.11 million by 2032, at a CAGR of 4.4% during the forecast period. The region holds a 5% share of the market, with growth driven by rising interest in premium health supplements. Urban populations increasingly favor functional foods and adaptogenic ingredients. It experiences gradual adoption through specialty stores and online wellness retailers. Manufacturers focus on importing high-grade maca powder from Peru and Asia to meet regional standards. Consumer preference for natural energy enhancers supports product visibility in gyms and fitness centers. Expanding tourism and hospitality industries also boost superfood offerings in cafes and health bars. Gradual lifestyle shifts toward preventive health will likely support consistent growth.
Africa
The Africa Maca Powder Market size was valued at USD 42.90 million in 2018 to USD 70.18 million in 2024 and is anticipated to reach USD 95.32 million by 2032, at a CAGR of 3.5% during the forecast period. Africa accounts for a 3% market share, representing the smallest but steadily developing segment. It gains attention through rising urbanization and improving retail access to wellness products. South Africa leads consumption due to growing awareness of functional nutrition. Importers are introducing small-pack formats to reach price-sensitive consumers. The Maca Powder Market in this region faces distribution and affordability challenges but retains strong potential. Government health campaigns promoting nutrient-rich diets indirectly encourage demand. Investment in local superfood processing could accelerate future regional adoption. Gradual improvements in trade logistics will aid sustained market penetration.
Key Player Analysis:
- The Maca Team
- Navitas Organics
- Sunfood Superfoods
- Terrasoul Superfoods
- NOW Foods
- Gaia Herbs
- NutraChamps
- Maju Superfoods
- Anthony’s Goods
- Herbal Secrets
- Nature’s Way
- Viva Naturals
- Nutricost
- Healthworks
- Feel Good Organics
- Zint Nutrition
- Bulk Powders
- Natural Elements
- Peruvian Naturals
Competitive Analysis:
The Maca Powder Market is highly competitive, with companies focusing on innovation, quality, and sustainability to strengthen their market position. Key players such as The Maca Team, Navitas Organics, Sunfood Superfoods, Terrasoul Superfoods, and NOW Foods emphasize organic certification, clean-label formulations, and transparent sourcing. It benefits from strategic mergers, product launches, and regional expansion aimed at increasing distribution efficiency and brand visibility. Companies invest in advanced drying and processing technologies to maintain nutrient integrity and flavor consistency. Online platforms and private-label partnerships enhance customer reach and brand loyalty. Sustainability and ethical sourcing practices remain central to competitive differentiation across both developed and emerging markets.
Report Coverage:
The research report offers an in-depth analysis based on Product Type, Application and Distribution Channel. It details leading market players, providing an overview of their business, product offerings, investments, revenue streams, and key applications. Additionally, the report includes insights into the competitive environment, SWOT analysis, current market trends, as well as the primary drivers and constraints. Furthermore, it discusses various factors that have driven market expansion in recent years. The report also explores market dynamics, regulatory scenarios, and technological advancements that are shaping the industry. It assesses the impact of external factors and global economic changes on market growth. Lastly, it provides strategic recommendations for new entrants and established companies to navigate the complexities of the market.
Future Outlook:
- Growing global awareness of plant-based nutrition will strengthen the adoption of maca powder in daily diets.
- Increasing preference for clean-label and organic supplements will drive long-term product innovation.
- Technological improvements in drying and encapsulation will enhance product stability and shelf life.
- Expanding e-commerce penetration will boost consumer access to premium maca products globally.
- Rising popularity of adaptogens and functional foods will position maca powder as a core ingredient.
- Strategic partnerships with nutraceutical and cosmetic brands will expand cross-industry demand.
- Manufacturers focusing on traceable and sustainable sourcing will gain stronger market credibility.
- Emerging markets in Asia and Latin America will offer new opportunities for brand localization.
- Continued clinical studies on maca’s health benefits will improve consumer confidence and product validation.
- Product diversification into beverages, snacks, and wellness blends will sustain steady revenue growth.


