
| REPORT ATTRIBUTE | DETAILS |
|---|---|
| Historical Period | 2019-2022 |
| Base Year | 2023 |
| Forecast Period | 2024-2032 |
| Managed Travel Distribution Market Size 2024 | USD 91,015 million |
| Managed Travel Distribution Market, CAGR | 10.5% |
| Managed Travel Distribution Market Size 2032 | USD 202,307.13 million |
Market Overview:
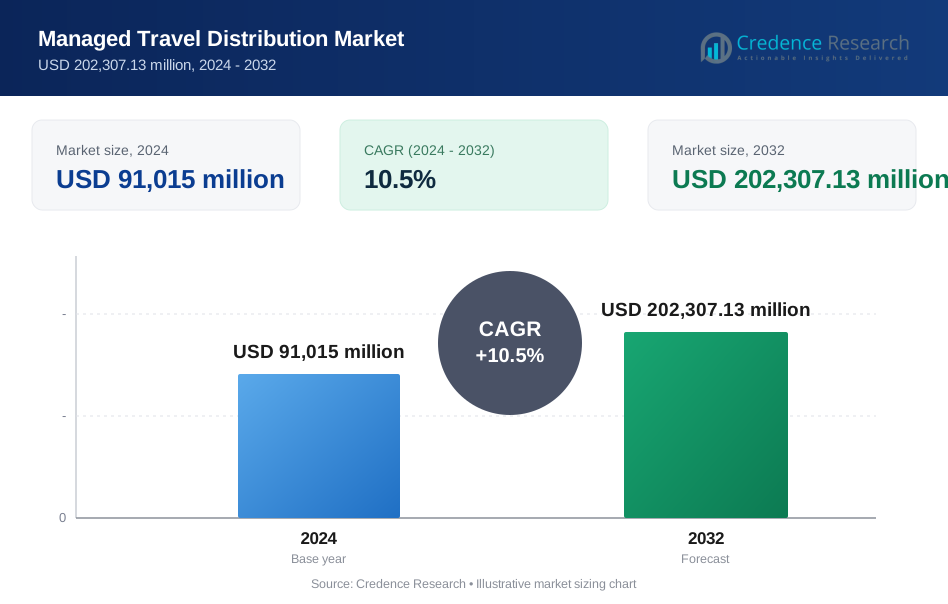
The managed travel distribution market is projected to grow from USD 91,015 million in 2024 to USD 202,307.13 million by 2032, at a compound annual growth rate (CAGR) of 10.5%.
The managed travel distribution market has been experiencing robust growth, fueled by increasing globalization and a surge in corporate travel. The growth is attributed to the rising adoption of advanced technologies and the demand for cost-efficient travel management solutions among organizations. The market is also benefiting from innovations in travel booking platforms and an increasing preference for personalized travel experiences.
Key drivers propelling the market include the need for streamlined travel management processes and real-time expense tracking. Businesses are increasingly relying on managed travel solutions to enhance operational efficiency, improve employee satisfaction, and maintain compliance with corporate travel policies. The integration of artificial intelligence (AI) and machine learning (ML) into travel distribution systems has further augmented market growth by enabling predictive analytics and personalized recommendations. Additionally, the growing emphasis on sustainability and carbon footprint reduction in travel programs has led to the adoption of eco-friendly travel options supported by managed travel systems.
Regionally, North America holds a significant share of the managed travel distribution market, driven by the presence of major corporations and advanced technology infrastructure. Europe follows closely, with demand rising due to stringent travel regulations and increasing adoption of managed travel services among medium-sized enterprises. The Asia-Pacific region is anticipated to witness the highest growth rate during the forecast period, propelled by rapid economic development, an expanding business landscape, and growing investments in travel technology solutions. Countries such as China, India, and Japan are at the forefront of this growth, fueled by a surge in corporate travel and digital transformation initiatives.
This dynamic market is set to evolve further, presenting opportunities for stakeholders to innovate and capture the growing demand for managed travel distribution services.
Market Drivers:
Increasing Corporate Travel and Globalization:
The surge in corporate travel, fueled by globalization and expanding business operations, is a primary driver of the managed travel distribution market. Organizations are increasingly conducting international business, which necessitates efficient travel management systems. Managed travel solutions provide businesses with the tools to streamline booking, optimize itineraries, and ensure compliance with corporate policies, making them indispensable for global enterprises. For instance, a report by the Global Business Travel Association (GBTA) indicated that corporate travel spending worldwide increased by 21% in 2023, reflecting the growing trend of globalization.
Advancements in Technology and Digitalization:
The integration of cutting-edge technologies such as artificial intelligence (AI), machine learning (ML), and blockchain has significantly transformed the managed travel distribution landscape. AI-driven analytics offer predictive insights, enabling businesses to forecast travel trends and tailor experiences to employee needs. Additionally, blockchain enhances transparency in transactions, ensuring secure and efficient travel payments. For instance, a study by McKinsey found that AI and ML can reduce travel management costs by up to 20% through predictive analytics and personalized travel experiences. These technological advancements not only improve operational efficiency but also enhance user experiences, driving widespread adoption.
Demand for Cost Optimization and Operational Efficiency:
Corporate travel accounts for a substantial portion of organizational expenses. Businesses are increasingly prioritizing cost optimization, which has led to the widespread adoption of managed travel solutions. These systems provide real-time expense tracking, policy compliance enforcement, and data-driven insights for budget management. For instance, according to a survey by Deloitte, companies that implemented managed travel solutions saw an average reduction of 15% in travel expenses. By automating processes, organizations can minimize administrative overheads, reduce errors, and focus on strategic goals, boosting overall operational efficiency.
Emphasis on Sustainability and Eco-Friendly Travel:
With growing concerns about environmental impact, sustainability has become a key focus for many organizations. Managed travel distribution systems are evolving to incorporate eco-friendly options, such as carbon tracking tools and recommendations for sustainable travel choices. These features align with corporate social responsibility goals and appeal to environmentally conscious businesses. For instance, a report by the World Travel & Tourism Council (WTTC) found that 79% of travel companies have implemented sustainability initiatives, underscoring the industry's commitment to eco-friendly practices. By promoting green travel options, companies not only contribute to sustainability but also enhance their reputation, further driving market demand.
Market Trends:
Increasing Adoption of AI and Automation:
The managed travel distribution market is witnessing a significant shift toward the adoption of artificial intelligence (AI) and automation technologies. These tools enable predictive analytics, personalized travel recommendations, and automated booking processes, streamlining travel management for organizations. Businesses leverage AI to analyze historical travel data, optimize itineraries, and enhance user experiences, improving efficiency and decision-making. For instance, according to a study by Accenture, companies implementing AI-driven travel management saw a 25% improvement in travel efficiency. Automation also reduces administrative burdens, allowing travel managers to focus on strategic objectives.
Integration of Sustainability Initiatives:
Sustainability has become a core focus in the travel distribution market. Organizations are prioritizing eco-friendly travel options to align with corporate social responsibility (CSR) goals and reduce their carbon footprint. Managed travel platforms increasingly incorporate carbon tracking tools, provide recommendations for greener alternatives, and partner with sustainable travel providers. For instance, a report by the Global Business Travel Association (GBTA) found that 67% of travel managers are incorporating sustainable practices into their travel programs. This trend not only supports environmental stewardship but also enhances brand reputation and appeals to environmentally conscious stakeholders.
Emergence of Advanced Travel Platforms:
The rise of innovative travel platforms is transforming the managed travel distribution landscape. These platforms integrate multiple service providers, offering a unified solution for booking, expense management, and compliance tracking. Features such as mobile accessibility, real-time updates, and seamless integration with corporate systems enhance convenience and user engagement. For instance, a survey by Skift found that 45% of businesses have adopted mobile travel management platforms to enhance employee experience. Additionally, platforms equipped with machine learning capabilities provide insights into cost-saving opportunities and policy compliance, driving greater adoption.
Focus on Employee-Centric Solutions:
The emphasis on employee well-being and satisfaction has led to a growing demand for personalized and flexible travel management solutions. Organizations are prioritizing platforms that offer customized itineraries, transparent pricing, and hassle-free support services. For instance, a study by Deloitte revealed that 55% of employees reported increased job satisfaction when their travel preferences were considered. By enhancing the travel experience for employees, businesses aim to improve productivity and foster a positive corporate culture, positioning employee satisfaction as a key trend shaping the market’s evolution.
Market Challenges Analysis:
Integration of Advanced Technologies:
The adoption of cutting-edge technologies such as artificial intelligence (AI) and blockchain presents opportunities but also challenges for the managed travel distribution market. Integrating these advanced systems with existing travel management platforms requires substantial investment in infrastructure, training, and upgrades. For smaller organizations with limited resources, these costs can pose a significant barrier to adoption.
Fragmented Travel Ecosystem:
The travel distribution market remains highly fragmented, with numerous providers, including airlines, hotels, and transportation services, operating on diverse platforms. This fragmentation hampers the seamless flow of information and complicates the consolidation of travel data. As a result, businesses often struggle to achieve real-time updates and end-to-end visibility across their travel programs, limiting the effectiveness of managed solutions.
Data Security and Privacy Concerns:
Managed travel systems handle sensitive personal and corporate information, making them prime targets for cyberattacks. Ensuring robust data protection measures while adhering to varying international privacy regulations, such as GDPR and CCPA, adds significant complexity. The increasing frequency of cybersecurity breaches heightens the need for strong security frameworks, which can be costly and time-intensive to implement.
Economic and Geopolitical Uncertainty:
Economic fluctuations and geopolitical events, such as pandemics, regional conflicts, and economic recessions, create uncertainty in the travel industry. These disruptions can lead to decreased travel demand and force businesses to scale back their travel programs. Rising travel costs and inflationary pressures further exacerbate budget constraints, potentially discouraging investment in managed travel solutions.
Market Segmentation Analysis:
By Type
The managed travel distribution market is segmented into service-oriented and software-based solutions. Service-oriented solutions dominate the market due to their ability to provide end-to-end travel management services, including itinerary planning and expense tracking. Software-based solutions are gaining traction as businesses increasingly adopt automation tools to enhance efficiency and control costs.
By Booking Channel
The market is categorized into online and offline booking channels. Online channels hold a significant share, driven by the growing adoption of digital platforms and mobile applications that simplify the booking process. Offline channels remain relevant, particularly for complex travel arrangements and personalized services preferred by traditional businesses.
By Tourist
The market serves both corporate and leisure tourists. Corporate travelers form the largest segment, as businesses invest in managed solutions to streamline travel processes and ensure policy compliance. However, leisure travel is witnessing growth, supported by flexible booking options and personalized itineraries offered through managed platforms.
By Tour Type
The market is segmented into group and individual tours. Group tours remain prominent among corporate clients seeking cost-effective travel arrangements for teams. Individual tours are gaining popularity as businesses prioritize employee flexibility and personalized travel experiences.
By Age Group
The market also categorizes travelers into age groups, including millennials, Gen X, and baby boomers. Millennials dominate, driven by their tech-savviness and preference for seamless digital solutions. Gen X and baby boomers contribute significantly, reflecting their growing reliance on managed travel services for professional and leisure purposes.
Segmentation:
By Type
- Service-Oriented
- Software-Based
By Booking Channel
- Online
- Offline
By Tourist
- Corporate
- Leisure
By Tour Type
- Group
- Individual
By Age Group
- Millennials
- Gen X
- Baby Boomers
By Region
- North America
- US
- Canada
- Mexico
- Europe
- Germany
- France
- UK.
- Italy
- Spain
- Rest of Europe
- Asia Pacific
- China
- Japan
- India
- South Korea
- South-east Asia
- Rest of Asia Pacific
- Latin America
- Brazil
- Argentina
- Rest of Latin America
- Middle East & Africa
- GCC Countries
- South Africa
- Rest of the Middle East and Africa
Regional Analysis:
North America
North America dominates the managed travel distribution market, holding approximately 35% of the global market share. The region benefits from a well-established corporate sector, advanced technological infrastructure, and a high level of adoption of travel management solutions. The United States is the key contributor, driven by the extensive business travel ecosystem and widespread use of automated tools for travel management. For instance, automated travel management tools account for 65% of corporate travel bookings in the U.S.
Europe
Europe accounts for nearly 30% of the global market share, positioning it as the second-largest market for managed travel distribution. The region's focus on cost optimization, policy compliance, and sustainability in travel management underpins its strong performance. Countries such as Germany, France, and the United Kingdom lead the market, with enterprises investing heavily in digital travel solutions to enhance operational efficiency. For instance, 45% of companies in Germany have adopted digital travel solutions.
Asia-Pacific
Asia-Pacific is the fastest-growing region, holding approximately 25% of the global market share. The region’s growth is fueled by rapid economic development, the expansion of multinational corporations, and the increasing use of digital platforms for travel booking and management. Key contributors include China, India, and Japan, where rising business travel expenditures and the proliferation of small and medium-sized enterprises are driving demand for managed travel solutions. For instance, business travel expenditures in China grew by 20% in 2022.
Latin America
Latin America currently holds about 5% of the global market share, reflecting its emerging status in the industry. Economic growth in countries such as Brazil and Mexico and increasing globalization are fostering adoption. While the market is still developing, businesses are beginning to recognize the benefits of streamlined travel management, paving the way for gradual growth. For instance, 15% of businesses in Brazil adopted managed travel solutions in 2022.
Middle East and Africa
The Middle East and Africa region represents 5% of the global market share. Adoption is growing, particularly in countries like the United Arab Emirates and South Africa, which are embracing digital travel solutions to enhance corporate travel management. Despite its smaller share, the region offers potential for growth, driven by increasing international business travel and investment in technological advancements. For instance, 10% of businesses in South Africa adopted digital travel management tools in 2022.
Key Player Analysis:
- Amadeus IT Group
- Travelport Worldwide Limited
- Sabre Corporation
- CWT (Carlson Wagonlit Travel)
- BCD Travel
- Expedia Group
- Booking Holdings (including brands like Booking.com and Priceline)
- American Express Global Business Travel (Amex GBT)
- Concur Technologies (SAP Concur)
- Egencia (a part of American Express GBT)
- Flight Centre Travel Group
- HRG (Hogg Robinson Group)
Competitive Analysis:
The managed travel distribution market is highly competitive, characterized by the presence of established global players and emerging regional providers. Key players such as Amadeus IT Group, Sabre Corporation, and Travelport Worldwide Limited dominate the technology segment, offering advanced platforms that streamline booking, expense management, and compliance tracking. For instance, a report by Technavio highlighted that Amadeus IT Group holds over 40% of the global market share in travel technology solutions. Corporate travel management giants like American Express Global Business Travel (Amex GBT), BCD Travel, and CWT lead in service-oriented solutions, leveraging extensive networks and tailored services to meet diverse client needs. These firms maintain a competitive edge through strategic partnerships and investments in AI-powered analytics and sustainability initiatives. Meanwhile, companies like Expedia Group and Booking Holdings drive competition by expanding into corporate travel with innovative digital platforms. Smaller players and regional firms compete by offering localized solutions and cost-effective services, targeting small and medium-sized enterprises.
Recent Developments:
- In February 2024, American Express Global Business Travel (Amex GBT) announced a strategic partnership with a leading sustainability consultancy to offer eco-friendly travel options and carbon offset programs.
- In April 2024, Expedia Group launched a new mobile app feature that allows corporate travelers to book and manage their travel directly from their smartphones, enhancing convenience and accessibility.
- In May 2024, Booking Holdings (including brands like Booking.com and Priceline) introduced a new analytics tool that provides detailed insights into travel spending patterns, helping businesses optimize their travel budgets.
- In September 2023, Travelport Worldwide Limited partnered with several airlines to offer dynamic pricing and real-time availability updates, improving the booking experience for corporate travelers.
Market Concentration & Characteristics:
The managed travel distribution market exhibits a moderate to high level of concentration, with a few dominant global players such as Amadeus IT Group, Travelport Worldwide Limited, and Sabre Corporation holding significant market shares due to their technological prowess and extensive networks. These leaders are complemented by prominent travel management companies like American Express Global Business Travel, BCD Travel, and CWT, which focus on service excellence and corporate partnerships. The market is characterized by rapid digital transformation, driven by the integration of advanced technologies such as artificial intelligence, blockchain, and predictive analytics. While large enterprises dominate the landscape, regional and niche players contribute to diversity by catering to localized needs and small to medium-sized enterprises (SMEs). Intense competition fosters innovation, resulting in enhanced features such as real-time data tracking, personalized itineraries, and eco-friendly travel solutions. Overall, the market remains dynamic, adapting to evolving corporate and traveler demands.
Report Coverage:
The research report offers an in-depth analysis based on By Type, Booking Channel, Tourist, Tour Type and Age Group. It details leading market players, providing an overview of their business, product offerings, investments, revenue streams, and key applications. Additionally, the report includes insights into the competitive environment, SWOT analysis, current market trends, as well as the primary drivers and constraints. Furthermore, it discusses various factors that have driven market expansion in recent years. The report also explores market dynamics, regulatory scenarios, and technological advancements that are shaping the industry. It assesses the impact of external factors and global economic changes on market growth. Lastly, it provides strategic recommendations for new entrants and established companies to navigate the complexities of the market.
Future Outlook:
- The managed travel distribution market is poised for significant growth, driven by increasing globalization and the rising demand for efficient corporate travel management solutions.
- Technological advancements such as artificial intelligence (AI), machine learning (ML), and blockchain will continue to shape the market, enabling greater automation, predictive analytics, and secure transactions.
- Sustainability will emerge as a critical focus, with businesses prioritizing eco-friendly travel options and integrating carbon tracking tools into their travel management systems.
- The growing emphasis on employee well-being will drive demand for personalized and flexible travel solutions that enhance user experiences and satisfaction.
- Asia-Pacific is expected to be the fastest-growing region, fueled by rapid economic development, increasing business travel expenditures, and digital transformation initiatives.
- Small and medium-sized enterprises (SMEs) will contribute to market growth as they increasingly adopt managed travel solutions to optimize costs and streamline operations.
- Partnerships and mergers among travel management companies and technology providers will intensify, creating integrated platforms that cater to diverse business needs.
- Mobile-based solutions will gain prominence, offering on-the-go accessibility and real-time updates to enhance convenience and responsiveness.
- Advanced data analytics and reporting tools will play a crucial role in helping businesses optimize travel policies, control expenses, and ensure compliance.
- The market will see heightened competition among key players, spurring innovation and the development of user-centric solutions to address evolving corporate and traveler demands.
Request a Free Sample
Fill in your details and we'll send you a free sample report.
- Sample data tables & charts
- Research methodology
Need a Custom Version of This Report?
Tailor the scope, geography, or segments to your exact requirements.
- Custom geography or segment scope
- Direct access to our analyst team
Frequently Asked Questions
What is the current size of the Managed Travel Distribution Market?
What factors are driving the growth of the Managed Travel Distribution Market?
What are the key segments within the Managed Travel Distribution Market?
What are some challenges faced by the Managed Travel Distribution Market?
Table of Content
Chapter 1. Report Introduction
- 1.1 Report Description & Purpose
- 1.1.1 Report Title & Market Definition
- 1.1.2 Unique Selling Propositions (USP) & Key Differentiators
- 1.1.3 Value Proposition for Stakeholders
- 1.2 Research Objectives
- 1.2.1 Market Sizing Objectives (Volume & Revenue) (Volume Where Applicable)
- 1.2.2 Segmentation Objectives
- 1.2.3 Competitive Intelligence Objectives
- 1.2.4 Forecast & Scenario Objectives
- 1.3 Report Scope
- 1.3.1 Managed Travel Distribution Scope – Segments & Subsegments Covered
- 1.3.2 Geographic Scope – Regions & Countries Covered
- 1.3.3 Historical Period, Base Year & Forecast Period (2024; forecast to 2032)
- 1.3.4 Inclusions & Exclusions
- 1.4 Industry Classification & Applicable Codes
- 1.5 Currency, Measurement Units & Valuation Basis
- 1.6 Target Stakeholders
- 1.7 Limitations & Assumptions
Chapter 2. Executive Summary
- 2.1 Global Managed Travel Distribution Market Snapshot
- 2.1.1 Market Size – Historical (2024) & Forecast (2024-2032) (2024: USD 91,015 million → 2032: USD 202,307.13 million)
- 2.1.2 Volume & Revenue – Global Totals (Volume Where Applicable)
- 2.1.3 Key Market Highlights – Top Five Facts
- 2.2 Managed Travel Distribution Market Segmentation Snapshot
- 2.2.1 Market Split by Region – 2024 vs. 2032
- 2.3 Competitive Snapshot
- 2.3.1 Top 10 Players by Revenue Share – 2024
- 2.3.2 Top 10 Players by Volume Share – 2024 (Volume Where Applicable)
- 2.3.3 Recent Strategic Developments (18-Month Summary)
- 2.4 Key Investment Highlights & Strategic Conclusions
Chapter 3. Managed Travel Distribution Market Dynamics & Industry Analysis
- 3.1 Market Overview & Context
- 3.1.1 Managed Travel Distribution Market Position in the Broader Industry Value Chain
- 3.1.2 Demand Structure & Purchasing Dynamics
- 3.1.3 Market Maturity & Development Stage by Region
- 3.2 Managed Travel Distribution Market Drivers
- 3.3 Managed Travel Distribution Market Restraints & Challenges
- 3.4 Managed Travel Distribution Market Opportunities
- 3.5 Porter's Five Forces Analysis
- 3.5.1 Threat of New Entrants
- 3.5.2 Bargaining Power of Suppliers
- 3.5.3 Bargaining Power of Buyers
- 3.5.4 Threat of Substitutes
- 3.5.5 Competitive Rivalry – Intensity Assessment
- 3.6 Managed Travel Distribution Value Chain Analysis
- 3.6.1 Upstream – Key Inputs, Resources & Suppliers
- 3.6.1.1 Key Input/Resource 1
- 3.6.1.2 Key Input/Resource 2
- 3.6.1.3 Key Input/Resource 3
- 3.6.2 Midstream – Core Operations & Value Creation
- 3.6.2.1 Operating Model & Process Overview
- 3.6.2.2 Key Operating Locations & Capabilities by Company
- 3.6.3 Downstream – Market Channels & End Users
- 3.6.3.1 Direct Sales & Customer Engagement Channels
- 3.6.3.2 Indirect Sales, Intermediaries & Partner Channels
- 3.6.4 Value Chain Profitability Analysis
- 3.6.1 Upstream – Key Inputs, Resources & Suppliers
- 3.7 PESTEL Analysis
- 3.7.1 Political Factors
- 3.7.2 Economic Factors
- 3.7.3 Social Factors
- 3.7.4 Technological Factors
- 3.7.5 Environmental Factors
- 3.7.6 Legal Factors
- 3.8 Managed Travel Distribution Supply Chain Analysis
- 3.8.1 Critical Input & Resource Availability Risk Assessment
- 3.8.2 Supplier & Operational Concentration Risk (Geographic Exposure)
- 3.8.3 Supply & Service Disruption Impact Analysis
- 3.9 Regulatory & Policy Landscape
Note: The regulatory and policy landscape section covers regulations based on their applicability to the market, Managed Travel Distribution category, geography, and scope of the study. Only regulatory frameworks with a material impact on operations, compliance, trade, sustainability, or market access are analyzed in detail.
Chapter 4. Key Investment Pockets & Opportunity Analysis
- 4.1 Managed Travel Distribution Market Attractiveness Analysis
- 4.1.1 By Region – Investment Attractiveness Matrix (Market Size × CAGR)
- 4.2 Absolute Revenue Growth Opportunity
- 4.2.1 By Region – Absolute Revenue Growth Through 2032
- 4.3 Incremental Demand Opportunity
- 4.3.1 By Region – Incremental Demand Through 2032
- 4.3.2 Segment – Incremental Demand
- 4.4 Emerging Submarket Opportunity Deep Dive (Subject to Applicability)
- 4.5 Priority Market Opportunity Scorecards
- 4.5.1 United States
- 4.5.2 Europe
- 4.5.3 Asia
- 4.5.4 Middle East & Africa
Note: Priority market opportunity scorecards reflect the geographic scope and strategic relevance of the study. Listed markets are indicative and may be adapted to the industry.
Chapter 5. Managed Travel Distribution Cross-Border Trade & Market Access Analysis
- 5.1 International Trade & Cross-Border Activity Overview
- 5.1.1 Global Export Value by Country (2024)
- 5.1.2 Global Export Volume by Country (2024) (Volume Where Applicable)
- 5.1.3 Global Import Value by Country (2024)
- 5.1.4 Global Import Volume by Country (2024) (Volume Where Applicable)
- 5.1.5 Net Trade Balance by Country (2024)
- 5.2 Export Analysis – Segment
- 5.2.1 Category 1 (Applicable Classification Code)
- 5.2.2 Category 2 (Applicable Classification Code)
- 5.2.3 Category 3 (Applicable Classification Code)
- 5.2.4 Category 4 (Applicable Classification Code)
- 5.2.5 Category 5 (Applicable Classification Code)
- 5.3 Import Analysis – Segment
- 5.3.1 Category 1 (Applicable Classification Code)
- 5.3.2 Category 2 (Applicable Classification Code)
- 5.3.3 Category 3 (Applicable Classification Code)
- 5.3.4 Category 4 (Applicable Classification Code)
- 5.3.5 Category 5 (Applicable Classification Code)
- 5.4 Cross-Border Pricing & Transaction Benchmarks
- 5.4.1 Export Pricing – Segment & Country
- 5.4.2 Import Pricing – Segment & Source Country
- 5.4.3 Price Trends (2024)
- 5.5 Key Cross-Border Trade & Delivery Routes
- 5.5.1 Cross-Border Trade/Delivery Route 1
- 5.5.2 Cross-Border Trade/Delivery Route 2
- 5.5.3 Cross-Border Trade/Delivery Route 3
- 5.5.4 Cross-Border Trade/Delivery Route 4
- 5.5.5 Cross-Border Trade/Delivery Route 5
- 5.6 Trade Policy & Market Access Impact Assessment
- 5.6.1 Tariff & Non-Tariff Barriers
- 5.6.2 Regional Trade & Economic Integration Frameworks
- 5.6.3 Bilateral & Multilateral Trade Agreements
- 5.6.4 Cross-Border Operating, Licensing & Localization Requirements
Note: This chapter applies where cross-border trade or delivery is relevant to Managed Travel Distribution. Goods, services, and digital offerings are assessed using applicable classifications and transaction measures. Import-export volumes, trade balances, and route analyses are included only where meaningful to the market.
Chapter 6. Competitive Landscape & Company Benchmarking
- 6.1 Managed Travel Distribution Market Concentration & Structure
- 6.1.1 Herfindahl-Hirschman Index (HHI) – vs. 2024
- 6.1.2 Leading, Mid-Sized & Emerging Player Structure
- 6.1.3 Global, Regional & Local Player Dynamics
- 6.2 Managed Travel Distribution Market Share Analysis – 2024
- 6.2.1 Global Revenue Share by Company
- 6.2.2 Global Volume Share by Company (Volume Where Applicable)
- 6.2.3 Regional Revenue Share
- 6.2.4 Market Share Evolution ( vs. 2024)
- 6.2.5 Company Market Share by Key Segment
- 6.2.6 Company Market Share by Customer Group
- 6.3 Operating Scale, Capacity & Infrastructure Analysis
- 6.3.1 Global Operating Scale & Supply Capacity
- 6.3.2 Resource Utilization & Operating Efficiency
- 6.3.3 Output, Service Delivery & Activity Metrics
- 6.3.4 Operating Footprint & Infrastructure Map
- 6.3.5 Planned Operational & Capacity Expansion
- 6.4 Managed Travel Distribution Competitive Benchmarking Matrix
- 6.4.1 Revenue, Growth, Profitability & Operating Metric Comparison
- 6.4.2 Channel Revenue Mix
- 6.4.3 Geographic Revenue Exposure
- 6.4.4 R&D Intensity
- 6.4.5 Sustainability Maturity
- 6.5 Strategic Developments in Managed Travel Distribution (Last 24 Months)
- 6.5.1 Mergers, Acquisitions & Divestments
- 6.5.2 New Products, Services & Solutions in Managed Travel Distribution
- 6.5.3 Operational & Infrastructure Expansions
- 6.5.4 Strategic Alliances, Joint Ventures & Partnerships
- 6.5.5 Distribution Expansion & Market Entry
- 6.5.6 Sustainability & ESG Initiatives
- 6.6 Competitive Strategy Mapping
- 6.6.1 Leader, Challenger, Follower & Niche Classification
- 6.6.2 Pricing Strategy Comparison
- 6.6.3 Channel Strategy Matrix
Note: Strategic developments are included based on their materiality and the availability of reliable information.
Chapter 7. Global Managed Travel Distribution Market – By Sales & Delivery Channel
- 7.1 Segment Overview
- 7.1.1 Volume & Revenue Split by Channel (2024 & 2032) (Volume Where Applicable)
- 7.1.2 Channel Mix Evolution (2024-2032)
Chapter 8. Regional Market Analysis – Global Overview
- 8.1 Global Regional Overview
- 8.1.1 Regional Volume Share (Volume Where Applicable)
- 8.1.2 Regional Revenue Share
- 8.1.3 Regional Volume by Region (Volume Where Applicable)
- 8.1.4 Regional Revenue by Region
- 8.1.5 Regional Forecast Through 2032
- 8.2 Cross-Regional Segment Analysis
- 8.2.1 By Sales & Delivery Channel
- 8.2.2 By Competitive Positioning & Price Tier
Chapter 9. North America Managed Travel Distribution Market
- 9.1 United States
- 9.2 Canada
- 9.3 Mexico
Chapter 10. Europe Managed Travel Distribution Market
- 10.1 Germany
- 10.2 France
- 10.3 Italy
- 10.4 United Kingdom
- 10.5 Spain
- 10.6 Poland
- 10.7 Russia
- 10.8 Netherlands
- 10.9 Belgium
- 10.10 Sweden
- 10.11 Denmark
- 10.12 Norway
- 10.13 Rest of Europe
Chapter 11. Asia Pacific Managed Travel Distribution Market
- 11.1 China
- 11.2 India
- 11.3 Japan
- 11.4 South Korea
- 11.5 Thailand
- 11.6 Indonesia
- 11.7 Vietnam
- 11.8 Malaysia
- 11.9 Australia
- 11.10 Rest of Asia Pacific
Chapter 12. Latin America Managed Travel Distribution Market
- 12.1 Brazil
- 12.2 Argentina
- 12.3 Colombia
- 12.4 Chile
- 12.5 Rest of Latin America
Chapter 13. Middle East Managed Travel Distribution Market
- 13.1 Saudi Arabia
- 13.2 United Arab Emirates
- 13.3 Turkey
- 13.4 Israel
- 13.5 Iran
- 13.6 Rest of the Middle East
Chapter 14. Africa Managed Travel Distribution Market
- 14.1 South Africa
- 14.2 Egypt
- 14.3 Nigeria
- 14.4 Morocco
- 14.5 Rest of Africa
Chapter 15. Managed Travel Distribution Company Profiles
- 15.1 [Company 01]
- 15.1.1 Company Overview
- 15.1.2 Key Management Personnel
- 15.1.3 Products & Services Portfolio
- 15.1.4 Financial Performance
- 15.1.5 Key Market Focus & Geographic Presence
- 15.1.6 Recent Developments & Strategic Initiatives
Note: The company profile list is preliminary and may change based on research findings, market developments, data availability, and client requirements.
Chapter 16. Appendices
- Appendix A – List of Abbreviations & Acronyms
- Appendix B – Industry Classification Code Reference – Full Series
- Appendix C – Supply, Output & Operating Capacity Data Tables
- Appendix D – End-Use & Demand Base Tables
- Appendix E – Demand, Adoption & Usage Assumptions
- Appendix F – Pricing & Revenue Metric Reference Tables
- Appendix G – Company Operations & Infrastructure Database
- Appendix H – Cross-Border Trade & Activity Data Tables (Where Applicable)
- Appendix I – Regulatory Summary Tables
- Appendix J – Primary Research Participant List (Anonymized)
- Appendix K – Primary Research Questionnaire Framework
- Appendix L – Data Sources & Bibliography
- Appendix M – Market Size Divergence & Source Comparison
Chapter 17. Research Methodology
- 17.1 Research Framework & Philosophy
- 17.2 Secondary Research – Sources, Hierarchy & Data Extraction
- 17.3 Data Modeling – Bottom-Up & Top-Down Market Sizing
- 17.4 Primary Research – Stakeholder Framework, LOI & Sample Sizes
- 17.5 Forecast Methodology – Regression, Scenario & Sensitivity Analysis
- 17.6 Quality Control – Four-Layer Validation Framework
- 17.7 Limitations & Standard Assumptions
- 17.8 Disclaimer
