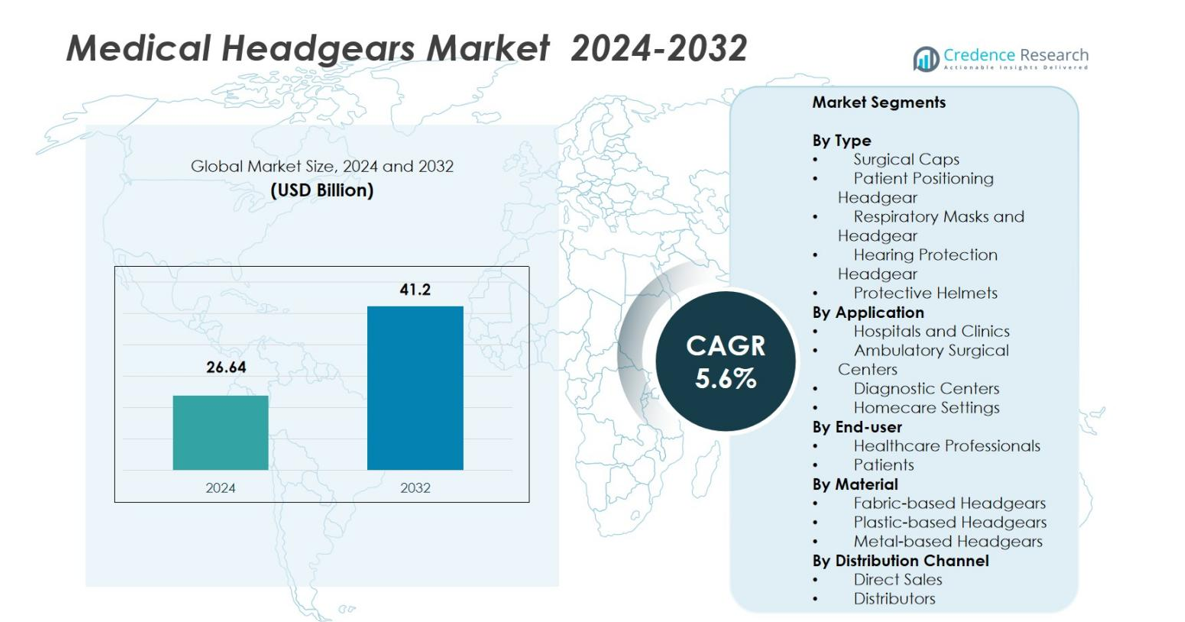
Home » Healthcare » Medical Headgears Market

Medical Headgears Market By Type (Surgical Caps, Patient Positioning Headgear, Respiratory Masks and Headgear, Hearing Protection Headgear, Protective Helmets); By Application (Hospitals and Clinics, Ambulatory Surgical Centers, Diagnostic Centers, Homecare Settings); By End-User (Healthcare Professionals, Patients); By Material (Fabric-based Headgears, Plastic-based Headgears, Metal-based Headgears); By Distribution Channel (Direct Sales, Distributors) – Industry Analysis, Size, Share, Growth, Trends, and Forecast, 2024 – 2032

Price: $4999

Published: | Report ID: 8826 | Report Format : PDF

The Medical Headgears Market is poised for substantial growth, with a market value of USD 1,247.86 million in 2024 projected to surge to USD 2,184.62 million by 2032, representing a robust compound annual growth rate (CAGR) of 6.36%. This remarkable expansion is indicative of the increasing demand for medical headgears, driven by factors such as advancements in healthcare technology, rising awareness of the importance of head protection, and a growing aging population.

Key Highlights of the report

How are the major segments performing in the Medical Headgears Market?

  • The LED segment held a significant global medical headgear market revenue share in 2022 due to its superior durability and strength. It also facilitates the duration of emergency time in the operating room and other locations.
  • The hospital end-user segment accounted for a sizeable portion of the global market in 2022 owing to the large number of operations performed in hospitals, where these systems are necessary for doctors.

Which region dominated the medical headgear market?

North America region held the top spot in the global medical headgear market in 2022 due to increased product launches and approvals, an influx of significant regional players, and a well-established healthcare system. The increase in orthopedic surgeries and growing safety concerns among medical professionals are two major factors propelling the growth of the medical headgear market in the region. Moreover, the strong presence of companies like Stryker, Cardinal Health, and 3M, as well as their innovative product launches, are expected to positively impact regional medical headgear market demand over the forecast period.

Design Element 2

Access crucial information at unmatched prices!

Request your free sample report today & start making informed decisions powered by Credence Research!

Download Free Sample
CTA Design Element 3

How is US Market Performing in the medical headgears market?

North America now dominates the medical headgear market, with the United States accounting for the largest revenue share. The region’s dominance is primarily due to adequate and favorable reimbursement policies, a well-developed healthcare infrastructure, widespread adoption of cutting-edge medical technologies, and key regional players. This is further enhanced by the rising incidence and frequency of long-term conditions in the country and the rising number of patients receiving diagnosis and treatment there. The increased use of medical headgear by healthcare professionals employed in ambulatory surgical centers, hospitals, and academic & research institutions is one of the key factors influencing demand in the US market.

How is the economy impacting global medical headgear growth?

The medical device sector is particularly diverse and overlapping with other sectors of health care and manufacturing, as it encompasses a wide range of devices and equipment intended for patient diagnosis and treatment, surgical intervention, therapy, and monitoring. Treating patients with these diseases and the increasing prevalence of chronic illnesses are placing enormous strain on the healthcare systems worldwide. As a result, the cost of treating these diseases has increased significantly globally. The expenditures of treating a patient in an inpatient and outpatient setting are substantially higher, and longer hospitalizations carry a higher economic burden.

What is the competitive environment of the medical headgear market?

Major players in the global medical headgear market are concentrating on innovation and product customization through robust research and development activities to maintain and boost their market presence both regionally and globally. Key players in the medical headgear industry commonly employ investment and agreement strategies. For example, in February 2022, Medline announced that it would expand its prime vendor agreements to include more than 230 additional healthcare organizations and systems, resulting in an annual increase in sales of medical solutions and supplies totaling almost USD 2 billion across the continuum of care.

Executive Summary

What are the key trends or recent developments in the Medical Headgears Market?

  • Growing need for the comfort of surgeons: The increasing demand for surgeon comfort during medical interventions necessitates the development of comfortable surgical headgear. Several factors influence the design of surgical helmet systems to maximize surgeon comfort. These include ergonomic considerations, the use of durable materials, and the production of lightweight medical headgear.

What are all the technical developments in the Medical Headgears Market?

Key players in the medical headgear market are focusing on increasing their market presence through new design changes and technological advancements. For instance, THI has a surgical helmet system patented under ViVi that has been modified to include two fan systems to filter out waste air and guarantee proper ventilation during operations. Modifications to medical headgear are based on factors like ergonomics, product durability, whether the product is reusable or disposable, and the use of lightweight materials in the manufacturing process.

Which are the key investments by the medical headgear market players?

The rising number of inpatient admissions and the increasing number of surgical and diagnostic procedures drive demand for medical devices and headgear, including capital equipment and consumables, in both developed and emerging markets. Increased R&D investments from market leaders augment this to develop technologically advanced devices to meet the growing demand for innovative equipment. For instance, Stryker increased its estimated R&D investment to USD 1.23 billion in 2021 from USD 0.98 billion in 2020. Medtronic, another significant producer of medical devices, reported investing 2.49 billion USD in research & development activities in 2021 compared to 2.33 billion USD in 2020.

Some major players in the medical headgear market are Zimmer Biomet, Stryker, Ecolab, THI Total Healthcare Innovation GmbH, Kaiser Technology Co. Ltd, and Beijing Zhongke Shengkang Technology Co. Ltd.

What are the Major Driving Factors for the Medical Headgears Market?

Increasing Prevalence of Chronic Diseases and Surgical Procedures

The rise in chronic diseases and the corresponding need for surgical interventions are major factors driving the demand for medical headgears. As the global population ages and lifestyle-related health issues become more prevalent, there is a heightened need for medical procedures that necessitate the use of medical headgears. These headgears are essential for ensuring the safety and efficiency of healthcare professionals during surgeries and other medical procedures. The increasing number of surgeries being performed worldwide is a direct reflection of this trend, underscoring the growing reliance on medical headgear to maintain sterile environments and protect both patients and healthcare workers.

Continuous Advancements in Medical Technology

The medical headgears market is also benefiting from continuous technological advancements. Innovations in medical technology have led to the development of more sophisticated, comfortable, and effective headgear. These advancements not only improve the functionality and efficiency of medical headgears but also enhance user comfort, which is critical in high-stress medical environments. Improved materials, better design for ergonomic fit, and integration with other medical devices are some of the technological enhancements that are pushing the boundaries of what medical headgears can achieve. As technology continues to evolve, the medical headgears market is set to expand further, driven by the ongoing quest for better, more efficient medical solutions.

What are the Major Risks for the Medical Headgears Market?

The unavailability and lack of awareness of these products in underdeveloped nations constrain market expansion. The growth of the medical headgear market is anticipated to be constrained by its high price and a few potential risks.

Which is the key end-user in the medical headgear market?

The hospital segment dominated the medical headgear market share in 2022 due to the rising number of community and multispecialty hospitals, particularly in developing nations. Thus, these factors, as well as the increasing focus of advanced healthcare agencies and the government on routine diagnosis and timely treatment of patients, have raised awareness among the general population, propelling global market demand over the projection period. Surgical helmet systems are most commonly used in hospitals around the world. This results from an increase in hospitals and a rise in government spending on building healthcare infrastructure. Surgical headgear is essential to hospital hygiene and infection prevention during surgeries.

How is the medical headgear market performing in regions?

The European regional market is anticipated to grow faster in the global medical headgear market in the forecast period, owing to rising healthcare expenditure, well-established infrastructural facilities, and increased adoption of advanced diagnostic and surgical devices. The development of the medical headgear market is anticipated to be fueled by a strong focus on a shift in medical care toward home care settings and the emergence of portable surgical supplies by top domestic and international players in the region. The leading regional market players concentrate on tactics like partnerships, product launches, new product development, and acquisitions to enhance their market positions.

What is the regulatory landscape for the medical headgear market?

There are considerable and specific sections of the medical headgear market, with key players and governmental agencies playing an important role in developing regulations and standards. Increased investment in research and development by medical technology companies and favorable scenarios presented by regulatory agencies for approval are expected to expand the medical devices industry during the forecast period. For instance, 213 devices received breakthrough designations from the U.S. FDA’s Center for Devices & Radiological Health in 2021, compared to about 130 in 2019.

What is the Market Size of Medical Headgear regarding value?

The Medical Headgears Market is poised for substantial growth, with a market value of USD 1,247.86 million in 2024 projected to surge to USD 2,184.62 million by 2032, representing a robust compound annual growth rate (CAGR) of 6.36%.

Shape Your Report to Specific Countries or Regions & Enjoy 30% Off!

What are the major players planning for the future of the medical headgear market?

Medical helmets are also frequently used as protective helmets to shield patients who suffer from epilepsy or seizures from unexpected drops or falls that could result in a head injury. Hard-shell and soft-shell medical helmets are widely available across the globe. Technological advancements in orthotic and prosthetics services, such as customized molded helmets made with computerized 3D scanning technology, are expected to drive the medical headgear market over the upcoming years. Leading manufacturers in the industry have entered emerging countries to fuel brand growth, capitalize on the largely untapped potential, and leverage the opportunity to strengthen their position in the medical headgear market.

Segmentation of Global Medical Headgears Market-

By Type

  • Surgical Caps
  • Patient Positioning Headgear
  • Respiratory Masks and Headgear
  • Hearing Protection Headgear
  • Protective Helmets

By Application

  • Hospitals and Clinics
  • Ambulatory Surgical Centers
  • Diagnostic Centers
  • Homecare Settings

By End-user

  • Healthcare Professionals
  • Patients

By Material

  • Fabric-based Headgears
  • Plastic-based Headgears
  • Metal-based Headgears

By Distribution Channel

  • Direct Sales
  • Distributors

Global Medical Headgears Market – By Region

  • North America
    • US.
    • Canada
  • Europe
    • Germany
    • France
    • UK.
    • Italy
    • Spain
    • Rest of Europe
  • Asia Pacific
    • China
    • Japan
    • India
    • South Korea
    • South-east Asia
    • Rest of Asia Pacific
  • Latin America
    • Brazil
    • Mexico
    • Rest of Latin America
  • Middle East & Africa
    • GCC Countries
    • South Africa
    • Rest of the Middle East and Africa
REPORT ATTRIBUTE DETAILS
Medical Headgears Market by Volume Yes
Market by Value Yes
Market, Tornado Analysis Yes
Market, STAR Analysis Yes
Market, SRC Analysis Yes
Market, Import-Export Data Yes (On Demand)
Market Pricing Analysis Yes (On Demand)
Market Segment Analysis By Type

  • Surgical Caps
  • Patient Positioning Headgear
  • Respiratory Masks and Headgear
  • Hearing Protection Headgear
  • Protective Helmets

By Application

  • Hospitals and Clinics
  • Ambulatory Surgical Centers
  • Diagnostic Centers
  • Homecare Settings

By End-user

  • Healthcare Professionals
  • Patients

By Material

  • Fabric-based Headgears
  • Plastic-based Headgears
  • Metal-based Headgears

By Distribution Channel

  • Direct Sales
  • Distributors
Market, Regional Analysis North America (US and Canada)

Europe (Germany, UK, France, Italy, Spain, and the Rest of Europe)

Asia Pacific (China, India, Japan, South Korea, South East Asia, and the Rest of Asia Pacific)

Latin America (Brazil, Mexico, and the Rest of Latin America)

Middle East and Africa (GCC Countries, South Africa, and the Rest of the Middle East and Africa)

Market Key Companies Zimmer Biomet, Stryker, Ecolab, THI Total Healthcare Innovation GmbH, Kaiser Technology Co. Ltd, and Beijing Zhongke Shengkang Technology Co. Ltd
Market Competitive Landscape Market Share Analysis

Competitive Benchmarking

Key Players Market Positioning

Geographical Presence Analysis

Major Strategies Adopted

Table of Content

Chapter No. 1 :……….. Introduction.. 77

1.1.       Report Description. 77

1.1.1.     Purpose of the Report. 77

1.1.2.     USP & Key Offerings. 77

1.2.       Key Benefits for Stakeholders. 77

1.3.       Target Audience. 78

1.4.       Report Scope   79

Chapter No. 2 :……….. Executive Summary. 81

2.1.       Medical Headgears Market Snapshot. 81

2.2.       Global Medical Headgears Market, 2018 – 2032 (Mn Units) (USD Million). 83

Chapter No. 3 :……….. Geopolitical Crisis Impact Analysis. 84

3.1.       Russia-Ukraine and Israel-Palestine War Impacts. 84

3.1.1.     Increased Healthcare Spending. 84

3.1.2.     Supply chain disruptions. 84

3.1.3.     Humanitarian Aid and Assistance. 84

3.1.4.     Geopolitical Uncertainty. 84

3.1.5.     Regional Market Dynamics. 85

Chapter No. 4 :……….. Medical Headgears Market – Industry Analysis. 86

4.1.       Introduction   86

4.2.       Market Drivers  87

4.2.1.     Increasing Prevalence of Chronic Diseases and Surgical Procedures. 87

4.2.2.     Continuous advancements in medical technology. 88

4.3.       Market Restraints. 89

4.3.1.     High Cost. 89

4.4.       Market Opportunities. 90

4.4.1.     Emergence of Personalized Medicine and Customized Solutions. 90

4.4.2.     Collaborations and Partnerships. 90

4.4.3.     Huge Growth Potential in Emerging Markets. 90

4.5.       Porter’s Five Forces Analysis. 91

4.6.       Value Chain Analysis. 93

4.7.       Buying Criteria  94

Chapter No. 5 :……….. Import Export Analysis. 96

5.1.       Import Analysis by Region. 96

5.1.1.     Global Medical Headgears Market Import Volume/Revenue, By Region, 2018 – 2023  96

5.2.       Export Analysis by Region. 97

5.2.1.     Global Medical Headgears Market Export Volume/Revenue, By Region, 2018 – 2023  97

Chapter No. 6 :……….. Demand Supply Analysis. 98

6.1.       Demand Analysis by Region. 98

6.1.1.     Global Medical Headgears Market Demand Volume/Revenue, By Region, 2018 – 2023  98

6.2.       Supply Analysis by Region. 99

6.2.1.     Global Medical Headgears Market Supply Volume/Revenue, By Region, 2018 – 2023  99

Chapter No. 7 :……….. Production Analysis. 100

7.1.       Production Analysis by Region. 100

7.1.1.     Global Medical Headgears Market Production, By Region, 2018 – 2023. 100

7.1.2.     Global Medical Headgears Market Production Volume, By Region, 2018 – 2023 (Mn Units)  100

Chapter No. 8 :……….. Price Analysis. 101

8.1.       Price Analysis by Region. 101

8.1.1.     Global Type Market Price, By Region, 2018 – 2023. 101

8.2.       Price Analysis by Type. 102

8.2.1.     Global Type Market Price, By Type, 2018 – 2023. 102

Chapter No. 9 :……….. Manufacturing Cost Analysis. 103

9.1.       Manufacturing Cost Analysis. 103

9.1.1.     Manufacturing Cost Analysis. 103

9.2.       Manufacturing Process. 106

Chapter No. 10 :……… Analysis Competitive Landscape. 108

10.1.    Company Market Share Analysis – 2023. 108

10.1.1.   Global Medical Headgears Market: Company Market Share, by Volume, 2023. 108

10.1.2.   Global Medical Headgears Market: Company Market Share, by Revenue, 2023. 109

10.1.3.   Global Medical Headgears Market: Top 6 Company Market Share, by Revenue, 2023  110

10.1.4.   Global Medical Headgears Market: Top 3 Company Market Share, by Revenue, 2023  111

10.1.    Global Medical Headgears Market Company Volume Market Share, 2023. 112

10.2.    Global Medical Headgears Market Company Revenue Market Share, 2023. 113

10.3.    Company Assessment Metrics, 2023. 114

10.3.1.   Stars  115

10.3.2.   Emerging Leaders. 115

10.3.3.   Pervasive Players. 115

10.3.4.   Participants. 115

Chapter No. 11 :……… PESTEL & Adjacent Market Analysis. 116

11.1.    PESTEL  116

11.1.1.   Political Factors. 116

11.1.2.   Economic Factors. 116

11.1.3.   Social Factors. 116

11.1.4.   Technological Factors. 117

11.1.5.   Environmental Factors. 117

11.1.6.   Legal Factors. 117

Chapter No. 12 :……… Medical Headgears Market – By Type Segment Analysis. 118

12.1.    Medical Headgears Market Overview, by Type Segment. 118

12.1.1.   Medical Headgears Market Volume Share, By Type, 2023 & 2032. 118

12.1.2.   Medical Headgears Market Revenue Share, By Type, 2023 & 2032. 119

12.1.3.   Medical Headgears Market Attractiveness Analysis, By Type. 120

12.1.4.   Incremental Revenue Growth Opportunity, by Type, 2024 – 2032. 121

12.1.5.   Medical Headgears Market Revenue, By Type, 2018, 2023, 2027 & 2032. 122

12.2.    Surgical Caps  123

12.3.    Patient Positioning. 124

12.4.    Respiratory Masks. 125

12.5.    Hearing Protection. 126

12.6.    Protective Helmets & Others. 127

Chapter No. 13 :……… Medical Headgears Market – By Application Segment Analysis  128

13.1.    Medical Headgears Market Overview, by Application Segment. 128

13.1.1.   Medical Headgears Market Volume Share, By Application, 2023 & 2032. 128

13.1.2.   Medical Headgears Market Revenue Share, By Application, 2023 & 2032. 129

13.1.3.   Medical Headgears Market Attractiveness Analysis, By Application. 130

13.1.4.   Incremental Revenue Growth Opportunity, by Application, 2024 – 2032. 131

13.1.5.   Medical Headgears Market Revenue, By Application, 2018, 2023, 2027 & 2032. 132

13.2.    Hospitals and Clinics. 133

13.3.    Ambulatory Surgical Centers. 134

13.4.    Diagnostic Centers. 135

13.5.    Homecare Settings. 136

13.6.    Others  137

Chapter No. 14 :……… Medical Headgears Market – By End-user Segment Analysis. 138

14.1.    Medical Headgears Market Overview, by End-user Segment. 138

14.1.1.   Medical Headgears Market Volume Share, By End-user, 2023 & 2032. 138

14.1.2.   Medical Headgears Market Revenue Share, By End-user, 2023 & 2032. 139

14.1.3.   Medical Headgears Market Attractiveness Analysis, By End-user. 140

14.1.4.   Incremental Revenue Growth Opportunity, by End-user, 2024 – 2032. 141

14.1.5.   Medical Headgears Market Revenue, By End-user, 2018, 2023, 2027 & 2032. 142

14.2.    Healthcare Professionals. 143

14.3.    Patients  144

Chapter No. 15 :……… Medical Headgears Market – By Material Segment Analysis. 145

15.1.    Medical Headgears Market Overview, by Material Segment. 145

15.1.1.   Medical Headgears Market Volume Share, By Material, 2023 & 2032. 145

15.1.2.   Medical Headgears Market Revenue Share, By Material, 2023 & 2032. 146

15.1.3.   Medical Headgears Market Attractiveness Analysis, By Material 147

15.1.4.   Incremental Revenue Growth Opportunity, by Material, 2024 – 2032. 148

15.1.5.   Medical Headgears Market Revenue, By Material, 2018, 2023, 2027 & 2032. 149

15.2.    Fabric-based   150

15.3.    Plastic-based   151

15.4.    Metal-based   152

Chapter No. 16 :……… Medical Headgears Market – By Distribution Channel Segment Analysis  153

16.1.    Medical Headgears Market Overview, by Distribution Channel Segment. 153

16.1.1.   Medical Headgears Market Volume Share, By Distribution Channel, 2023 & 2032. 153

16.1.2.   Medical Headgears Market Revenue Share, By Distribution Channel, 2023 & 2032. 154

16.1.3.   Medical Headgears Market Attractiveness Analysis, By Distribution Channel 155

16.1.4.   Incremental Revenue Growth Opportunity, by Distribution Channel, 2024 – 2032. 156

16.1.5.   Medical Headgears Market Revenue, By Distribution Channel, 2018, 2023, 2027 & 2032  157

16.2.    Direct Sales  158

16.3.    Distributors  159

Chapter No. 17 :……… Medical Headgears Market – Regional Analysis. 160

17.1.    Medical Headgears Market Overview, by Regional Segments. 160

17.2.    Region   160

17.2.1.   Global Medical Headgears Market Volume Share, By Region, 2023 & 2032. 160

17.2.2.   Global Medical Headgears Market Revenue Share, By Region, 2023 & 2032. 161

17.2.3.   Medical Headgears Market Attractiveness Analysis, By Region. 162

17.2.4.   Incremental Revenue Growth Opportunity, by Region, 2024 – 2032. 163

17.2.5.   Medical Headgears Market Revenue, By Region, 2018, 2023, 2027 & 2032. 164

17.2.6.   Global Medical Headgears Market Volume, By Region, 2018 – 2023 (Mn Units). 165

17.2.7.   Global Medical Headgears Market Volume, By Region, 2024 – 2032 (Mn Units). 165

17.2.8.   Global Medical Headgears Market Revenue, By Region, 2018 – 2023 (USD Million). 166

17.2.9.   Global Medical Headgears Market Revenue, By Region, 2024 – 2032 (USD Million). 166

Chapter No. 18 :……… Medical Headgears Market – North America.. 167

18.1.    North America  167

18.1.    Key Highlights  168

18.1.1.   North America Medical Headgears Market Volume, By Country, 2018 – 2032 (Mn Units)  169

18.1.2.   North America Medical Headgears Market Revenue, By Country, 2018 – 2023 (USD Million)  170

18.1.3.   North America Medical Headgears Market Volume, By End-user, 2018 – 2023 (Mn Units)  171

18.1.4.   North America Medical Headgears Market Revenue, By End-user, 2018 – 2023 (USD Million)  172

18.1.5.   North America Medical Headgears Market Volume, By Material, 2018 – 2023 (Mn Units)  173

18.1.6.   North America Medical Headgears Market Revenue, By Material, 2018 – 2023 (USD Million)  174

18.1.7.   North America Medical Headgears Market Volume, By Type, 2018 – 2023 (Mn Units)  175

18.1.8.   North America Medical Headgears Market Revenue, By Type, 2018 – 2023 (USD Million)  176

18.1.9.   North America Medical Headgears Market Volume, By Application, 2018 – 2023 (Mn Units)  177

18.1.10.              North America Medical Headgears Market Revenue, By Application, 2018 – 2023 (USD Million). 178

18.1.11.              North America Medical Headgears Market Volume, By Distribution Channel, 2018 – 2023 (Mn Units). 179

18.1.12.              North America Medical Headgears Market Revenue, By Distribution Channel, 2018 – 2023 (USD Million). 180

18.1.13.              U.S. 181

18.1.13.1.    U.S. Medical Headgears Market Volume, By End-user, 2018 – 2023 (Mn Units) 181

18.1.13.2.    U.S. Medical Headgears Market Revenue, By End-user, 2018 – 2023 (USD Million) 182

18.1.13.3.    U.S. Medical Headgears Market Volume, By Material, 2018 – 2023 (Mn Units) 183

18.1.13.4.    U.S. Medical Headgears Market Revenue, By Material, 2018 – 2023 (USD Million) 184

18.1.13.5.    U.S. Medical Headgears Market Volume, By Type, 2018 – 2023 (Mn Units) 185

18.1.13.6.    U.S. Medical Headgears Market Revenue, By Type, 2018 – 2023 (USD Million) 186

18.1.13.7.    U.S. Medical Headgears Market Volume, By Application, 2018 – 2023 (Mn Units) 187

18.1.13.8.    U.S. Medical Headgears Market Revenue, By Application, 2018 – 2023 (USD Million) 188

18.1.13.9.    U.S. Medical Headgears Market Volume, By Distribution Channel, 2018 – 2023 (Mn Units) 189

18.1.13.10.  U.S. Medical Headgears Market Revenue, By Distribution Channel, 2018 – 2023 (USD Million) 190

18.1.14.              Canada. 191

18.1.14.1.    Canada Medical Headgears Market Volume, By End-user, 2018 – 2023 (Mn Units) 191

18.1.14.2.    Canada Medical Headgears Market Revenue, By End-user, 2018 – 2023 (USD Million) 192

18.1.14.3.    Canada Medical Headgears Market Volume, By Material, 2018 – 2023 (Mn Units) 193

18.1.14.4.    Canada Medical Headgears Market Revenue, By Material, 2018 – 2023 (USD Million) 194

18.1.14.5.    Canada Medical Headgears Market Volume, By Type, 2018 – 2023 (Mn Units) 195

18.1.14.6.    Canada Medical Headgears Market Revenue, By Type, 2018 – 2023 (USD Million) 196

18.1.14.7.    Canada Medical Headgears Market Volume, By Application, 2018 – 2023 (Mn Units) 197

18.1.14.8.    Canada Medical Headgears Market Revenue, By Application, 2018 – 2023 (USD Million) 198

18.1.14.9.    Canada Medical Headgears Market Volume, By Distribution Channel, 2018 – 2023 (Mn Units) 199

18.1.14.10.  Canada Medical Headgears Market Revenue, By Distribution Channel, 2018 – 2023 (USD Million) 200

18.1.15.              Mexico. 201

18.1.15.1.    Mexico Medical Headgears Market Volume, By End-user, 2018 – 2023 (Mn Units) 201

18.1.15.2.    Mexico Medical Headgears Market Revenue, By End-user, 2018 – 2023 (USD Million) 202

18.1.15.3.    Mexico Medical Headgears Market Volume, By Material, 2018 – 2023 (Mn Units) 203

18.1.15.4.    Mexico Medical Headgears Market Revenue, By Material, 2018 – 2023 (USD Million) 204

18.1.15.5.    Mexico Medical Headgears Market Volume, By Type, 2018 – 2023 (Mn Units) 205

18.1.15.6.    Mexico Medical Headgears Market Revenue, By Type, 2018 – 2023 (USD Million) 206

18.1.15.7.    Mexico Medical Headgears Market Volume, By Application, 2018 – 2023 (Mn Units) 207

18.1.15.8.    Mexico Medical Headgears Market Revenue, By Application, 2018 – 2023 (USD Million) 208

18.1.15.9.    Mexico Medical Headgears Market Volume, By Distribution Channel, 2018 – 2023 (Mn Units) 209

18.1.15.10.  Mexico Medical Headgears Market Revenue, By Distribution Channel, 2018 – 2023 (USD Million) 210

Chapter No. 19 :……… Medical Headgears Market – Europe. 211

19.1.    Europe   211

19.2.    Key Highlights  212

19.2.1.   Europe Medical Headgears Market Volume, By Country, 2018 – 2023 (Mn Units). 213

19.2.2.   Europe Medical Headgears Market Revenue, By Country, 2018 – 2023 (USD Million)  214

19.2.3.   Europe Medical Headgears Market Volume, By End-user, 2018 – 2023 (Mn Units). 215

19.2.4.   Europe Medical Headgears Market Revenue, By End-user, 2018 – 2023 (USD Million)  216

19.2.5.   Europe Medical Headgears Market Volume, By Material, 2018 – 2023 (Mn Units). 217

19.2.6.   Europe Medical Headgears Market Revenue, By Material, 2018 – 2023 (USD Million)  218

19.2.7.   Europe Medical Headgears Market Volume, By Type, 2018 – 2023 (Mn Units). 219

19.2.8.   Europe Medical Headgears Market Revenue, By Type, 2018 – 2023 (USD Million). 220

19.2.9.   Europe Medical Headgears Market Volume, By Application, 2018 – 2023 (Mn Units)  221

19.2.10.              Europe Medical Headgears Market Revenue, By Application, 2018 – 2023 (USD Million)  222

19.2.11.              Europe Medical Headgears Market Volume, By Distribution Channel, 2018 – 2023 (Mn Units). 223

19.2.12.              Europe Medical Headgears Market Revenue, By Distribution Channel, 2018 – 2023 (USD Million). 224

19.2.13.              UK. 225

19.2.13.1.    UK Medical Headgears Market Volume, By End-user, 2018 – 2023 (Mn Units) 225

19.2.13.2.    UK Medical Headgears Market Revenue, By End-user, 2018 – 2023 (USD Million) 226

19.2.13.3.    UK Medical Headgears Market Volume, By Material, 2018 – 2023 (Mn Units) 227

19.2.13.4.    UK Medical Headgears Market Revenue, By Material, 2018 – 2023 (USD Million) 228

19.2.13.5.    UK Medical Headgears Market Volume, By Type, 2018 – 2023 (Mn Units) 229

19.2.13.6.    UK Medical Headgears Market Revenue, By Type, 2018 – 2023 (USD Million) 230

19.2.13.7.    UK Medical Headgears Market Volume, By Application, 2018 – 2023 (Mn Units) 231

19.2.13.8.    UK Medical Headgears Market Revenue, By Application, 2018 – 2023 (USD Million) 232

19.2.13.9.    UK Medical Headgears Market Volume, By Distribution Channel, 2018 – 2023 (Mn Units) 233

19.2.13.10.  UK Medical Headgears Market Revenue, By Distribution Channel, 2018 – 2023 (USD Million) 234

19.2.14.              France. 235

19.2.14.1.    France Medical Headgears Market Volume, By End-user, 2018 – 2023 (Mn Units) 235

19.2.14.2.    France Medical Headgears Market Revenue, By End-user, 2018 – 2023 (USD Million) 236

19.2.14.3.    France Medical Headgears Market Volume, By Material, 2018 – 2023 (Mn Units) 237

19.2.14.4.    France Medical Headgears Market Revenue, By Material, 2018 – 2023 (USD Million) 238

19.2.14.5.    France Medical Headgears Market Volume, By Type, 2018 – 2023 (Mn Units) 239

19.2.14.6.    France Medical Headgears Market Revenue, By Type, 2018 – 2023 (USD Million) 240

19.2.14.7.    France Medical Headgears Market Volume, By Application, 2018 – 2023 (Mn Units) 241

19.2.14.8.    France Medical Headgears Market Revenue, By Application, 2018 – 2023 (USD Million) 242

19.2.14.9.    France Medical Headgears Market Volume, By Distribution Channel, 2018 – 2023 (Mn Units) 243

19.2.14.10.  France Medical Headgears Market Revenue, By Distribution Channel, 2018 – 2023 (USD Million) 244

19.2.15.              Germany. 245

19.2.15.1.    Germany Medical Headgears Market Volume, By End-user, 2018 – 2023 (Mn Units) 245

19.2.15.2.    Germany Medical Headgears Market Revenue, By End-user, 2018 – 2023 (USD Million) 246

19.2.15.3.    Germany Medical Headgears Market Volume, By Material, 2018 – 2023 (Mn Units) 247

19.2.15.4.    Germany Medical Headgears Market Revenue, By Material, 2018 – 2023 (USD Million) 248

19.2.15.5.    Germany Medical Headgears Market Volume, By Type, 2018 – 2023 (Mn Units) 249

19.2.15.6.    Germany Medical Headgears Market Revenue, By Type, 2018 – 2023 (USD Million) 250

19.2.15.7.    Germany Medical Headgears Market Volume, By Application, 2018 – 2023 (Mn Units) 251

19.2.15.8.    Germany Medical Headgears Market Revenue, By Application, 2018 – 2023 (USD Million) 252

19.2.15.9.    Germany Medical Headgears Market Volume, By Distribution Channel, 2018 – 2023 (Mn Units) 253

19.2.15.10.  Germany Medical Headgears Market Revenue, By Distribution Channel, 2018 – 2023 (USD Million) 254

19.2.16.              Italy. 255

19.2.16.1.    Italy Medical Headgears Market Volume, By End-user, 2018 – 2023 (Mn Units) 255

19.2.16.2.    Italy Medical Headgears Market Revenue, By End-user, 2018 – 2023 (USD Million) 256

19.2.16.3.    Italy Medical Headgears Market Volume, By Material, 2018 – 2023 (Mn Units) 257

19.2.16.4.    Italy Medical Headgears Market Revenue, By Material, 2018 – 2023 (USD Million) 258

19.2.16.5.    Italy Medical Headgears Market Volume, By Type, 2018 – 2023 (Mn Units) 259

19.2.16.6.    Italy Medical Headgears Market Revenue, By Type, 2018 – 2023 (USD Million) 260

19.2.16.7.    Italy Medical Headgears Market Volume, By Application, 2018 – 2023 (Mn Units) 261

19.2.16.8.    Italy Medical Headgears Market Revenue, By Application, 2018 – 2023 (USD Million) 262

19.2.16.9.    Italy Medical Headgears Market Volume, By Distribution Channel, 2018 – 2023 (Mn Units) 263

19.2.16.10.  Italy Medical Headgears Market Revenue, By Distribution Channel, 2018 – 2023 (USD Million) 264

19.2.17.              Spain. 265

19.2.17.1.    Spain Medical Headgears Market Volume, By End-user, 2018 – 2023 (Mn Units) 265

19.2.17.2.    Spain Medical Headgears Market Revenue, By End-user, 2018 – 2023 (USD Million) 266

19.2.17.3.    Spain Medical Headgears Market Volume, By Material, 2018 – 2023 (Mn Units) 267

19.2.17.4.    Spain Medical Headgears Market Revenue, By Material, 2018 – 2023 (USD Million) 268

19.2.17.5.    Spain Medical Headgears Market Volume, By Type, 2018 – 2023 (Mn Units) 269

19.2.17.6.    Spain Medical Headgears Market Revenue, By Type, 2018 – 2023 (USD Million) 270

19.2.17.7.    Spain Medical Headgears Market Volume, By Application, 2018 – 2023 (Mn Units) 271

19.2.17.8.    Spain Medical Headgears Market Revenue, By Application, 2018 – 2023 (USD Million) 272

19.2.17.9.    Spain Medical Headgears Market Volume, By Distribution Channel, 2018 – 2023 (Mn Units) 273

19.2.17.10.  Spain Medical Headgears Market Revenue, By Distribution Channel, 2018 – 2023 (USD Million) 274

19.2.18.              Russia. 275

19.2.18.1.    Russia Medical Headgears Market Volume, By End-user, 2018 – 2023 (Mn Units) 275

19.2.18.2.    Russia Medical Headgears Market Revenue, By End-user, 2018 – 2023 (USD Million) 276

19.2.18.3.    Russia Medical Headgears Market Volume, By Material, 2018 – 2023 (Mn Units) 277

19.2.18.4.    Russia Medical Headgears Market Revenue, By Material, 2018 – 2023 (USD Million) 278

19.2.18.5.    Russia Medical Headgears Market Volume, By Type, 2018 – 2023 (Mn Units) 279

19.2.18.6.    Russia Medical Headgears Market Revenue, By Type, 2018 – 2023 (USD Million) 280

19.2.18.7.    Russia Medical Headgears Market Volume, By Application, 2018 – 2023 (Mn Units) 281

19.2.18.8.    Russia Medical Headgears Market Revenue, By Application, 2018 – 2023 (USD Million) 282

19.2.18.9.    Russia Medical Headgears Market Volume, By Distribution Channel, 2018 – 2023 (Mn Units) 283

19.2.18.10.  Russia Medical Headgears Market Revenue, By Distribution Channel, 2018 – 2023 (USD Million) 284

19.2.19.              Belgium.. 285

19.2.19.1.    Belgium Medical Headgears Market Volume, By End-user, 2018 – 2023 (Mn Units) 285

19.2.19.2.    Belgium Medical Headgears Market Revenue, By End-user, 2018 – 2023 (USD Million) 286

19.2.19.3.    Belgium Medical Headgears Market Volume, By Material, 2018 – 2023 (Mn Units) 287

19.2.19.4.    Belgium Medical Headgears Market Revenue, By Material, 2018 – 2023 (USD Million) 288

19.2.19.5.    Belgium Medical Headgears Market Volume, By Type, 2018 – 2023 (Mn Units) 289

19.2.19.6.    Belgium Medical Headgears Market Revenue, By Type, 2018 – 2023 (USD Million) 290

19.2.19.7.    Belgium Medical Headgears Market Volume, By Application, 2018 – 2023 (Mn Units) 291

19.2.19.8.    Belgium Medical Headgears Market Revenue, By Application, 2018 – 2023 (USD Million) 292

19.2.19.9.    Belgium Medical Headgears Market Volume, By Distribution Channel, 2018 – 2023 (Mn Units) 293

19.2.19.10.  Belgium Medical Headgears Market Revenue, By Distribution Channel, 2018 – 2023 (USD Million) 294

19.2.20.              Netherland. 295

19.2.20.1.    Netherland Medical Headgears Market Volume, By End-user, 2018 – 2023 (Mn Units) 295

19.2.20.2.    Netherland Medical Headgears Market Revenue, By End-user, 2018 – 2023 (USD Million) 296

19.2.20.3.    Netherland Medical Headgears Market Volume, By Material, 2018 – 2023 (Mn Units) 297

19.2.20.4.    Netherland Medical Headgears Market Revenue, By Material, 2018 – 2023 (USD Million) 298

19.2.20.5.    Netherland Medical Headgears Market Volume, By Type, 2018 – 2023 (Mn Units) 299

19.2.20.6.    Netherland Medical Headgears Market Revenue, By Type, 2018 – 2023 (USD Million) 300

19.2.20.7.    Netherland Medical Headgears Market Volume, By Application, 2018 – 2023 (Mn Units) 301

19.2.20.8.    Netherland Medical Headgears Market Revenue, By Application, 2018 – 2023 (USD Million) 302

19.2.20.9.    Netherland Medical Headgears Market Volume, By Distribution Channel, 2018 – 2023 (Mn Units) 303

19.2.20.10.  Netherland Medical Headgears Market Revenue, By Distribution Channel, 2018 – 2023 (USD Million) 304

19.2.21.              Austria. 305

19.2.21.1.    Austria Medical Headgears Market Volume, By End-user, 2018 – 2023 (Mn Units) 305

19.2.21.2.    Austria Medical Headgears Market Revenue, By End-user, 2018 – 2023 (USD Million) 306

19.2.21.3.    Austria Medical Headgears Market Volume, By Material, 2018 – 2023 (Mn Units) 307

19.2.21.4.    Austria Medical Headgears Market Revenue, By Material, 2018 – 2023 (USD Million) 308

19.2.21.5.    Austria Medical Headgears Market Volume, By Type, 2018 – 2023 (Mn Units) 309

19.2.21.6.    Austria Medical Headgears Market Revenue, By Type, 2018 – 2023 (USD Million) 310

19.2.21.7.    Austria Medical Headgears Market Volume, By Application, 2018 – 2023 (Mn Units) 311

19.2.21.8.    Austria Medical Headgears Market Revenue, By Application, 2018 – 2023 (USD Million) 312

19.2.21.9.    Austria Medical Headgears Market Volume, By Distribution Channel, 2018 – 2023 (Mn Units) 313

19.2.21.10.  Austria Medical Headgears Market Revenue, By Distribution Channel, 2018 – 2023 (USD Million) 314

19.2.22.              Sweden. 315

19.2.22.1.    Sweden Medical Headgears Market Volume, By End-user, 2018 – 2023 (Mn Units) 315

19.2.22.2.    Sweden Medical Headgears Market Revenue, By End-user, 2018 – 2023 (USD Million) 316

19.2.22.3.    Sweden Medical Headgears Market Volume, By Material, 2018 – 2023 (Mn Units) 317

19.2.22.4.    Sweden Medical Headgears Market Revenue, By Material, 2018 – 2023 (USD Million) 318

19.2.22.5.    Sweden Medical Headgears Market Volume, By Type, 2018 – 2023 (Mn Units) 319

19.2.22.6.    Sweden Medical Headgears Market Revenue, By Type, 2018 – 2023 (USD Million) 320

19.2.22.7.    Sweden Medical Headgears Market Volume, By Application, 2018 – 2023 (Mn Units) 321

19.2.22.8.    Sweden Medical Headgears Market Revenue, By Application, 2018 – 2023 (USD Million) 322

19.2.22.9.    Sweden Medical Headgears Market Volume, By Distribution Channel, 2018 – 2023 (Mn Units) 323

19.2.22.10.  Sweden Medical Headgears Market Revenue, By Distribution Channel, 2018 – 2023 (USD Million) 324

19.2.23.              Poland. 325

19.2.23.1.    Poland Medical Headgears Market Volume, By End-user, 2018 – 2023 (Mn Units) 325

19.2.23.2.    Poland Medical Headgears Market Revenue, By End-user, 2018 – 2023 (USD Million) 326

19.2.23.3.    Poland Medical Headgears Market Volume, By Material, 2018 – 2023 (Mn Units) 327

19.2.23.4.    Poland Medical Headgears Market Revenue, By Material, 2018 – 2023 (USD Million) 328

19.2.23.5.    Poland Medical Headgears Market Volume, By Type, 2018 – 2023 (Mn Units) 329

19.2.23.6.    Poland Medical Headgears Market Revenue, By Type, 2018 – 2023 (USD Million) 330

19.2.23.7.    Poland Medical Headgears Market Volume, By Application, 2018 – 2023 (Mn Units) 331

19.2.23.8.    Poland Medical Headgears Market Revenue, By Application, 2018 – 2023 (USD Million) 332

19.2.23.9.    Poland Medical Headgears Market Volume, By Distribution Channel, 2018 – 2023 (Mn Units) 333

19.2.23.10.  Poland Medical Headgears Market Revenue, By Distribution Channel, 2018 – 2023 (USD Million) 334

19.2.24.              Denmark. 335

19.2.24.1.    Denmark Medical Headgears Market Volume, By End-user, 2018 – 2023 (Mn Units) 335

19.2.24.2.    Denmark Medical Headgears Market Revenue, By End-user, 2018 – 2023 (USD Million) 336

19.2.24.3.    Denmark Medical Headgears Market Volume, By Material, 2018 – 2023 (Mn Units) 337

19.2.24.4.    Denmark Medical Headgears Market Revenue, By Material, 2018 – 2023 (USD Million) 338

19.2.24.5.    Denmark Medical Headgears Market Volume, By Type, 2018 – 2023 (Mn Units) 339

19.2.24.6.    Denmark Medical Headgears Market Revenue, By Type, 2018 – 2023 (USD Million) 340

19.2.24.7.    Denmark Medical Headgears Market Volume, By Application, 2018 – 2023 (Mn Units) 341

19.2.24.8.    Denmark Medical Headgears Market Revenue, By Application, 2018 – 2023 (USD Million) 342

19.2.24.9.    Denmark Medical Headgears Market Volume, By Distribution Channel, 2018 – 2023 (Mn Units) 343

19.2.24.10.  Denmark Medical Headgears Market Revenue, By Distribution Channel, 2018 – 2023 (USD Million) 344

19.2.25.              Switzerland. 345

19.2.25.1.    Switzerland Medical Headgears Market Volume, By End-user, 2018 – 2023 (Mn Units) 345

19.2.25.2.    Switzerland Medical Headgears Market Revenue, By End-user, 2018 – 2023 (USD Million) 346

19.2.25.3.    Switzerland Medical Headgears Market Volume, By Material, 2018 – 2023 (Mn Units) 347

19.2.25.4.    Switzerland Medical Headgears Market Revenue, By Material, 2018 – 2023 (USD Million) 348

19.2.25.5.    Switzerland Medical Headgears Market Volume, By Type, 2018 – 2023 (Mn Units) 349

19.2.25.6.    Switzerland Medical Headgears Market Revenue, By Type, 2018 – 2023 (USD Million) 350

19.2.25.7.    Switzerland Medical Headgears Market Volume, By Application, 2018 – 2023 (Mn Units) 351

19.2.25.8.    Switzerland Medical Headgears Market Revenue, By Application, 2018 – 2023 (USD Million) 352

19.2.25.9.    Switzerland Medical Headgears Market Volume, By Distribution Channel, 2018 – 2023 (Mn Units) 353

19.2.25.10.  Switzerland Medical Headgears Market Revenue, By Distribution Channel, 2018 – 2023 (USD Million) 354

19.2.26.              Rest of Europe. 355

19.2.26.1.    Rest of Europe Medical Headgears Market Volume, By End-user, 2018 – 2023 (Mn Units) 355

19.2.26.2.    Rest of Europe Medical Headgears Market Revenue, By End-user, 2018 – 2023 (USD Million) 356

19.2.26.3.    Rest of Europe Medical Headgears Market Volume, By Material, 2018 – 2023 (Mn Units) 357

19.2.26.4.    Rest of Europe Medical Headgears Market Revenue, By Material, 2018 – 2023 (USD Million) 358

19.2.26.5.    Rest of Europe Medical Headgears Market Volume, By Type, 2018 – 2023 (Mn Units) 359

19.2.26.6.    Rest of Europe Medical Headgears Market Revenue, By Type, 2018 – 2023 (USD Million) 360

19.2.26.7.    Rest of Europe Medical Headgears Market Volume, By Application, 2018 – 2023 (Mn Units) 361

19.2.26.8.    Rest of Europe Medical Headgears Market Revenue, By Application, 2018 – 2023 (USD Million) 362

19.2.26.9.    Rest of Europe Medical Headgears Market Volume, By Distribution Channel, 2018 – 2023 (Mn Units) 363

19.2.26.10.  Rest of Europe Medical Headgears Market Revenue, By Distribution Channel, 2018 – 2023 (USD Million) 364

Chapter No. 20 :……… Medical Headgears Market – Asia Pacific. 365

20.1.    Asia Pacific  365

20.2.    Key Highlights  366

20.2.1.   Asia Pacific Medical Headgears Market Volume, By Country, 2018 – 2023 (Mn Units)  367

20.2.2.   Asia Pacific Medical Headgears Market Revenue, By Country, 2018 – 2023 (USD Million)  368

20.2.3.   Asia Pacific Medical Headgears Market Volume, By End-user, 2018 – 2023 (Mn Units)  369

20.2.4.   Asia Pacific Medical Headgears Market Revenue, By End-user, 2018 – 2023 (USD Million)  370

20.2.5.   Asia Pacific Medical Headgears Market Volume, By Material, 2018 – 2023 (Mn Units)  371

20.2.6.   Asia Pacific Medical Headgears Market Revenue, By Material, 2018 – 2023 (USD Million)  372

20.2.7.   Asia Pacific Medical Headgears Market Volume, By Type, 2018 – 2023 (Mn Units). 373

20.2.8.   Asia Pacific Medical Headgears Market Revenue, By Type, 2018 – 2023 (USD Million)  374

20.2.9.   Asia Pacific Medical Headgears Market Volume, By Application, 2018 – 2023 (Mn Units)  375

20.2.10.              Asia Pacific Medical Headgears Market Revenue, By Application, 2018 – 2023 (USD Million)  376

20.2.11.              Asia Pacific Medical Headgears Market Volume, By Distribution Channel, 2018 – 2023 (Mn Units). 377

20.2.12.              Asia Pacific Medical Headgears Market Revenue, By Distribution Channel, 2018 – 2023 (USD Million). 378

20.2.13.              China. 379

20.2.13.1.    China Medical Headgears Market Volume, By End-user, 2018 – 2023 (Mn Units) 379

20.2.13.2.    China Medical Headgears Market Revenue, By End-user, 2018 – 2023 (USD Million) 380

20.2.13.3.    China Medical Headgears Market Volume, By Material, 2018 – 2023 (Mn Units) 381

20.2.13.4.    China Medical Headgears Market Revenue, By Material, 2018 – 2023 (USD Million) 382

20.2.13.5.    China Medical Headgears Market Volume, By Type, 2018 – 2023 (Mn Units) 383

20.2.13.6.    China Medical Headgears Market Revenue, By Type, 2018 – 2023 (USD Million) 384

20.2.13.7.    China Medical Headgears Market Volume, By Application, 2018 – 2023 (Mn Units) 385

20.2.13.8.    China Medical Headgears Market Revenue, By Application, 2018 – 2023 (USD Million) 386

20.2.13.9.    China Medical Headgears Market Volume, By Distribution Channel, 2018 – 2023 (Mn Units) 387

20.2.13.10.  China Medical Headgears Market Revenue, By Distribution Channel, 2018 – 2023 (USD Million) 388

20.2.14.              Japan. 389

20.2.14.1.    Japan Medical Headgears Market Volume, By End-user, 2018 – 2023 (Mn Units) 389

20.2.14.2.    Japan Medical Headgears Market Revenue, By End-user, 2018 – 2023 (USD Million) 390

20.2.14.3.    Japan Medical Headgears Market Volume, By Material, 2018 – 2023 (Mn Units) 391

20.2.14.4.    Japan Medical Headgears Market Revenue, By Material, 2018 – 2023 (USD Million) 392

20.2.14.5.    Japan Medical Headgears Market Volume, By Type, 2018 – 2023 (Mn Units) 393

20.2.14.6.    Japan Medical Headgears Market Revenue, By Type, 2018 – 2023 (USD Million) 394

20.2.14.7.    Japan Medical Headgears Market Volume, By Application, 2018 – 2023 (Mn Units) 395

20.2.14.8.    Japan Medical Headgears Market Revenue, By Application, 2018 – 2023 (USD Million) 396

20.2.14.9.    Japan Medical Headgears Market Volume, By Distribution Channel, 2018 – 2023 (Mn Units) 397

20.2.14.10.  Japan Medical Headgears Market Revenue, By Distribution Channel, 2018 – 2023 (USD Million) 398

20.2.15.              South Korea. 399

20.2.15.1.    South Korea Medical Headgears Market Volume, By End-user, 2018 – 2023 (Mn Units) 399

20.2.15.2.    South Korea Medical Headgears Market Revenue, By End-user, 2018 – 2023 (USD Million) 400

20.2.15.3.    South Korea Medical Headgears Market Volume, By Material, 2018 – 2023 (Mn Units) 401

20.2.15.4.    South Korea Medical Headgears Market Revenue, By Material, 2018 – 2023 (USD Million) 402

20.2.15.5.    South Korea Medical Headgears Market Volume, By Type, 2018 – 2023 (Mn Units) 403

20.2.15.6.    South Korea Medical Headgears Market Revenue, By Type, 2018 – 2023 (USD Million) 404

20.2.15.7.    South Korea Medical Headgears Market Volume, By Application, 2018 – 2023 (Mn Units) 405

20.2.15.8.    South Korea Medical Headgears Market Revenue, By Application, 2018 – 2023 (USD Million) 406

20.2.15.9.    South Korea Medical Headgears Market Volume, By Distribution Channel, 2018 – 2023 (Mn Units) 407

20.2.15.10.  South Korea Medical Headgears Market Revenue, By Distribution Channel, 2018 – 2023 (USD Million) 408

20.2.16.              India. 409

20.2.16.1.    India Medical Headgears Market Volume, By End-user, 2018 – 2023 (Mn Units) 409

20.2.16.2.    India Medical Headgears Market Revenue, By End-user, 2018 – 2023 (USD Million) 410

20.2.16.3.    India Medical Headgears Market Volume, By Material, 2018 – 2023 (Mn Units) 411

20.2.16.4.    India Medical Headgears Market Revenue, By Material, 2018 – 2023 (USD Million) 412

20.2.16.5.    India Medical Headgears Market Volume, By Type, 2018 – 2023 (Mn Units) 413

20.2.16.6.    India Medical Headgears Market Revenue, By Type, 2018 – 2023 (USD Million) 414

20.2.16.7.    India Medical Headgears Market Volume, By Application, 2018 – 2023 (Mn Units) 415

20.2.16.8.    India Medical Headgears Market Revenue, By Application, 2018 – 2023 (USD Million) 416

20.2.16.9.    India Medical Headgears Market Volume, By Distribution Channel, 2018 – 2023 (Mn Units) 417

20.2.16.10.  India Medical Headgears Market Revenue, By Distribution Channel, 2018 – 2023 (USD Million) 418

20.2.17.              Australia. 419

20.2.17.1.    Australia Medical Headgears Market Volume, By End-user, 2018 – 2023 (Mn Units) 419

20.2.17.2.    Australia Medical Headgears Market Revenue, By End-user, 2018 – 2023 (USD Million) 420

20.2.17.3.    Australia Medical Headgears Market Volume, By Material, 2018 – 2023 (Mn Units) 421

20.2.17.4.    Australia Medical Headgears Market Revenue, By Material, 2018 – 2023 (USD Million) 422

20.2.17.5.    Australia Medical Headgears Market Volume, By Type, 2018 – 2023 (Mn Units) 423

20.2.17.6.    Australia Medical Headgears Market Revenue, By Type, 2018 – 2023 (USD Million) 424

20.2.17.7.    Australia Medical Headgears Market Volume, By Application, 2018 – 2023 (Mn Units) 425

20.2.17.8.    Australia Medical Headgears Market Revenue, By Application, 2018 – 2023 (USD Million) 426

20.2.17.9.    Australia Medical Headgears Market Volume, By Distribution Channel, 2018 – 2023 (Mn Units) 427

20.2.17.10.  Australia Medical Headgears Market Revenue, By Distribution Channel, 2018 – 2023 (USD Million) 428

20.2.18.              Thailand. 429

20.2.18.1.    Thailand Medical Headgears Market Volume, By End-user, 2018 – 2023 (Mn Units) 429

20.2.18.2.    Thailand Medical Headgears Market Revenue, By End-user, 2018 – 2023 (USD Million) 430

20.2.18.3.    Thailand Medical Headgears Market Volume, By Material, 2018 – 2023 (Mn Units) 431

20.2.18.4.    Thailand Medical Headgears Market Revenue, By Material, 2018 – 2023 (USD Million) 432

20.2.18.5.    Thailand Medical Headgears Market Volume, By Type, 2018 – 2023 (Mn Units) 433

20.2.18.6.    Thailand Medical Headgears Market Revenue, By Type, 2018 – 2023 (USD Million) 434

20.2.18.7.    Thailand Medical Headgears Market Volume, By Application, 2018 – 2023 (Mn Units) 435

20.2.18.8.    Thailand Medical Headgears Market Revenue, By Application, 2018 – 2023 (USD Million) 436

20.2.18.9.    Thailand Medical Headgears Market Volume, By Distribution Channel, 2018 – 2023 (Mn Units) 437

20.2.18.10.  Thailand Medical Headgears Market Revenue, By Distribution Channel, 2018 – 2023 (USD Million) 438

20.2.19.              Indonesia. 439

20.2.19.1.    Indonesia Medical Headgears Market Volume, By End-user, 2018 – 2023 (Mn Units) 439

20.2.19.2.    Indonesia Medical Headgears Market Revenue, By End-user, 2018 – 2023 (USD Million) 440

20.2.19.3.    Indonesia Medical Headgears Market Volume, By Material, 2018 – 2023 (Mn Units) 441

20.2.19.4.    Indonesia Medical Headgears Market Revenue, By Material, 2018 – 2023 (USD Million) 442

20.2.19.5.    Indonesia Medical Headgears Market Volume, By Type, 2018 – 2023 (Mn Units) 443

20.2.19.6.    Indonesia Medical Headgears Market Revenue, By Type, 2018 – 2023 (USD Million) 444

20.2.19.7.    Indonesia Medical Headgears Market Volume, By Application, 2018 – 2023 (Mn Units) 445

20.2.19.8.    Indonesia Medical Headgears Market Revenue, By Application, 2018 – 2023 (USD Million) 446

20.2.19.9.    Indonesia Medical Headgears Market Volume, By Distribution Channel, 2018 – 2023 (Mn Units) 447

20.2.19.10.  Indonesia Medical Headgears Market Revenue, By Distribution Channel, 2018 – 2023 (USD Million) 448

20.2.20.              Vietnam.. 449

20.2.20.1.    Vietnam Medical Headgears Market Volume, By End-user, 2018 – 2023 (Mn Units) 449

20.2.20.2.    Vietnam Medical Headgears Market Revenue, By End-user, 2018 – 2023 (USD Million) 450

20.2.20.3.    Vietnam Medical Headgears Market Volume, By Material, 2018 – 2023 (Mn Units) 451

20.2.20.4.    Vietnam Medical Headgears Market Revenue, By Material, 2018 – 2023 (USD Million) 452

20.2.20.5.    Vietnam Medical Headgears Market Volume, By Type, 2018 – 2023 (Mn Units) 453

20.2.20.6.    Vietnam Medical Headgears Market Revenue, By Type, 2018 – 2023 (USD Million) 454

20.2.20.7.    Vietnam Medical Headgears Market Volume, By Application, 2018 – 2023 (Mn Units) 455

20.2.20.8.    Vietnam Medical Headgears Market Revenue, By Application, 2018 – 2023 (USD Million) 456

20.2.20.9.    Vietnam Medical Headgears Market Volume, By Distribution Channel, 2018 – 2023 (Mn Units) 457

20.2.20.10.  Vietnam Medical Headgears Market Revenue, By Distribution Channel, 2018 – 2023 (USD Million) 458

20.2.21.              Malaysia. 459

20.2.21.1.    Malaysia Medical Headgears Market Volume, By End-user, 2018 – 2023 (Mn Units) 459

20.2.21.2.    Malaysia Medical Headgears Market Revenue, By End-user, 2018 – 2023 (USD Million) 460

20.2.21.3.    Malaysia Medical Headgears Market Volume, By Material, 2018 – 2023 (Mn Units) 461

20.2.21.4.    Malaysia Medical Headgears Market Revenue, By Material, 2018 – 2023 (USD Million) 462

20.2.21.5.    Malaysia Medical Headgears Market Volume, By Type, 2018 – 2023 (Mn Units) 463

20.2.21.6.    Malaysia Medical Headgears Market Revenue, By Type, 2018 – 2023 (USD Million) 464

20.2.21.7.    Malaysia Medical Headgears Market Volume, By Application, 2018 – 2023 (Mn Units) 465

20.2.21.8.    Malaysia Medical Headgears Market Revenue, By Application, 2018 – 2023 (USD Million) 466

20.2.21.9.    Malaysia Medical Headgears Market Volume, By Distribution Channel, 2018 – 2023 (Mn Units) 467

20.2.21.10.  Malaysia Medical Headgears Market Revenue, By Distribution Channel, 2018 – 2023 (USD Million) 468

20.2.22.              Philippines. 469

20.2.22.1.    Philippines Medical Headgears Market Volume, By End-user, 2018 – 2023 (Mn Units) 469

20.2.22.2.    Philippines Medical Headgears Market Revenue, By End-user, 2018 – 2023 (USD Million) 470

20.2.22.3.    Philippines Medical Headgears Market Volume, By Material, 2018 – 2023 (Mn Units) 471

20.2.22.4.    Philippines Medical Headgears Market Revenue, By Material, 2018 – 2023 (USD Million) 472

20.2.22.5.    Philippines Medical Headgears Market Volume, By Type, 2018 – 2023 (Mn Units) 473

20.2.22.6.    Philippines Medical Headgears Market Revenue, By Type, 2018 – 2023 (USD Million) 474

20.2.22.7.    Philippines Medical Headgears Market Volume, By Application, 2018 – 2023 (Mn Units) 475

20.2.22.8.    Philippines Medical Headgears Market Revenue, By Application, 2018 – 2023 (USD Million) 476

20.2.22.9.    Philippines Medical Headgears Market Volume, By Distribution Channel, 2018 – 2023 (Mn Units) 477

20.2.22.10.  Philippines Medical Headgears Market Revenue, By Distribution Channel, 2018 – 2023 (USD Million) 478

20.2.23.              Taiwan. 479

20.2.23.1.    Taiwan Medical Headgears Market Volume, By End-user, 2018 – 2023 (Mn Units) 479

20.2.23.2.    Taiwan Medical Headgears Market Revenue, By End-user, 2018 – 2023 (USD Million) 480

20.2.23.3.    Taiwan Medical Headgears Market Volume, By Material, 2018 – 2023 (Mn Units) 481

20.2.23.4.    Taiwan Medical Headgears Market Revenue, By Material, 2018 – 2023 (USD Million) 482

20.2.23.5.    Taiwan Medical Headgears Market Volume, By Type, 2018 – 2023 (Mn Units) 483

20.2.23.6.    Taiwan Medical Headgears Market Revenue, By Type, 2018 – 2023 (USD Million) 484

20.2.23.7.    Taiwan Medical Headgears Market Volume, By Application, 2018 – 2023 (Mn Units) 485

20.2.23.8.    Taiwan Medical Headgears Market Revenue, By Application, 2018 – 2023 (USD Million) 486

20.2.23.9.    Taiwan Medical Headgears Market Volume, By Distribution Channel, 2018 – 2023 (Mn Units) 487

20.2.23.10.  Taiwan Medical Headgears Market Revenue, By Distribution Channel, 2018 – 2023 (USD Million) 488

20.2.24.              Rest of Asia Pacific. 489

20.2.24.1.    Rest of Asia Pacific Medical Headgears Market Volume, By End-user, 2018 – 2023 (Mn Units) 489

20.2.24.2.    Rest of Asia Pacific Medical Headgears Market Revenue, By End-user, 2018 – 2023 (USD Million) 490

20.2.24.3.    Rest of Asia Pacific Medical Headgears Market Volume, By Material, 2018 – 2023 (Mn Units) 491

20.2.24.4.    Rest of Asia Pacific Medical Headgears Market Revenue, By Material, 2018 – 2023 (USD Million) 492

20.2.24.5.    Rest of Asia Pacific Medical Headgears Market Volume, By Type, 2018 – 2023 (Mn Units) 493

20.2.24.6.    Rest of Asia Pacific Medical Headgears Market Revenue, By Type, 2018 – 2023 (USD Million) 494

20.2.24.7.    Rest of Asia Pacific Medical Headgears Market Volume, By Application, 2018 – 2023 (Mn Units) 495

20.2.24.8.    Rest of Asia Pacific Medical Headgears Market Revenue, By Application, 2018 – 2023 (USD Million) 496

20.2.24.9.    Rest of Asia Pacific Medical Headgears Market Volume, By Distribution Channel, 2018 – 2023 (Mn Units) 497

20.2.24.10.  Rest of Asia Pacific Medical Headgears Market Revenue, By Distribution Channel, 2018 – 2023 (USD Million) 498

Chapter No. 21 :……… Medical Headgears Market – Latin America.. 499

21.1.    Latin America  499

21.2.    Key Highlights  500

21.2.1.   Latin America Medical Headgears Market Volume, By Country, 2018 – 2023 (Mn Units)  501

21.2.2.   Latin America Medical Headgears Market Revenue, By Country, 2018 – 2023 (USD Million)  502

21.2.3.   Latin America Medical Headgears Market Volume, By End-user, 2018 – 2023 (Mn Units)  503

21.2.4.   Latin America Medical Headgears Market Revenue, By End-user, 2018 – 2023 (USD Million)  504

21.2.5.   Latin America Medical Headgears Market Volume, By Material, 2018 – 2023 (Mn Units)  505

21.2.6.   Latin America Medical Headgears Market Revenue, By Material, 2018 – 2023 (USD Million)  506

21.2.7.   Latin America Medical Headgears Market Volume, By Type, 2018 – 2023 (Mn Units)  507

21.2.8.   Latin America Medical Headgears Market Revenue, By Type, 2018 – 2023 (USD Million)  508

21.2.9.   Latin America Medical Headgears Market Volume, By Application, 2018 – 2023 (Mn Units)  509

21.2.10.              Latin America Medical Headgears Market Revenue, By Application, 2018 – 2023 (USD Million)  510

21.2.11.              Latin America Medical Headgears Market Volume, By Distribution Channel, 2018 – 2023 (Mn Units). 511

21.2.12.              Latin America Medical Headgears Market Revenue, By Distribution Channel, 2018 – 2023 (USD Million). 512

21.2.13.              Brazil 513

21.2.13.1.    Brazil Medical Headgears Market Volume, By End-user, 2018 – 2023 (Mn Units) 513

21.2.13.2.    Brazil Medical Headgears Market Revenue, By End-user, 2018 – 2023 (USD Million) 514

21.2.13.3.    Brazil Medical Headgears Market Volume, By Material, 2018 – 2023 (Mn Units) 515

21.2.13.4.    Brazil Medical Headgears Market Revenue, By Material, 2018 – 2023 (USD Million) 516

21.2.13.5.    Brazil Medical Headgears Market Volume, By Type, 2018 – 2023 (Mn Units) 517

21.2.13.6.    Brazil Medical Headgears Market Revenue, By Type, 2018 – 2023 (USD Million) 518

21.2.13.7.    Brazil Medical Headgears Market Volume, By Application, 2018 – 2023 (Mn Units) 519

21.2.13.8.    Brazil Medical Headgears Market Revenue, By Application, 2018 – 2023 (USD Million) 520

21.2.13.9.    Brazil Medical Headgears Market Volume, By Distribution Channel, 2018 – 2023 (Mn Units) 521

21.2.13.10.  Brazil Medical Headgears Market Revenue, By Distribution Channel, 2018 – 2023 (USD Million) 522

21.2.14.              Argentina. 523

21.2.14.1.    Argentina Medical Headgears Market Volume, By End-user, 2018 – 2023 (Mn Units) 523

21.2.14.2.    Argentina Medical Headgears Market Revenue, By End-user, 2018 – 2023 (USD Million) 524

21.2.14.3.    Argentina Medical Headgears Market Volume, By Material, 2018 – 2023 (Mn Units) 525

21.2.14.4.    Argentina Medical Headgears Market Revenue, By Material, 2018 – 2023 (USD Million) 526

21.2.14.5.    Argentina Medical Headgears Market Volume, By Type, 2018 – 2023 (Mn Units) 527

21.2.14.6.    Argentina Medical Headgears Market Revenue, By Type, 2018 – 2023 (USD Million) 528

21.2.14.7.    Argentina Medical Headgears Market Volume, By Application, 2018 – 2023 (Mn Units) 529

21.2.14.8.    Argentina Medical Headgears Market Revenue, By Application, 2018 – 2023 (USD Million) 530

21.2.14.9.    Argentina Medical Headgears Market Volume, By Distribution Channel, 2018 – 2023 (Mn Units) 531

21.2.14.10.  Argentina Medical Headgears Market Revenue, By Distribution Channel, 2018 – 2023 (USD Million) 532

21.2.15.              Peru. 533

21.2.15.1.    Peru Medical Headgears Market Volume, By End-user, 2018 – 2023 (Mn Units) 533

21.2.15.2.    Peru Medical Headgears Market Revenue, By End-user, 2018 – 2023 (USD Million) 534

21.2.15.3.    Peru Medical Headgears Market Volume, By Material, 2018 – 2023 (Mn Units) 535

21.2.15.4.    Peru Medical Headgears Market Revenue, By Material, 2018 – 2023 (USD Million) 536

21.2.15.5.    Peru Medical Headgears Market Volume, By Type, 2018 – 2023 (Mn Units) 537

21.2.15.6.    Peru Medical Headgears Market Revenue, By Type, 2018 – 2023 (USD Million) 538

21.2.15.7.    Peru Medical Headgears Market Volume, By Application, 2018 – 2023 (Mn Units) 539

21.2.15.8.    Peru Medical Headgears Market Revenue, By Application, 2018 – 2023 (USD Million) 540

21.2.15.9.    Peru Medical Headgears Market Volume, By Distribution Channel, 2018 – 2023 (Mn Units) 541

21.2.15.10.  Peru Medical Headgears Market Revenue, By Distribution Channel, 2018 – 2023 (USD Million) 542

21.2.16.              Chile. 543

21.2.16.1.    Chile Medical Headgears Market Volume, By End-user, 2018 – 2023 (Mn Units) 543

21.2.16.2.    Chile Medical Headgears Market Revenue, By End-user, 2018 – 2023 (USD Million) 544

21.2.16.3.    Chile Medical Headgears Market Volume, By Material, 2018 – 2023 (Mn Units) 545

21.2.16.4.    Chile Medical Headgears Market Revenue, By Material, 2018 – 2023 (USD Million) 546

21.2.16.5.    Chile Medical Headgears Market Volume, By Type, 2018 – 2023 (Mn Units) 547

21.2.16.6.    Chile Medical Headgears Market Revenue, By Type, 2018 – 2023 (USD Million) 548

21.2.16.7.    Chile Medical Headgears Market Volume, By Application, 2018 – 2023 (Mn Units) 549

21.2.16.8.    Chile Medical Headgears Market Revenue, By Application, 2018 – 2023 (USD Million) 550

21.2.16.9.    Chile Medical Headgears Market Volume, By Distribution Channel, 2018 – 2023 (Mn Units) 551

21.2.16.10.  Chile Medical Headgears Market Revenue, By Distribution Channel, 2018 – 2023 (USD Million) 552

21.2.17.              Colombia. 553

21.2.17.1.    Colombia Medical Headgears Market Volume, By End-user, 2018 – 2023 (Mn Units) 553

21.2.17.2.    Colombia Medical Headgears Market Revenue, By End-user, 2018 – 2023 (USD Million) 554

21.2.17.3.    Colombia Medical Headgears Market Volume, By Material, 2018 – 2023 (Mn Units) 555

21.2.17.4.    Colombia Medical Headgears Market Revenue, By Material, 2018 – 2023 (USD Million) 556

21.2.17.5.    Colombia Medical Headgears Market Volume, By Type, 2018 – 2023 (Mn Units) 557

21.2.17.6.    Colombia Medical Headgears Market Revenue, By Type, 2018 – 2023 (USD Million) 558

21.2.17.7.    Colombia Medical Headgears Market Volume, By Application, 2018 – 2023 (Mn Units) 559

21.2.17.8.    Colombia Medical Headgears Market Revenue, By Application, 2018 – 2023 (USD Million) 560

21.2.17.9.    Colombia Medical Headgears Market Volume, By Distribution Channel, 2018 – 2023 (Mn Units) 561

21.2.17.10.  Colombia Medical Headgears Market Revenue, By Distribution Channel, 2018 – 2023 (USD Million) 562

21.2.18.              Rest of Latin America. 563

21.2.18.1.    Rest of Latin America Medical Headgears Market Volume, By End-user, 2018 – 2023 (Mn Units) 563

21.2.18.2.    Rest of Latin America Medical Headgears Market Revenue, By End-user, 2018 – 2023 (USD Million) 564

21.2.18.3.    Rest of Latin America Medical Headgears Market Volume, By Material, 2018 – 2023 (Mn Units) 565

21.2.18.4.    Rest of Latin America Medical Headgears Market Revenue, By Material, 2018 – 2023 (USD Million) 566

21.2.18.5.    Rest of Latin America Medical Headgears Market Volume, By Type, 2018 – 2023 (Mn Units) 567

21.2.18.6.    Rest of Latin America Medical Headgears Market Revenue, By Type, 2018 – 2023 (USD Million) 568

21.2.18.7.    Rest of Latin America Medical Headgears Market Volume, By Application, 2018 – 2023 (Mn Units) 569

21.2.18.8.    Rest of Latin America Medical Headgears Market Revenue, By Application, 2018 – 2023 (USD Million) 570

21.2.18.9.    Rest of Latin America Medical Headgears Market Volume, By Distribution Channel, 2018 – 2023 (Mn Units) 571

21.2.18.10.  Rest of Latin America Medical Headgears Market Revenue, By Distribution Channel, 2018 – 2023 (USD Million) 572

Chapter No. 22 :……… Medical Headgears Market – Middle East. 573

22.1.    The Middle-East. 573

22.2.    Key Highlights  574

22.2.1.   Middle East Medical Headgears Market Volume, By Country, 2018 – 2023 (Mn Units)  575

22.2.2.   Middle East Medical Headgears Market Revenue, By Country, 2018 – 2023 (USD Million)  576

22.2.3.   Middle East Medical Headgears Market Volume, By End-user, 2018 – 2023 (Mn Units)  577

22.2.4.   Middle East Medical Headgears Market Revenue, By End-user, 2018 – 2023 (USD Million)  578

22.2.5.   Middle East Medical Headgears Market Volume, By Material, 2018 – 2023 (Mn Units)  579

22.2.6.   Middle East Medical Headgears Market Revenue, By Material, 2018 – 2023 (USD Million)  580

22.2.7.   Middle East Medical Headgears Market Volume, By Type, 2018 – 2023 (Mn Units). 581

22.2.8.   Middle East Medical Headgears Market Revenue, By Type, 2018 – 2023 (USD Million)  582

22.2.9.   Middle East Medical Headgears Market Volume, By Application, 2018 – 2023 (Mn Units)  583

22.2.10.              Middle East Medical Headgears Market Revenue, By Application, 2018 – 2023 (USD Million)  584

22.2.11.              Middle East Medical Headgears Market Volume, By Distribution Channel, 2018 – 2023 (Mn Units). 585

22.2.12.              Middle East Medical Headgears Market Revenue, By Distribution Channel, 2018 – 2023 (USD Million). 586

22.2.13.              UAE. 587

22.2.13.1.    UAE Medical Headgears Market Volume, By End-user, 2018 – 2023 (Mn Units) 587

22.2.13.2.    UAE Medical Headgears Market Revenue, By End-user, 2018 – 2023 (USD Million) 588

22.2.13.3.    UAE Medical Headgears Market Volume, By Material, 2018 – 2023 (Mn Units) 589

22.2.13.4.    UAE Medical Headgears Market Revenue, By Material, 2018 – 2023 (USD Million) 590

22.2.13.5.    UAE Medical Headgears Market Volume, By Type, 2018 – 2023 (Mn Units) 591

22.2.13.6.    UAE Medical Headgears Market Revenue, By Type, 2018 – 2023 (USD Million) 592

22.2.13.7.    UAE Medical Headgears Market Volume, By Application, 2018 – 2023 (Mn Units) 593

22.2.13.8.    UAE Medical Headgears Market Revenue, By Application, 2018 – 2023 (USD Million) 594

22.2.13.9.    UAE Medical Headgears Market Volume, By Distribution Channel, 2018 – 2023 (Mn Units) 595

22.2.13.10.  UAE Medical Headgears Market Revenue, By Distribution Channel, 2018 – 2023 (USD Million) 596

22.2.14.              KSA.. 597

22.2.14.1.    KSA Medical Headgears Market Volume, By End-user, 2018 – 2023 (Mn Units) 597

22.2.14.2.    KSA Medical Headgears Market Revenue, By End-user, 2018 – 2023 (USD Million) 598

22.2.14.3.    KSA Medical Headgears Market Volume, By Material, 2018 – 2023 (Mn Units) 599

22.2.14.4.    KSA Medical Headgears Market Revenue, By Material, 2018 – 2023 (USD Million) 600

22.2.14.5.    KSA Medical Headgears Market Volume, By Type, 2018 – 2023 (Mn Units) 601

22.2.14.6.    KSA Medical Headgears Market Revenue, By Type, 2018 – 2023 (USD Million) 602

22.2.14.7.    KSA Medical Headgears Market Volume, By Application, 2018 – 2023 (Mn Units) 603

22.2.14.8.    KSA Medical Headgears Market Revenue, By Application, 2018 – 2023 (USD Million) 604

22.2.14.9.    KSA Medical Headgears Market Volume, By Distribution Channel, 2018 – 2023 (Mn Units) 605

22.2.14.10.  KSA Medical Headgears Market Revenue, By Distribution Channel, 2018 – 2023 (USD Million) 606

22.2.15.              Israel 607

22.2.15.1.    Israel Medical Headgears Market Volume, By End-user, 2018 – 2023 (Mn Units) 607

22.2.15.2.    Israel Medical Headgears Market Revenue, By End-user, 2018 – 2023 (USD Million) 608

22.2.15.3.    Israel Medical Headgears Market Volume, By Material, 2018 – 2023 (Mn Units) 609

22.2.15.4.    Israel Medical Headgears Market Revenue, By Material, 2018 – 2023 (USD Million) 610

22.2.15.5.    Israel Medical Headgears Market Volume, By Type, 2018 – 2023 (Mn Units) 611

22.2.15.6.    Israel Medical Headgears Market Revenue, By Type, 2018 – 2023 (USD Million) 612

22.2.15.7.    Israel Medical Headgears Market Volume, By Application, 2018 – 2023 (Mn Units) 613

22.2.15.8.    Israel Medical Headgears Market Revenue, By Application, 2018 – 2023 (USD Million) 614

22.2.15.9.    Israel Medical Headgears Market Volume, By Distribution Channel, 2018 – 2023 (Mn Units) 615

22.2.15.10.  Israel Medical Headgears Market Revenue, By Distribution Channel, 2018 – 2023 (USD Million) 616

22.2.16.              Turkey. 617

22.2.16.1.    Turkey Medical Headgears Market Volume, By End-user, 2018 – 2023 (Mn Units) 617

22.2.16.2.    Turkey Medical Headgears Market Revenue, By End-user, 2018 – 2023 (USD Million) 618

22.2.16.3.    Turkey Medical Headgears Market Volume, By Material, 2018 – 2023 (Mn Units) 619

22.2.16.4.    Turkey Medical Headgears Market Revenue, By Material, 2018 – 2023 (USD Million) 620

22.2.16.5.    Turkey Medical Headgears Market Volume, By Type, 2018 – 2023 (Mn Units) 621

22.2.16.6.    Turkey Medical Headgears Market Revenue, By Type, 2018 – 2023 (USD Million) 622

22.2.16.7.    Turkey Medical Headgears Market Volume, By Application, 2018 – 2023 (Mn Units) 623

22.2.16.8.    Turkey Medical Headgears Market Revenue, By Application, 2018 – 2023 (USD Million) 624

22.2.16.9.    Turkey Medical Headgears Market Volume, By Distribution Channel, 2018 – 2023 (Mn Units) 625

22.2.16.10.  Turkey Medical Headgears Market Revenue, By Distribution Channel, 2018 – 2023 (USD Million) 626

22.2.17.              Iran. 627

22.2.17.1.    Iran Medical Headgears Market Volume, By End-user, 2018 – 2023 (Mn Units) 627

22.2.17.2.    Iran Medical Headgears Market Revenue, By End-user, 2018 – 2023 (USD Million) 628

22.2.17.3.    Iran Medical Headgears Market Volume, By Material, 2018 – 2023 (Mn Units) 629

22.2.17.4.    Iran Medical Headgears Market Revenue, By Material, 2018 – 2023 (USD Million) 630

22.2.17.5.    Iran Medical Headgears Market Volume, By Type, 2018 – 2023 (Mn Units) 631

22.2.17.6.    Iran Medical Headgears Market Revenue, By Type, 2018 – 2023 (USD Million) 632

22.2.17.7.    Iran Medical Headgears Market Volume, By Application, 2018 – 2023 (Mn Units) 633

22.2.17.8.    Iran Medical Headgears Market Revenue, By Application, 2018 – 2023 (USD Million) 634

22.2.17.9.    Iran Medical Headgears Market Volume, By Distribution Channel, 2018 – 2023 (Mn Units) 635

22.2.17.10.  Rest of Middle East Medical Headgears Market Revenue, By Distribution Channel, 2018 – 2023 (USD Million) 636

22.2.18.              Rest of Middle East. 637

22.2.18.1.    Rest of Middle East Medical Headgears Market Volume, By End-user, 2018 – 2023 (Mn Units) 637

22.2.18.2.    Rest of Middle East Medical Headgears Market Revenue, By End-user, 2018 – 2023 (USD Million) 638

22.2.18.3.    Rest of Middle East Medical Headgears Market Volume, By Material, 2018 – 2023 (Mn Units) 639

22.2.18.4.    Rest of Middle East Medical Headgears Market Revenue, By Material, 2018 – 2023 (USD Million) 640

22.2.18.5.    Rest of Middle East Medical Headgears Market Volume, By Type, 2018 – 2023 (Mn Units) 641

22.2.18.6.    Rest of Middle East Medical Headgears Market Revenue, By Type, 2018 – 2023 (USD Million) 642

22.2.18.7.    Rest of Middle East Medical Headgears Market Volume, By Application, 2018 – 2023 (Mn Units) 643

22.2.18.8.    Rest of Middle East Medical Headgears Market Revenue, By Application, 2018 – 2023 (USD Million) 644

22.2.18.9.    Rest of Middle East Medical Headgears Market Volume, By Distribution Channel, 2018 – 2023 (Mn Units) 645

22.2.18.10.  Rest of Middle East Medical Headgears Market Revenue, By Distribution Channel, 2018 – 2023 (USD Million) 646

Chapter No. 23 :……… Medical Headgears Market – Africa.. 647

23.1.    Africa  647

23.2.    Key Highlights  648

23.2.1.   Africa Medical Headgears Market Volume, By Country, 2018 – 2023 (Mn Units). 649

23.2.2.   Africa Medical Headgears Market Revenue, By Country, 2018 – 2023 (USD Million). 650

23.2.3.   Africa Medical Headgears Market Volume, By End-user, 2018 – 2023 (Mn Units). 651

23.2.4.   Africa Medical Headgears Market Revenue, By End-user, 2018 – 2023 (USD Million)  652

23.2.5.   Africa Medical Headgears Market Volume, By Material, 2018 – 2023 (Mn Units). 653

23.2.6.   Africa Medical Headgears Market Revenue, By Material, 2018 – 2023 (USD Million). 654

23.2.7.   Africa Medical Headgears Market Volume, By Type, 2018 – 2023 (Mn Units). 655

23.2.8.   Africa Medical Headgears Market Revenue, By Type, 2018 – 2023 (USD Million). 656

23.2.9.   Africa Medical Headgears Market Volume, By Application, 2018 – 2023 (Mn Units). 657

23.2.10.              Africa Medical Headgears Market Revenue, By Application, 2018 – 2023 (USD Million)  658

23.2.11.              Africa Medical Headgears Market Volume, By Distribution Channel, 2018 – 2023 (Mn Units)  659

23.2.12.              Africa Medical Headgears Market Revenue, By Distribution Channel, 2018 – 2023 (USD Million). 660

23.2.13.              South Africa. 661

23.2.13.1.    South Africa Medical Headgears Market Volume, By End-user, 2018 – 2023 (Mn Units) 661

23.2.13.2.    South Africa Medical Headgears Market Revenue, By End-user, 2018 – 2023 (USD Million) 662

23.2.13.3.    South Africa Medical Headgears Market Volume, By Material, 2018 – 2023 (Mn Units) 663

23.2.13.4.    South Africa Medical Headgears Market Revenue, By Material, 2018 – 2023 (USD Million) 664

23.2.13.5.    South Africa Medical Headgears Market Volume, By Type, 2018 – 2023 (Mn Units) 665

23.2.13.6.    South Africa Medical Headgears Market Revenue, By Type, 2018 – 2023 (USD Million) 666

23.2.13.7.    South Africa Medical Headgears Market Volume, By Application, 2018 – 2023 (Mn Units) 667

23.2.13.8.    South Africa Medical Headgears Market Revenue, By Application, 2018 – 2023 (USD Million) 668

23.2.13.9.    South Africa Medical Headgears Market Volume, By Distribution Channel, 2018 – 2023 (Mn Units) 669

23.2.13.10.  South Africa Medical Headgears Market Revenue, By Distribution Channel, 2018 – 2023 (USD Million) 670

23.2.14.              Egypt. 671

23.2.14.1.    Egypt Medical Headgears Market Volume, By End-user, 2018 – 2023 (Mn Units) 671

23.2.14.2.    Egypt Medical Headgears Market Revenue, By End-user, 2018 – 2023 (USD Million) 672

23.2.14.3.    Egypt Medical Headgears Market Volume, By Material, 2018 – 2023 (Mn Units) 673

23.2.14.4.    Egypt Medical Headgears Market Revenue, By Material, 2018 – 2023 (USD Million) 674

23.2.14.5.    Egypt Medical Headgears Market Volume, By Type, 2018 – 2023 (Mn Units) 675

23.2.14.6.    Egypt Medical Headgears Market Revenue, By Type, 2018 – 2023 (USD Million) 676

23.2.14.7.    Egypt Medical Headgears Market Volume, By Application, 2018 – 2023 (Mn Units) 677

23.2.14.8.    Egypt Medical Headgears Market Revenue, By Application, 2018 – 2023 (USD Million) 678

23.2.14.9.    Egypt Medical Headgears Market Volume, By Distribution Channel, 2018 – 2023 (Mn Units) 679

23.2.14.10.  Egypt Medical Headgears Market Revenue, By Distribution Channel, 2018 – 2023 (USD Million) 680

23.2.15.              Nigeria. 681

23.2.15.1.    Nigeria Medical Headgears Market Volume, By End-user, 2018 – 2023 (Mn Units) 681

23.2.15.2.    Nigeria Medical Headgears Market Revenue, By End-user, 2018 – 2023 (USD Million) 682

23.2.15.3.    Nigeria Medical Headgears Market Volume, By Material, 2018 – 2023 (Mn Units) 683

23.2.15.4.    Nigeria Medical Headgears Market Revenue, By Material, 2018 – 2023 (USD Million) 684

23.2.15.5.    Nigeria Medical Headgears Market Volume, By Type, 2018 – 2023 (Mn Units) 685

23.2.15.6.    Nigeria Medical Headgears Market Revenue, By Type, 2018 – 2023 (USD Million) 686

23.2.15.7.    Nigeria Medical Headgears Market Volume, By Application, 2018 – 2023 (Mn Units) 687

23.2.15.8.    Nigeria Medical Headgears Market Revenue, By Application, 2018 – 2023 (USD Million) 688

23.2.15.9.    Nigeria Medical Headgears Market Volume, By Distribution Channel, 2018 – 2023 (Mn Units) 689

23.2.15.10.  Nigeria Medical Headgears Market Revenue, By Distribution Channel, 2018 – 2023 (USD Million) 690

23.2.16.              Algeria. 691

23.2.16.1.    Algeria Medical Headgears Market Volume, By End-user, 2018 – 2023 (Mn Units) 691

23.2.16.2.    Algeria Medical Headgears Market Revenue, By End-user, 2018 – 2023 (USD Million) 692

23.2.16.3.    Algeria Medical Headgears Market Volume, By Material, 2018 – 2023 (Mn Units) 693

23.2.16.4.    Algeria Medical Headgears Market Revenue, By Material, 2018 – 2023 (USD Million) 694

23.2.16.5.    Algeria Medical Headgears Market Volume, By Type, 2018 – 2023 (Mn Units) 695

23.2.16.6.    Algeria Medical Headgears Market Revenue, By Type, 2018 – 2023 (USD Million) 696

23.2.16.7.    Algeria Medical Headgears Market Volume, By Application, 2018 – 2023 (Mn Units) 697

23.2.16.8.    Algeria Medical Headgears Market Revenue, By Application, 2018 – 2023 (USD Million) 698

23.2.16.9.    Algeria Medical Headgears Market Volume, By Distribution Channel, 2018 – 2023 (Mn Units) 699

23.2.16.10.  Algeria Medical Headgears Market Revenue, By Distribution Channel, 2018 – 2023 (USD Million) 700

23.2.17.              Morocco. 701

23.2.17.1.    Morocco Medical Headgears Market Volume, By End-user, 2018 – 2023 (Mn Units) 701

23.2.17.2.    Morocco Medical Headgears Market Revenue, By End-user, 2018 – 2023 (USD Million) 702

23.2.17.3.    Morocco Medical Headgears Market Volume, By Material, 2018 – 2023 (Mn Units) 703

23.2.17.4.    Morocco Medical Headgears Market Revenue, By Material, 2018 – 2023 (USD Million) 704

23.2.17.5.    Morocco Medical Headgears Market Volume, By Type, 2018 – 2023 (Mn Units) 705

23.2.17.6.    Morocco Medical Headgears Market Revenue, By Type, 2018 – 2023 (USD Million) 706

23.2.17.7.    Morocco Medical Headgears Market Volume, By Application, 2018 – 2023 (Mn Units) 707

23.2.17.8.    Morocco Medical Headgears Market Revenue, By Application, 2018 – 2023 (USD Million) 708

23.2.17.9.    Morocco Medical Headgears Market Volume, By Distribution Channel, 2018 – 2023 (Mn Units) 709

23.2.17.10.  Morocco Medical Headgears Market Revenue, By Distribution Channel, 2018 – 2023 (USD Million) 710

23.2.18.              Rest of Africa. 711

23.2.18.1.    Rest of Africa Medical Headgears Market Volume, By End-user, 2018 – 2023 (Mn Units) 711

23.2.18.2.    Rest of Africa Medical Headgears Market Revenue, By End-user, 2018 – 2023 (USD Million) 712

23.2.18.3.    Rest of Africa Medical Headgears Market Volume, By Material, 2018 – 2023 (Mn Units) 713

23.2.18.4.    Rest of Africa Medical Headgears Market Revenue, By Material, 2018 – 2023 (USD Million) 714

23.2.18.5.    Rest of Africa Medical Headgears Market Volume, By Type, 2018 – 2023 (Mn Units) 715

23.2.18.6.    Rest of Africa Medical Headgears Market Revenue, By Type, 2018 – 2023 (USD Million) 716

23.2.18.7.    Rest of Africa Medical Headgears Market Volume, By Application, 2018 – 2023 (Mn Units) 717

23.2.18.8.    Rest of Africa Medical Headgears Market Revenue, By Application, 2018 – 2023 (USD Million) 718

23.2.18.9.    Rest of Africa Medical Headgears Market Volume, By Distribution Channel, 2018 – 2023 (Mn Units) 719

23.2.18.10.  Rest of Africa Medical Headgears Market Revenue, By Distribution Channel, 2018 – 2023 (USD Million) 720

Chapter No. 24 :……… Company Profiles. 721

24.1.    3M Company  721

24.1.1.   Company Overview.. 721

24.1.2.   Product Portfolio. 722

24.1.3.   Financial Overview.. 722

24.2.    Honeywell International Inc. 723

24.2.1.   Company Overview.. 723

24.2.2.   Product Portfolio. 724

24.2.3.   Financial Overview.. 724

24.3.    Medtronic plc  725

24.3.1.   Company Overview.. 725

24.3.2.   Product Portfolio. 726

24.3.3.   Financial Overview.. 726

24.4.    Johnson & Johnson. 727

24.4.1.   Company Overview.. 727

24.4.2.   Product Portfolio. 728

24.4.3.   Financial Overview.. 728

24.5.    B. Braun Melsungen AG.. 729

24.5.1.   Company Overview.. 729

24.5.2.   Product Portfolio. 730

24.5.3.   Financial Overview.. 730

24.6.    Cardinal Health, Inc. 731

24.6.1.   Company Overview.. 731

24.6.2.   Product Portfolio. 732

24.6.3.   Financial Overview.. 732

24.7.    Sempermed USA, Inc. 733

24.7.1.   Company Overview.. 733

24.7.2.   Product Portfolio. 734

24.7.3.   Financial Overview.. 734

24.8.    Ansell Limited   735

24.8.1.   Company Overview.. 735

24.8.2.   Product Portfolio. 736

24.8.3.   Financial Overview.. 736

24.9.    Philips NV   737

24.9.1.   Company Overview.. 737

24.9.2.   Product Portfolio. 738

24.9.3.   Financial Overview.. 738

24.10.  DeRoyal Industries, Inc. 739

24.10.1.              Company Overview.. 739

24.10.2.              Product Portfolio. 740

24.10.3.              Financial Overview.. 740

24.11.  Stryker Corporation. 741

24.11.1.              Company Overview.. 741

24.11.2.              Product Portfolio. 742

24.11.3.              Financial Overview.. 742

24.12.  Key Surgical 743

24.12.1.              Company Overview.. 743

24.12.2.              Product Portfolio. 743

24.12.3.              Financial Overview.. 744

24.13.  Louis M. Gerson Co., Inc. 745

24.13.1.              Company Overview.. 745

24.13.2.              Product Portfolio. 746

24.13.3.              Financial Overview.. 746

24.14.  Owens & Minor, Inc. 747

24.14.1.              Company Overview.. 747

24.14.2.              Product Portfolio. 748

24.14.3.              Financial Overview.. 748

24.15.  Zimmer Biomet. 749

24.15.1.              Company Overview.. 749

24.15.2.              Product Portfolio. 750

24.15.3.              Financial Overview.. 750

Chapter No. 25 :……… Research Methodology. 751

25.1.    Research Methodology. 751

25.2.    Phase I – Secondary Research. 752

25.3.    Phase II – Data Modeling. 752

25.3.1.   Company Share Analysis Model 753

25.3.2.   Revenue Based Modeling. 753

25.4.    Phase III – Primary Research. 754

25.5.    Research Limitations. 755

25.5.1.   Assumptions. 755


List of Figures

FIG NO. 1……….. Global Medical Headgears Market Volume & Revenue, 2018 – 2032 (Mn Units) (USD Million) 58

FIG NO. 2……….. Porter’s Five Forces Analysis for Global Medical Headgears Market 66

FIG NO. 3……….. Value Chain Analysis for Global Medical Headgears Market 68

FIG NO. 4……….. Global Medical Headgears Market Import Volume/Revenue, By Region, 2018 – 2023. 71

FIG NO. 5……….. Global Medical Headgears Market Export Volume/Revenue, By Region, 2018 – 2023. 72

FIG NO. 6……….. Global Medical Headgears Market Demand Volume/Revenue, By Region, 2018 – 2023. 73

FIG NO. 7……….. Global Medical Headgears Market Supply Volume/Revenue, By Region, 2018 – 2023. 74

FIG NO. 8……….. Global Medical Headgears Market Production, By Region, 2018 – 2023. 75

FIG NO. 9……….. Manufacturing Cost Analysis. 78

FIG NO. 10……… Company Share Analysis, 2023. 83

FIG NO. 11……… Company Share Analysis, 2023. 84

FIG NO. 12……… Company Share Analysis, 2023. 85

FIG NO. 13……… Company Share Analysis, 2023. 86

FIG NO. 14……… Medical Headgears Market – Company Volume  Market Share, 2023. 87

FIG NO. 15……… Medical Headgears Market – Company Revenue Market Share, 2023. 88

FIG NO. 16……… Company Assessment Metrics, 2023. 89

FIG NO. 17……… Medical Headgears Market Volume Share, By Type, 2023 & 2032. 93

FIG NO. 18……… Medical Headgears Market Revenue Share, By Type, 2023 & 2032. 94

FIG NO. 19……… Market Attractiveness Analysis, By Type. 95

FIG NO. 20……… Incremental Revenue Growth Opportunity by Type, 2024 – 2032. 96

FIG NO. 21……… Medical Headgears Market Revenue, By Type, 2018, 2023, 2027 & 2032. 97

FIG NO. 22……… Global Medical Headgears Market for Surgical Caps, Volume & Revenue (Mn Units) (USD Million) 2018 – 2032  98

FIG NO. 23……… Global Medical Headgears Market for Patient Positioning, Volume & Revenue (Mn Units) (USD Million) 2018 – 2032. 99

FIG NO. 24……… Global Medical Headgears Market for Respiratory Masks, Volume & Revenue (Mn Units) (USD Million) 2018 – 2032. 100

FIG NO. 25……… Global Medical Headgears Market for Hearing Protection, Volume & Revenue (Mn Units) (USD Million) 2018 – 2032. 101

FIG NO. 26……… Global Medical Headgears Market for Protective Helmets, Volume & Revenue (Mn Units) (USD Million) 2018 – 2032. 102

FIG NO. 27……… Medical Headgears Market Volume Share, By Application, 2023 & 2032. 103

FIG NO. 28……… Medical Headgears Market Revenue Share, By Application, 2023 & 2032. 104

FIG NO. 29……… Market Attractiveness Analysis, By Application. 105

FIG NO. 30……… Incremental Revenue Growth Opportunity by Application, 2024 – 2032. 106

FIG NO. 31……… Medical Headgears Market Revenue, By Application, 2018, 2023, 2027 & 2032. 107

FIG NO. 32……… Global Medical Headgears Market for Hospitals and Clinics, Volume & Revenue (Mn Units) (USD Million) 2018 – 2032. 108

FIG NO. 33……… Global Medical Headgears Market for Ambulatory Surgical Centers, Volume & Revenue (Mn Units) (USD Million) 2018 – 2032. 109

FIG NO. 34……… Global Medical Headgears Market for Diagnostic Centers, Volume & Revenue (Mn Units) (USD Million) 2018 – 2032. 110

FIG NO. 35……… Global Medical Headgears Market for Homecare Settings, Volume & Revenue (Mn Units) (USD Million) 2018 – 2032. 111

FIG NO. 36……… Global Medical Headgears Market for Others, Volume & Revenue (Mn Units) (USD Million) 2018 – 2032  112

FIG NO. 37……… Medical Headgears Market Volume Share, By End-user, 2023 & 2032. 113

FIG NO. 38……… Medical Headgears Market Revenue Share, By End-user, 2023 & 2032. 114

FIG NO. 39……… Market Attractiveness Analysis, By End-user. 115

FIG NO. 40……… Incremental Revenue Growth Opportunity by End-user, 2024 – 2032. 116

FIG NO. 41……… Medical Headgears Market Revenue, By End-user, 2018, 2023, 2027 & 2032. 117

FIG NO. 42……… Global Medical Headgears Market for Healthcare Professionals, Volume & Revenue (Mn Units) (USD Million) 2018 – 2032. 118

FIG NO. 43……… Global Medical Headgears Market for Patients, Volume & Revenue (Mn Units) (USD Million) 2018 – 2032  119

FIG NO. 44……… Medical Headgears Market Volume Share, By Material, 2023 & 2032. 120

FIG NO. 45……… Medical Headgears Market Revenue Share, By Material, 2023 & 2032. 121

FIG NO. 46……… Market Attractiveness Analysis, By Material 122

FIG NO. 47……… Incremental Revenue Growth Opportunity by Material, 2024 – 2032. 123

FIG NO. 48……… Medical Headgears Market Revenue, By Material, 2018, 2023, 2027 & 2032. 124

FIG NO. 49……… Global Medical Headgears Market for Fabric-based, Volume & Revenue (Mn Units) (USD Million) 2018 – 2032  125

FIG NO. 50……… Global Medical Headgears Market for Plastic-based, Volume & Revenue (Mn Units) (USD Million) 2018 – 2032  126

FIG NO. 51……… Global Medical Headgears Market for Metal-based, Volume & Revenue (Mn Units) (USD Million) 2018 – 2032  127

FIG NO. 52……… Medical Headgears Market Volume Share, By Distribution Channel, 2023 & 2032. 128

FIG NO. 53……… Medical Headgears Market Revenue Share, By Distribution Channel, 2023 & 2032. 129

FIG NO. 54……… Market Attractiveness Analysis, By Distribution Channel 130

FIG NO. 55……… Incremental Revenue Growth Opportunity by Distribution Channel, 2024 – 2032. 131

FIG NO. 56……… Medical Headgears Market Revenue, By Distribution Channel, 2018, 2023, 2027 & 2032. 132

FIG NO. 57……… Global Medical Headgears Market for Direct Sales, Volume & Revenue (Mn Units) (USD Million) 2018 – 2032  133

FIG NO. 58……… Global Medical Headgears Market for Distributors, Volume & Revenue (Mn Units) (USD Million) 2018 – 2032  134

FIG NO. 59……… Global Medical Headgears Market Volume Share, By Region, 2023 & 2032. 135

FIG NO. 60……… Global Medical Headgears Market Revenue Share, By Region, 2023 & 2032. 136

FIG NO. 61……… Market Attractiveness Analysis, By Region. 137

FIG NO. 62……… Incremental Revenue Growth Opportunity by Region, 2024 – 2032. 138

FIG NO. 63……… Medical Headgears Market Revenue, By Region, 2018, 2023, 2027 & 2032. 139

FIG NO. 64……… North America Medical Headgears Market Volume & Revenue, 2018 – 2032 (Mn Units) (USD Million) 142

FIG NO. 65……… Europe Medical Headgears Market Volume & Revenue, 2018 – 2023 (Mn Units) (USD Million) 186

FIG NO. 66……… Asia Pacific Medical Headgears Market Volume & Revenue, 2018 – 2023 (Mn Units) (USD Million) 340

FIG NO. 67……… Latin America Medical Headgears Market Volume & Revenue, 2018 – 2023 (Mn Units) (USD Million) 474

FIG NO. 68……… The Middle-East Medical Headgears Market Volume & Revenue, 2018 – 2023 (Mn Units) (USD Million) 548

FIG NO. 69……… Africa Medical Headgears Market Volume & Revenue, 2018 – 2023 (Mn Units) (USD Million) 622

FIG NO. 70……… Research Methodology – Detailed View.. 726

FIG NO. 71……… Research Methodology. 727


List of Tables

TABLE NO. 1. :…. Global Medical Headgears Market: Snapshot 82

TABLE NO. 2. :…. Drivers for the Medical Headgears Market: Impact Analysis. 88

TABLE NO. 3. :…. Restraints for the Medical Headgears Market: Impact Analysis. 90

TABLE NO. 4. :…. Global Medical Headgears Market Volume & Revenue, By Region, 2018 – 2023 (Mn Units) 101

TABLE NO. 5. :…. Global Medical Headgears Market Volume & Revenue, By Region, 2018 – 2023 (USD/Unit) 102

TABLE NO. 6. :…. Global Medical Headgears Market Volume & Revenue, By Type, 2018 – 2023 (USD/Unit) 103

TABLE NO. 7. :…. Global Medical Headgears Market Volume, By Region, 2018 – 2023 (Mn Units) 166

TABLE NO. 8. :…. Global Medical Headgears Market Region, 2024 – 2032 (Mn Units) 166

TABLE NO. 9. :…. Global Medical Headgears Market Revenue, By Region, 2018 – 2023 (USD Million) 167

TABLE NO. 10. :.. Global Medical Headgears Market Revenue, By Region, 2024 – 2032 (USD Million) 167

TABLE NO. 11. :.. North America Medical Headgears Market Volume, By Country, 2018 – 2023 (Mn Units) 170

TABLE NO. 12. :.. North America Medical Headgears Market Volume, By Country, 2024 – 2032 (Mn Units) 170

TABLE NO. 13. :.. North America Medical Headgears Market Revenue, By Country, 2018 – 2023 (USD Million) 171

TABLE NO. 14. :.. North America Medical Headgears Market Revenue, By Country, 2024 – 2032 (USD Million) 171

TABLE NO. 15. :.. North America Medical Headgears Market Volume, By End-user, 2018 – 2023 (Mn Units) 172

TABLE NO. 16. :.. North America Medical Headgears Market Volume, By End-user, 2024 – 2032 (Mn Units) 172

TABLE NO. 17. :.. North America Medical Headgears Market Revenue, By End-user, 2018 – 2023 (USD Million) 173

TABLE NO. 18. :.. North America Medical Headgears Market Revenue, By End-user, 2024 – 2032 (USD Million) 173

TABLE NO. 19. :.. North America Medical Headgears Market Volume, By Material, 2018 – 2023 (Mn Units) 174

TABLE NO. 20. :.. North America Medical Headgears Market Volume, By Material, 2024 – 2032 (Mn Units) 174

TABLE NO. 21. :.. North America Medical Headgears Market Revenue, By Material, 2018 – 2023 (USD Million) 175

TABLE NO. 22. :.. North America Medical Headgears Market Revenue, By Material, 2024 – 2032 (USD Million) 175

TABLE NO. 23. :.. North America Medical Headgears Market Volume, By Type, 2018 – 2023 (Mn Units) 176

TABLE NO. 24. :.. North America Medical Headgears Market Volume, By Type, 2024 – 2032 (Mn Units) 176

TABLE NO. 25. :.. North America Medical Headgears Market Revenue, By Type, 2018 – 2023 (USD Million) 177

TABLE NO. 26. :.. North America Medical Headgears Market Revenue, By Type, 2024 – 2032 (USD Million) 177

TABLE NO. 27. :.. North America Medical Headgears Market Volume, By Application, 2018 – 2023 (Mn Units) 178

TABLE NO. 28. :.. North America Medical Headgears Market Volume, By Application, 2024 – 2032 (Mn Units) 178

TABLE NO. 29. :.. North America Medical Headgears Market Revenue, By Application, 2018 – 2023 (USD Million) 179

TABLE NO. 30. :.. North America Medical Headgears Market Revenue, By Application, 2024 – 2032 (USD Million) 179

TABLE NO. 31. :.. North America Medical Headgears Market Volume, By Distribution Channel, 2018 – 2023 (Mn Units) 180

TABLE NO. 32. :.. North America Medical Headgears Market Volume, By Distribution Channel, 2024 – 2032 (Mn Units) 180

TABLE NO. 33. :.. North America Medical Headgears Market Revenue, By Distribution Channel, 2018 – 2023 (USD Million) 181

TABLE NO. 34. :.. North America Medical Headgears Market Revenue, By Distribution Channel, 2024 – 2032 (USD Million) 181

TABLE NO. 35. :.. U.S. Medical Headgears Market Volume, By End-user, 2018 – 2023 (Mn Units) 182

TABLE NO. 36. :.. U.S. Medical Headgears Market Volume, By End-user, 2024 – 2032 (Mn Units) 182

TABLE NO. 37. :.. U.S. Medical Headgears Market Revenue, By End-user, 2018 – 2023 (USD Million) 183

TABLE NO. 38. :.. U.S. Medical Headgears Market Revenue, By End-user, 2024 – 2032 (USD Million) 183

TABLE NO. 39. :.. U.S. Medical Headgears Market Volume, By Material, 2018 – 2023 (Mn Units) 184

TABLE NO. 40. :.. U.S. Medical Headgears Market Volume, By Material, 2024 – 2032 (Mn Units) 184

TABLE NO. 41. :.. U.S. Medical Headgears Market Revenue, By Material, 2018 – 2023 (USD Million) 185

TABLE NO. 42. :.. U.S. Medical Headgears Market Revenue, By Material, 2024 – 2032 (USD Million) 185

TABLE NO. 43. :.. U.S. Medical Headgears Market Volume, By Type, 2018 – 2023 (Mn Units) 186

TABLE NO. 44. :.. U.S. Medical Headgears Market Volume, By Type, 2024 – 2032 (Mn Units) 186

TABLE NO. 45. :.. U.S. Medical Headgears Market Revenue, By Type, 2018 – 2023 (USD Million) 187

TABLE NO. 46. :.. U.S. Medical Headgears Market Revenue, By Type, 2024 – 2032 (USD Million) 187

TABLE NO. 47. :.. U.S. Medical Headgears Market Volume, By Application, 2018 – 2023 (Mn Units) 188

TABLE NO. 48. :.. U.S. Medical Headgears Market Volume, By Application, 2024 – 2032 (Mn Units) 188

TABLE NO. 49. :.. U.S. Medical Headgears Market Revenue, By Application, 2018 – 2023 (USD Million) 189

TABLE NO. 50. :.. U.S. Medical Headgears Market Revenue, By Application, 2024 – 2032 (USD Million) 189

TABLE NO. 51. :.. U.S. Medical Headgears Market Volume, By Distribution Channel, 2018 – 2023 (Mn Units) 190

TABLE NO. 52. :.. U.S. Medical Headgears Market Volume, By Distribution Channel, 2024 – 2032 (Mn Units) 190

TABLE NO. 53. :.. U.S. Medical Headgears Market Revenue, By Distribution Channel, 2018 – 2023 (USD Million) 191

TABLE NO. 54. :.. U.S. Medical Headgears Market Revenue, By Distribution Channel, 2024 – 2032 (USD Million) 191

TABLE NO. 55. :.. Canada Medical Headgears Market Volume, By End-user, 2018 – 2023 (Mn Units) 192

TABLE NO. 56. :.. Canada Medical Headgears Market Volume, By End-user, 2024 – 2032 (Mn Units) 192

TABLE NO. 57. :.. Canada Medical Headgears Market Revenue, By End-user, 2018 – 2023 (USD Million) 193

TABLE NO. 58. :.. Canada Medical Headgears Market Revenue, By End-user, 2024 – 2032 (USD Million) 193

TABLE NO. 59. :.. Canada Medical Headgears Market Volume, By Material, 2018 – 2023 (Mn Units) 194

TABLE NO. 60. :.. Canada Medical Headgears Market Volume, By Material, 2024 – 2032 (Mn Units) 194

TABLE NO. 61. :.. Canada Medical Headgears Market Revenue, By Material, 2018 – 2023 (USD Million) 195

TABLE NO. 62. :.. Canada Medical Headgears Market Revenue, By Material, 2024 – 2032 (USD Million) 195

TABLE NO. 63. :.. Canada Medical Headgears Market Volume, By Type, 2018 – 2023 (Mn Units) 196

TABLE NO. 64. :.. Canada Medical Headgears Market Volume, By Type, 2024 – 2032 (Mn Units) 196

TABLE NO. 65. :.. Canada Medical Headgears Market Revenue, By Type, 2018 – 2023 (USD Million) 197

TABLE NO. 66. :.. Canada Medical Headgears Market Revenue, By Type, 2024 – 2032 (USD Million) 197

TABLE NO. 67. :.. Canada Medical Headgears Market Volume, By Application, 2018 – 2023 (Mn Units) 198

TABLE NO. 68. :.. Canada Medical Headgears Market Volume, By Application, 2024 – 2032 (Mn Units) 198

TABLE NO. 69. :.. Canada Medical Headgears Market Revenue, By Application, 2018 – 2023 (USD Million) 199

TABLE NO. 70. :.. Canada Medical Headgears Market Revenue, By Application, 2024 – 2032 (USD Million) 199

TABLE NO. 71. :.. Canada Medical Headgears Market Volume, By Distribution Channel, 2018 – 2023 (Mn Units) 200

TABLE NO. 72. :.. Canada Medical Headgears Market Volume, By Distribution Channel, 2024 – 2032 (Mn Units) 200

TABLE NO. 73. :.. Canada Medical Headgears Market Revenue, By Distribution Channel, 2018 – 2023 (USD Million) 201

TABLE NO. 74. :.. Canada Medical Headgears Market Revenue, By Distribution Channel, 2024 – 2032 (USD Million) 201

TABLE NO. 75. :.. Mexico Medical Headgears Market Volume, By End-user, 2018 – 2023 (Mn Units) 202

TABLE NO. 76. :.. Mexico Medical Headgears Market Volume, By End-user, 2024 – 2032 (Mn Units) 202

TABLE NO. 77. :.. Mexico Medical Headgears Market Revenue, By End-user, 2018 – 2023 (USD Million) 203

TABLE NO. 78. :.. Mexico Medical Headgears Market Revenue, By End-user, 2024 – 2032 (USD Million) 203

TABLE NO. 79. :.. Mexico Medical Headgears Market Volume, By Material, 2018 – 2023 (Mn Units) 204

TABLE NO. 80. :.. Mexico Medical Headgears Market Volume, By Material, 2024 – 2032 (Mn Units) 204

TABLE NO. 81. :.. Mexico Medical Headgears Market Revenue, By Material, 2018 – 2023 (USD Million) 205

TABLE NO. 82. :.. Mexico Medical Headgears Market Revenue, By Material, 2024 – 2032 (USD Million) 205

TABLE NO. 83. :.. Mexico Medical Headgears Market Volume, By Type, 2018 – 2023 (Mn Units) 206

TABLE NO. 84. :.. Mexico Medical Headgears Market Volume, By Type, 2024 – 2032 (Mn Units) 206

TABLE NO. 85. :.. Mexico Medical Headgears Market Revenue, By Type, 2018 – 2023 (USD Million) 207

TABLE NO. 86. :.. Mexico Medical Headgears Market Revenue, By Type, 2024 – 2032 (USD Million) 207

TABLE NO. 87. :.. Mexico Medical Headgears Market Volume, By Application, 2018 – 2023 (Mn Units) 208

TABLE NO. 88. :.. Mexico Medical Headgears Market Volume, By Application, 2024 – 2032 (Mn Units) 208

TABLE NO. 89. :.. Mexico Medical Headgears Market Revenue, By Application, 2018 – 2023 (USD Million) 209

TABLE NO. 90. :.. Mexico Medical Headgears Market Revenue, By Application, 2024 – 2032 (USD Million) 209

TABLE NO. 91. :.. Mexico Medical Headgears Market Volume, By Distribution Channel, 2018 – 2023 (Mn Units) 210

TABLE NO. 92. :.. Mexico Medical Headgears Market Volume, By Distribution Channel, 2024 – 2032 (Mn Units) 210

TABLE NO. 93. :.. Mexico Medical Headgears Market Revenue, By Distribution Channel, 2018 – 2023 (USD Million) 211

TABLE NO. 94. :.. Mexico Medical Headgears Market Revenue, By Distribution Channel, 2024 – 2032 (USD Million) 211

TABLE NO. 95. :.. Europe Medical Headgears Market Volume, By Country, 2018 – 2023 (Mn Units) 214

TABLE NO. 96. :.. Europe Medical Headgears Market Volume, By Country, 2024 – 2032 (Mn Units) 214

TABLE NO. 97. :.. Europe Medical Headgears Market Revenue, By Country, 2018 – 2023 (USD Million) 215

TABLE NO. 98. :.. Europe Medical Headgears Market Revenue, By Country, 2024 – 2032 (USD Million) 215

TABLE NO. 99. :.. Europe Medical Headgears Market Volume, By End-user, 2018 – 2023 (Mn Units) 216

TABLE NO. 100. :. Europe Medical Headgears Market Volume, By End-user, 2024 – 2032 (Mn Units) 216

TABLE NO. 101. :. Europe Medical Headgears Market Revenue, By End-user, 2018 – 2023 (USD Million) 217

TABLE NO. 102. :. Europe Medical Headgears Market Revenue, By End-user, 2024 – 2032 (USD Million) 217

TABLE NO. 103. :. Europe Medical Headgears Market Volume, By Material, 2018 – 2023 (Mn Units) 218

TABLE NO. 104. :. Europe Medical Headgears Market Volume, By Material, 2024 – 2032 (Mn Units) 218

TABLE NO. 105. :. Europe Medical Headgears Market Revenue, By Material, 2018 – 2023 (USD Million) 219

TABLE NO. 106. :. Europe Medical Headgears Market Revenue, By Material, 2024 – 2032 (USD Million) 219

TABLE NO. 107. :. Europe Medical Headgears Market Volume, By Type, 2018 – 2023 (Mn Units) 220

TABLE NO. 108. :. Europe Medical Headgears Market Volume, By Type, 2024 – 2032 (Mn Units) 220

TABLE NO. 109. :. Europe Medical Headgears Market Revenue, By Type, 2018 – 2023 (USD Million) 221

TABLE NO. 110. :. Europe Medical Headgears Market Revenue, By Type, 2024 – 2032 (USD Million) 221

TABLE NO. 111. :. Europe Medical Headgears Market Volume, By Application, 2018 – 2023 (Mn Units) 222

TABLE NO. 112. :. Europe Medical Headgears Market Volume, By Application, 2024 – 2032 (Mn Units) 222

TABLE NO. 113. :. Europe Medical Headgears Market Revenue, By Application, 2018 – 2023 (USD Million) 223

TABLE NO. 114. :. Europe Medical Headgears Market Revenue, By Application, 2024 – 2032 (USD Million) 223

TABLE NO. 115. :. Europe Medical Headgears Market Volume, By Distribution Channel, 2018 – 2023 (Mn Units) 224

TABLE NO. 116. :. Europe Medical Headgears Market Volume, By Distribution Channel, 2024 – 2032 (Mn Units) 224

TABLE NO. 117. :. Europe Medical Headgears Market Revenue, By Distribution Channel, 2018 – 2023 (USD Million) 225

TABLE NO. 118. :. Europe Medical Headgears Market Revenue, By Distribution Channel, 2024 – 2032 (USD Million) 225

TABLE NO. 119. :. UK Medical Headgears Market Volume, By End-user, 2018 – 2023 (Mn Units) 226

TABLE NO. 120. :. UK Medical Headgears Market Volume, By End-user, 2024 – 2032 (Mn Units) 226

TABLE NO. 121. :. UK Medical Headgears Market Revenue, By End-user, 2018 – 2023 (USD Million) 227

TABLE NO. 122. :. UK Medical Headgears Market Revenue, By End-user, 2024 – 2032 (USD Million) 227

TABLE NO. 123. :. UK Medical Headgears Market Volume, By Material, 2018 – 2023 (Mn Units) 228

TABLE NO. 124. :. UK Medical Headgears Market Volume, By Material, 2024 – 2032 (Mn Units) 228

TABLE NO. 125. :. UK Medical Headgears Market Revenue, By Material, 2018 – 2023 (USD Million) 229

TABLE NO. 126. :. UK Medical Headgears Market Revenue, By Material, 2024 – 2032 (USD Million) 229

TABLE NO. 127. :. UK Medical Headgears Market Volume, By Type, 2018 – 2023 (Mn Units) 230

TABLE NO. 128. :. UK Medical Headgears Market Volume, By Type, 2024 – 2032 (Mn Units) 230

TABLE NO. 129. :. UK Medical Headgears Market Revenue, By Type, 2018 – 2023 (USD Million) 231

TABLE NO. 130. :. UK Medical Headgears Market Revenue, By Type, 2024 – 2032 (USD Million) 231

TABLE NO. 131. :. UK Medical Headgears Market Volume, By Application, 2018 – 2023 (Mn Units) 232

TABLE NO. 132. :. UK Medical Headgears Market Volume, By Application, 2024 – 2032 (Mn Units) 232

TABLE NO. 133. :. UK Medical Headgears Market Revenue, By Application, 2018 – 2023 (USD Million) 233

TABLE NO. 134. :. UK Medical Headgears Market Revenue, By Application, 2024 – 2032 (USD Million) 233

TABLE NO. 135. :. UK Medical Headgears Market Volume, By Distribution Channel, 2018 – 2023 (Mn Units) 234

TABLE NO. 136. :. UK Medical Headgears Market Volume, By Distribution Channel, 2024 – 2032 (Mn Units) 234

TABLE NO. 137. :. UK Medical Headgears Market Revenue, By Distribution Channel, 2018 – 2023 (USD Million) 235

TABLE NO. 138. :. UK Medical Headgears Market Revenue, By Distribution Channel, 2024 – 2032 (USD Million) 235

TABLE NO. 139. :. France Medical Headgears Market Volume, By End-user, 2018 – 2023 (Mn Units) 236

TABLE NO. 140. :. France Medical Headgears Market Volume, By End-user, 2024 – 2032 (Mn Units) 236

TABLE NO. 141. :. France Medical Headgears Market Revenue, By End-user, 2018 – 2023 (USD Million) 237

TABLE NO. 142. :. France Medical Headgears Market Revenue, By End-user, 2024 – 2032 (USD Million) 237

TABLE NO. 143. :. France Medical Headgears Market Volume, By Material, 2018 – 2023 (Mn Units) 238

TABLE NO. 144. :. France Medical Headgears Market Volume, By Material, 2024 – 2032 (Mn Units) 238

TABLE NO. 145. :. France Medical Headgears Market Revenue, By Material, 2018 – 2023 (USD Million) 239

TABLE NO. 146. :. France Medical Headgears Market Revenue, By Material, 2024 – 2032 (USD Million) 239

TABLE NO. 147. :. France Medical Headgears Market Volume, By Type, 2018 – 2023 (Mn Units) 240

TABLE NO. 148. :. France Medical Headgears Market Volume, By Type, 2024 – 2032 (Mn Units) 240

TABLE NO. 149. :. France Medical Headgears Market Revenue, By Type, 2018 – 2023 (USD Million) 241

TABLE NO. 150. :. France Medical Headgears Market Revenue, By Type, 2024 – 2032 (USD Million) 241

TABLE NO. 151. :. France Medical Headgears Market Volume, By Application, 2018 – 2023 (Mn Units) 242

TABLE NO. 152. :. France Medical Headgears Market Volume, By Application, 2024 – 2032 (Mn Units) 242

TABLE NO. 153. :. France Medical Headgears Market Revenue, By Application, 2018 – 2023 (USD Million) 243

TABLE NO. 154. :. France Medical Headgears Market Revenue, By Application, 2024 – 2032 (USD Million) 243

TABLE NO. 155. :. France Medical Headgears Market Volume, By Distribution Channel, 2018 – 2023 (Mn Units) 244

TABLE NO. 156. :. France Medical Headgears Market Volume, By Distribution Channel, 2024 – 2032 (Mn Units) 244

TABLE NO. 157. :. France Medical Headgears Market Revenue, By Distribution Channel, 2018 – 2023 (USD Million) 245

TABLE NO. 158. :. France Medical Headgears Market Revenue, By Distribution Channel, 2024 – 2032 (USD Million) 245

TABLE NO. 159. :. Germany Medical Headgears Market Volume, By End-user, 2018 – 2023 (Mn Units) 246

TABLE NO. 160. :. Germany Medical Headgears Market Volume, By End-user, 2024 – 2032 (Mn Units) 246

TABLE NO. 161. :. Germany Medical Headgears Market Revenue, By End-user, 2018 – 2023 (USD Million) 247

TABLE NO. 162. :. Germany Medical Headgears Market Revenue, By End-user, 2024 – 2032 (USD Million) 247

TABLE NO. 163. :. Germany Medical Headgears Market Volume, By Material, 2018 – 2023 (Mn Units) 248

TABLE NO. 164. :. Germany Medical Headgears Market Volume, By Material, 2024 – 2032 (Mn Units) 248

TABLE NO. 165. :. Germany Medical Headgears Market Revenue, By Material, 2018 – 2023 (USD Million) 249

TABLE NO. 166. :. Germany Medical Headgears Market Revenue, By Material, 2024 – 2032 (USD Million) 249

TABLE NO. 167. :. Germany Medical Headgears Market Volume, By Type, 2018 – 2023 (Mn Units) 250

TABLE NO. 168. :. Germany Medical Headgears Market Volume, By Type, 2024 – 2032 (Mn Units) 250

TABLE NO. 169. :. Germany Medical Headgears Market Revenue, By Type, 2018 – 2023 (USD Million) 251

TABLE NO. 170. :. Germany Medical Headgears Market Revenue, By Type, 2024 – 2032 (USD Million) 251

TABLE NO. 171. :. Germany Medical Headgears Market Volume, By Application, 2018 – 2023 (Mn Units) 252

TABLE NO. 172. :. Germany Medical Headgears Market Volume, By Application, 2024 – 2032 (Mn Units) 252

TABLE NO. 173. :. Germany Medical Headgears Market Revenue, By Application, 2018 – 2023 (USD Million) 253

TABLE NO. 174. :. Germany Medical Headgears Market Revenue, By Application, 2024 – 2032 (USD Million) 253

TABLE NO. 175. :. Germany Medical Headgears Market Volume, By Distribution Channel, 2018 – 2023 (Mn Units) 254

TABLE NO. 176. :. Germany Medical Headgears Market Volume, By Distribution Channel, 2024 – 2032 (Mn Units) 254

TABLE NO. 177. :. Germany Medical Headgears Market Revenue, By Distribution Channel, 2018 – 2023 (USD Million) 255

TABLE NO. 178. :. Germany Medical Headgears Market Revenue, By Distribution Channel, 2024 – 2032 (USD Million) 255

TABLE NO. 179. :. Italy Medical Headgears Market Volume, By End-user, 2018 – 2023 (Mn Units) 256

TABLE NO. 180. :. Italy Medical Headgears Market Volume, By End-user, 2024 – 2032 (Mn Units) 256

TABLE NO. 181. :. Italy Medical Headgears Market Revenue, By End-user, 2018 – 2023 (USD Million) 257

TABLE NO. 182. :. Italy Medical Headgears Market Revenue, By End-user, 2024 – 2032 (USD Million) 257

TABLE NO. 183. :. Italy Medical Headgears Market Volume, By Material, 2018 – 2023 (Mn Units) 258

TABLE NO. 184. :. Italy Medical Headgears Market Volume, By Material, 2024 – 2032 (Mn Units) 258

TABLE NO. 185. :. Italy Medical Headgears Market Revenue, By Material, 2018 – 2023 (USD Million) 259

TABLE NO. 186. :. Italy Medical Headgears Market Revenue, By Material, 2024 – 2032 (USD Million) 259

TABLE NO. 187. :. Italy Medical Headgears Market Volume, By Type, 2018 – 2023 (Mn Units) 260

TABLE NO. 188. :. Italy Medical Headgears Market Volume, By Type, 2024 – 2032 (Mn Units) 260

TABLE NO. 189. :. Italy Medical Headgears Market Revenue, By Type, 2018 – 2023 (USD Million) 261

TABLE NO. 190. :. Italy Medical Headgears Market Revenue, By Type, 2024 – 2032 (USD Million) 261

TABLE NO. 191. :. Italy Medical Headgears Market Volume, By Application, 2018 – 2023 (Mn Units) 262

TABLE NO. 192. :. Italy Medical Headgears Market Volume, By Application, 2024 – 2032 (Mn Units) 262

TABLE NO. 193. :. Italy Medical Headgears Market Revenue, By Application, 2018 – 2023 (USD Million) 263

TABLE NO. 194. :. Italy Medical Headgears Market Revenue, By Application, 2024 – 2032 (USD Million) 263

TABLE NO. 195. :. Italy Medical Headgears Market Volume, By Distribution Channel, 2018 – 2023 (Mn Units) 264

TABLE NO. 196. :. Italy Medical Headgears Market Volume, By Distribution Channel, 2024 – 2032 (Mn Units) 264

TABLE NO. 197. :. Italy Medical Headgears Market Revenue, By Distribution Channel, 2018 – 2023 (USD Million) 265

TABLE NO. 198. :. Italy Medical Headgears Market Revenue, By Distribution Channel, 2024 – 2032 (USD Million) 265

TABLE NO. 199. :. Spain Medical Headgears Market Volume, By End-user, 2018 – 2023 (Mn Units) 266

TABLE NO. 200. :. Spain Medical Headgears Market Volume, By End-user, 2024 – 2032 (Mn Units) 266

TABLE NO. 201. :. Spain Medical Headgears Market Revenue, By End-user, 2018 – 2023 (USD Million) 267

TABLE NO. 202. :. Spain Medical Headgears Market Revenue, By End-user, 2024 – 2032 (USD Million) 267

TABLE NO. 203. :. Spain Medical Headgears Market Volume, By Material, 2018 – 2023 (Mn Units) 268

TABLE NO. 204. :. Spain Medical Headgears Market Volume, By Material, 2024 – 2032 (Mn Units) 268

TABLE NO. 205. :. Spain Medical Headgears Market Revenue, By Material, 2018 – 2023 (USD Million) 269

TABLE NO. 206. :. Spain Medical Headgears Market Revenue, By Material, 2024 – 2032 (USD Million) 269

TABLE NO. 207. :. Spain Medical Headgears Market Volume, By Type, 2018 – 2023 (Mn Units) 270

TABLE NO. 208. :. Spain Medical Headgears Market Volume, By Type, 2024 – 2032 (Mn Units) 270

TABLE NO. 209. :. Spain Medical Headgears Market Revenue, By Type, 2018 – 2023 (USD Million) 271

TABLE NO. 210. :. Spain Medical Headgears Market Revenue, By Type, 2024 – 2032 (USD Million) 271

TABLE NO. 211. :. Spain Medical Headgears Market Volume, By Application, 2018 – 2023 (Mn Units) 272

TABLE NO. 212. :. Spain Medical Headgears Market Volume, By Application, 2024 – 2032 (Mn Units) 272

TABLE NO. 213. :. Spain Medical Headgears Market Revenue, By Application, 2018 – 2023 (USD Million) 273

TABLE NO. 214. :. Spain Medical Headgears Market Revenue, By Application, 2024 – 2032 (USD Million) 273

TABLE NO. 215. :. Spain Medical Headgears Market Volume, By Distribution Channel, 2018 – 2023 (Mn Units) 274

TABLE NO. 216. :. Spain Medical Headgears Market Volume, By Distribution Channel, 2024 – 2032 (Mn Units) 274

TABLE NO. 217. :. Spain Medical Headgears Market Revenue, By Distribution Channel, 2018 – 2023 (USD Million) 275

TABLE NO. 218. :. Spain Medical Headgears Market Revenue, By Distribution Channel, 2024 – 2032 (USD Million) 275

TABLE NO. 219. :. Russia Medical Headgears Market Volume, By End-user, 2018 – 2023 (Mn Units) 276

TABLE NO. 220. :. Russia Medical Headgears Market Volume, By End-user, 2024 – 2032 (Mn Units) 276

TABLE NO. 221. :. Russia Medical Headgears Market Revenue, By End-user, 2018 – 2023 (USD Million) 277

TABLE NO. 222. :. Russia Medical Headgears Market Revenue, By End-user, 2024 – 2032 (USD Million) 277

TABLE NO. 223. :. Russia Medical Headgears Market Volume, By Material, 2018 – 2023 (Mn Units) 278

TABLE NO. 224. :. Russia Medical Headgears Market Volume, By Material, 2024 – 2032 (Mn Units) 278

TABLE NO. 225. :. Russia Medical Headgears Market Revenue, By Material, 2018 – 2023 (USD Million) 279

TABLE NO. 226. :. Russia Medical Headgears Market Revenue, By Material, 2024 – 2032 (USD Million) 279

TABLE NO. 227. :. Russia Medical Headgears Market Volume, By Type, 2018 – 2023 (Mn Units) 280

TABLE NO. 228. :. Russia Medical Headgears Market Volume, By Type, 2024 – 2032 (Mn Units) 280

TABLE NO. 229. :. Russia Medical Headgears Market Revenue, By Type, 2018 – 2023 (USD Million) 281

TABLE NO. 230. :. Russia Medical Headgears Market Revenue, By Type, 2024 – 2032 (USD Million) 281

TABLE NO. 231. :. Russia Medical Headgears Market Volume, By Application, 2018 – 2023 (Mn Units) 282

TABLE NO. 232. :. Russia Medical Headgears Market Volume, By Application, 2024 – 2032 (Mn Units) 282

TABLE NO. 233. :. Russia Medical Headgears Market Revenue, By Application, 2018 – 2023 (USD Million) 283

TABLE NO. 234. :. Russia Medical Headgears Market Revenue, By Application, 2024 – 2032 (USD Million) 283

TABLE NO. 235. :. Russia Medical Headgears Market Volume, By Distribution Channel, 2018 – 2023 (Mn Units) 284

TABLE NO. 236. :. Russia Medical Headgears Market Volume, By Distribution Channel, 2024 – 2032 (Mn Units) 284

TABLE NO. 237. :. Russia Medical Headgears Market Revenue, By Distribution Channel, 2018 – 2023 (USD Million) 285

TABLE NO. 238. :. Russia Medical Headgears Market Revenue, By Distribution Channel, 2024 – 2032 (USD Million) 285

TABLE NO. 239. :. Belgium Medical Headgears Market Volume, By End-user, 2018 – 2023 (Mn Units) 286

TABLE NO. 240. :. Belgium Medical Headgears Market Volume, By End-user, 2024 – 2032 (Mn Units) 286

TABLE NO. 241. :. Belgium Medical Headgears Market Revenue, By End-user, 2018 – 2023 (USD Million) 287

TABLE NO. 242. :. Belgium Medical Headgears Market Revenue, By End-user, 2024 – 2032 (USD Million) 287

TABLE NO. 243. :. Belgium Medical Headgears Market Volume, By Material, 2018 – 2023 (Mn Units) 288

TABLE NO. 244. :. Belgium Medical Headgears Market Volume, By Material, 2024 – 2032 (Mn Units) 288

TABLE NO. 245. :. Belgium Medical Headgears Market Revenue, By Material, 2018 – 2023 (USD Million) 289

TABLE NO. 246. :. Belgium Medical Headgears Market Revenue, By Material, 2024 – 2032 (USD Million) 289

TABLE NO. 247. :. Belgium Medical Headgears Market Volume, By Type, 2018 – 2023 (Mn Units) 290

TABLE NO. 248. :. Belgium Medical Headgears Market Volume, By Type, 2024 – 2032 (Mn Units) 290

TABLE NO. 249. :. Belgium Medical Headgears Market Revenue, By Type, 2018 – 2023 (USD Million) 291

TABLE NO. 250. :. Belgium Medical Headgears Market Revenue, By Type, 2024 – 2032 (USD Million) 291

TABLE NO. 251. :. Belgium Medical Headgears Market Volume, By Application, 2018 – 2023 (Mn Units) 292

TABLE NO. 252. :. Belgium Medical Headgears Market Volume, By Application, 2024 – 2032 (Mn Units) 292

TABLE NO. 253. :. Belgium Medical Headgears Market Revenue, By Application, 2018 – 2023 (USD Million) 293

TABLE NO. 254. :. Belgium Medical Headgears Market Revenue, By Application, 2024 – 2032 (USD Million) 293

TABLE NO. 255. :. Belgium Medical Headgears Market Volume, By Distribution Channel, 2018 – 2023 (Mn Units) 294

TABLE NO. 256. :. Belgium Medical Headgears Market Volume, By Distribution Channel, 2024 – 2032 (Mn Units) 294

TABLE NO. 257. :. Belgium Medical Headgears Market Revenue, By Distribution Channel, 2018 – 2023 (USD Million) 295

TABLE NO. 258. :. Belgium Medical Headgears Market Revenue, By Distribution Channel, 2024 – 2032 (USD Million) 295

TABLE NO. 259. :. Netherland Medical Headgears Market Volume, By End-user, 2018 – 2023 (Mn Units) 296

TABLE NO. 260. :. Netherland Medical Headgears Market Volume, By End-user, 2024 – 2032 (Mn Units) 296

TABLE NO. 261. :. Netherland Medical Headgears Market Revenue, By End-user, 2018 – 2023 (USD Million) 297

TABLE NO. 262. :. Netherland Medical Headgears Market Revenue, By End-user, 2024 – 2032 (USD Million) 297

TABLE NO. 263. :. Netherland Medical Headgears Market Volume, By Material, 2018 – 2023 (Mn Units) 298

TABLE NO. 264. :. Netherland Medical Headgears Market Volume, By Material, 2024 – 2032 (Mn Units) 298

TABLE NO. 265. :. Netherland Medical Headgears Market Revenue, By Material, 2018 – 2023 (USD Million) 299

TABLE NO. 266. :. Netherland Medical Headgears Market Revenue, By Material, 2024 – 2032 (USD Million) 299

TABLE NO. 267. :. Netherland Medical Headgears Market Volume, By Type, 2018 – 2023 (Mn Units) 300

TABLE NO. 268. :. Netherland Medical Headgears Market Volume, By Type, 2024 – 2032 (Mn Units) 300

TABLE NO. 269. :. Netherland Medical Headgears Market Revenue, By Type, 2018 – 2023 (USD Million) 301

TABLE NO. 270. :. Netherland Medical Headgears Market Revenue, By Type, 2024 – 2032 (USD Million) 301

TABLE NO. 271. :. Netherland Medical Headgears Market Volume, By Application, 2018 – 2023 (Mn Units) 302

TABLE NO. 272. :. Netherland Medical Headgears Market Volume, By Application, 2024 – 2032 (Mn Units) 302

TABLE NO. 273. :. Netherland Medical Headgears Market Revenue, By Application, 2018 – 2023 (USD Million) 303

TABLE NO. 274. :. Netherland Medical Headgears Market Revenue, By Application, 2024 – 2032 (USD Million) 303

TABLE NO. 275. :. Netherland Medical Headgears Market Volume, By Distribution Channel, 2018 – 2023 (Mn Units) 304

TABLE NO. 276. :. Netherland Medical Headgears Market Volume, By Distribution Channel, 2024 – 2032 (Mn Units) 304

TABLE NO. 277. :. Netherland Medical Headgears Market Revenue, By Distribution Channel, 2018 – 2023 (USD Million) 305

TABLE NO. 278. :. Netherland Medical Headgears Market Revenue, By Distribution Channel, 2024 – 2032 (USD Million) 305

TABLE NO. 279. :. Austria Medical Headgears Market Volume, By End-user, 2018 – 2023 (Mn Units) 306

TABLE NO. 280. :. Austria Medical Headgears Market Volume, By End-user, 2024 – 2032 (Mn Units) 306

TABLE NO. 281. :. Austria Medical Headgears Market Revenue, By End-user, 2018 – 2023 (USD Million) 307

TABLE NO. 282. :. Austria Medical Headgears Market Revenue, By End-user, 2024 – 2032 (USD Million) 307

TABLE NO. 283. :. Austria Medical Headgears Market Volume, By Material, 2018 – 2023 (Mn Units) 308

TABLE NO. 284. :. Austria Medical Headgears Market Volume, By Material, 2024 – 2032 (Mn Units) 308

TABLE NO. 285. :. Austria Medical Headgears Market Revenue, By Material, 2018 – 2023 (USD Million) 309

TABLE NO. 286. :. Austria Medical Headgears Market Revenue, By Material, 2024 – 2032 (USD Million) 309

TABLE NO. 287. :. Austria Medical Headgears Market Volume, By Type, 2018 – 2023 (Mn Units) 310

TABLE NO. 288. :. Austria Medical Headgears Market Volume, By Type, 2024 – 2032 (Mn Units) 310

TABLE NO. 289. :. Austria Medical Headgears Market Revenue, By Type, 2018 – 2023 (USD Million) 311

TABLE NO. 290. :. Austria Medical Headgears Market Revenue, By Type, 2024 – 2032 (USD Million) 311

TABLE NO. 291. :. Austria Medical Headgears Market Volume, By Application, 2018 – 2023 (Mn Units) 312

TABLE NO. 292. :. Austria Medical Headgears Market Volume, By Application, 2024 – 2032 (Mn Units) 312

TABLE NO. 293. :. Austria Medical Headgears Market Revenue, By Application, 2018 – 2023 (USD Million) 313

TABLE NO. 294. :. Austria Medical Headgears Market Revenue, By Application, 2024 – 2032 (USD Million) 313

TABLE NO. 295. :. Austria Medical Headgears Market Volume, By Distribution Channel, 2018 – 2023 (Mn Units) 314

TABLE NO. 296. :. Austria Medical Headgears Market Volume, By Distribution Channel, 2024 – 2032 (Mn Units) 314

TABLE NO. 297. :. Austria Medical Headgears Market Revenue, By Distribution Channel, 2018 – 2023 (USD Million) 315

TABLE NO. 298. :. Austria Medical Headgears Market Revenue, By Distribution Channel, 2024 – 2032 (USD Million) 315

TABLE NO. 299. :. Sweden Medical Headgears Market Volume, By End-user, 2018 – 2023 (Mn Units) 316

TABLE NO. 300. :. Sweden Medical Headgears Market Volume, By End-user, 2024 – 2032 (Mn Units) 316

TABLE NO. 301. :. Sweden Medical Headgears Market Revenue, By End-user, 2018 – 2023 (USD Million) 317

TABLE NO. 302. :. Sweden Medical Headgears Market Revenue, By End-user, 2024 – 2032 (USD Million) 317

TABLE NO. 303. :. Sweden Medical Headgears Market Volume, By Material, 2018 – 2023 (Mn Units) 318

TABLE NO. 304. :. Sweden Medical Headgears Market Volume, By Material, 2024 – 2032 (Mn Units) 318

TABLE NO. 305. :. Sweden Medical Headgears Market Revenue, By Material, 2018 – 2023 (USD Million) 319

TABLE NO. 306. :. Sweden Medical Headgears Market Revenue, By Material, 2024 – 2032 (USD Million) 319

TABLE NO. 307. :. Sweden Medical Headgears Market Volume, By Type, 2018 – 2023 (Mn Units) 320

TABLE NO. 308. :. Sweden Medical Headgears Market Volume, By Type, 2024 – 2032 (Mn Units) 320

TABLE NO. 309. :. Sweden Medical Headgears Market Revenue, By Type, 2018 – 2023 (USD Million) 321

TABLE NO. 310. :. Sweden Medical Headgears Market Revenue, By Type, 2024 – 2032 (USD Million) 321

TABLE NO. 311. :. Sweden Medical Headgears Market Volume, By Application, 2018 – 2023 (Mn Units) 322

TABLE NO. 312. :. Sweden Medical Headgears Market Volume, By Application, 2024 – 2032 (Mn Units) 322

TABLE NO. 313. :. Sweden Medical Headgears Market Revenue, By Application, 2018 – 2023 (USD Million) 323

TABLE NO. 314. :. Sweden Medical Headgears Market Revenue, By Application, 2024 – 2032 (USD Million) 323

TABLE NO. 315. :. Sweden Medical Headgears Market Volume, By Distribution Channel, 2018 – 2023 (Mn Units) 324

TABLE NO. 316. :. Sweden Medical Headgears Market Volume, By Distribution Channel, 2024 – 2032 (Mn Units) 324

TABLE NO. 317. :. Sweden Medical Headgears Market Revenue, By Distribution Channel, 2018 – 2023 (USD Million) 325

TABLE NO. 318. :. Sweden Medical Headgears Market Revenue, By Distribution Channel, 2024 – 2032 (USD Million) 325

TABLE NO. 319. :. Poland Medical Headgears Market Volume, By End-user, 2018 – 2023 (Mn Units) 326

TABLE NO. 320. :. Poland Medical Headgears Market Volume, By End-user, 2024 – 2032 (Mn Units) 326

TABLE NO. 321. :. Poland Medical Headgears Market Revenue, By End-user, 2018 – 2023 (USD Million) 327

TABLE NO. 322. :. Poland Medical Headgears Market Revenue, By End-user, 2024 – 2032 (USD Million) 327

TABLE NO. 323. :. Poland Medical Headgears Market Volume, By Material, 2018 – 2023 (Mn Units) 328

TABLE NO. 324. :. Poland Medical Headgears Market Volume, By Material, 2024 – 2032 (Mn Units) 328

TABLE NO. 325. :. Poland Medical Headgears Market Revenue, By Material, 2018 – 2023 (USD Million) 329

TABLE NO. 326. :. Poland Medical Headgears Market Revenue, By Material, 2024 – 2032 (USD Million) 329

TABLE NO. 327. :. Poland Medical Headgears Market Volume, By Type, 2018 – 2023 (Mn Units) 330

TABLE NO. 328. :. Poland Medical Headgears Market Volume, By Type, 2024 – 2032 (Mn Units) 330

TABLE NO. 329. :. Poland Medical Headgears Market Revenue, By Type, 2018 – 2023 (USD Million) 331

TABLE NO. 330. :. Poland Medical Headgears Market Revenue, By Type, 2024 – 2032 (USD Million) 331

TABLE NO. 331. :. Poland Medical Headgears Market Volume, By Application, 2018 – 2023 (Mn Units) 332

TABLE NO. 332. :. Poland Medical Headgears Market Volume, By Application, 2024 – 2032 (Mn Units) 332

TABLE NO. 333. :. Poland Medical Headgears Market Revenue, By Application, 2018 – 2023 (USD Million) 333

TABLE NO. 334. :. Poland Medical Headgears Market Revenue, By Application, 2024 – 2032 (USD Million) 333

TABLE NO. 335. :. Poland Medical Headgears Market Volume, By Distribution Channel, 2018 – 2023 (Mn Units) 334

TABLE NO. 336. :. Poland Medical Headgears Market Volume, By Distribution Channel, 2024 – 2032 (Mn Units) 334

TABLE NO. 337. :. Poland Medical Headgears Market Revenue, By Distribution Channel, 2018 – 2023 (USD Million) 335

TABLE NO. 338. :. Poland Medical Headgears Market Revenue, By Distribution Channel, 2024 – 2032 (USD Million) 335

TABLE NO. 339. :. Denmark Medical Headgears Market Volume, By End-user, 2018 – 2023 (Mn Units) 336

TABLE NO. 340. :. Denmark Medical Headgears Market Volume, By End-user, 2024 – 2032 (Mn Units) 336

TABLE NO. 341. :. Denmark Medical Headgears Market Revenue, By End-user, 2018 – 2023 (USD Million) 337

TABLE NO. 342. :. Denmark Medical Headgears Market Revenue, By End-user, 2024 – 2032 (USD Million) 337

TABLE NO. 343. :. Denmark Medical Headgears Market Volume, By Material, 2018 – 2023 (Mn Units) 338

TABLE NO. 344. :. Denmark Medical Headgears Market Volume, By Material, 2024 – 2032 (Mn Units) 338

TABLE NO. 345. :. Denmark Medical Headgears Market Revenue, By Material, 2018 – 2023 (USD Million) 339

TABLE NO. 346. :. Denmark Medical Headgears Market Revenue, By Material, 2024 – 2032 (USD Million) 339

TABLE NO. 347. :. Denmark Medical Headgears Market Volume, By Type, 2018 – 2023 (Mn Units) 340

TABLE NO. 348. :. Denmark Medical Headgears Market Volume, By Type, 2024 – 2032 (Mn Units) 340

TABLE NO. 349. :. Denmark Medical Headgears Market Revenue, By Type, 2018 – 2023 (USD Million) 341

TABLE NO. 350. :. Denmark Medical Headgears Market Revenue, By Type, 2024 – 2032 (USD Million) 341

TABLE NO. 351. :. Denmark Medical Headgears Market Volume, By Application, 2018 – 2023 (Mn Units) 342

TABLE NO. 352. :. Denmark Medical Headgears Market Volume, By Application, 2024 – 2032 (Mn Units) 342

TABLE NO. 353. :. Denmark Medical Headgears Market Revenue, By Application, 2018 – 2023 (USD Million) 343

TABLE NO. 354. :. Denmark Medical Headgears Market Revenue, By Application, 2024 – 2032 (USD Million) 343

TABLE NO. 355. :. Denmark Medical Headgears Market Volume, By Distribution Channel, 2018 – 2023 (Mn Units) 344

TABLE NO. 356. :. Denmark Medical Headgears Market Volume, By Distribution Channel, 2024 – 2032 (Mn Units) 344

TABLE NO. 357. :. Denmark Medical Headgears Market Revenue, By Distribution Channel, 2018 – 2023 (USD Million) 345

TABLE NO. 358. :. Denmark Medical Headgears Market Revenue, By Distribution Channel, 2024 – 2032 (USD Million) 345

TABLE NO. 359. :. Switzerland Medical Headgears Market Volume, By End-user, 2018 – 2023 (Mn Units) 346

TABLE NO. 360. :. Switzerland Medical Headgears Market Volume, By End-user, 2024 – 2032 (Mn Units) 346

TABLE NO. 361. :. Switzerland Medical Headgears Market Revenue, By End-user, 2018 – 2023 (USD Million) 347

TABLE NO. 362. :. Switzerland Medical Headgears Market Revenue, By End-user, 2024 – 2032 (USD Million) 347

TABLE NO. 363. :. Switzerland Medical Headgears Market Volume, By Material, 2018 – 2023 (Mn Units) 348

TABLE NO. 364. :. Switzerland Medical Headgears Market Volume, By Material, 2024 – 2032 (Mn Units) 348

TABLE NO. 365. :. Switzerland Medical Headgears Market Revenue, By Material, 2018 – 2023 (USD Million) 349

TABLE NO. 366. :. Switzerland Medical Headgears Market Revenue, By Material, 2024 – 2032 (USD Million) 349

TABLE NO. 367. :. Switzerland Medical Headgears Market Volume, By Type, 2018 – 2023 (Mn Units) 350

TABLE NO. 368. :. Switzerland Medical Headgears Market Volume, By Type, 2024 – 2032 (Mn Units) 350

TABLE NO. 369. :. Switzerland Medical Headgears Market Revenue, By Type, 2018 – 2023 (USD Million) 351

TABLE NO. 370. :. Switzerland Medical Headgears Market Revenue, By Type, 2024 – 2032 (USD Million) 351

TABLE NO. 371. :. Switzerland Medical Headgears Market Volume, By Application, 2018 – 2023 (Mn Units) 352

TABLE NO. 372. :. Switzerland Medical Headgears Market Volume, By Application, 2024 – 2032 (Mn Units) 352

TABLE NO. 373. :. Switzerland Medical Headgears Market Revenue, By Application, 2018 – 2023 (USD Million) 353

TABLE NO. 374. :. Switzerland Medical Headgears Market Revenue, By Application, 2024 – 2032 (USD Million) 353

TABLE NO. 375. :. Switzerland Medical Headgears Market Volume, By Distribution Channel, 2018 – 2023 (Mn Units) 354

TABLE NO. 376. :. Switzerland Medical Headgears Market Volume, By Distribution Channel, 2024 – 2032 (Mn Units) 354

TABLE NO. 377. :. Switzerland Medical Headgears Market Revenue, By Distribution Channel, 2018 – 2023 (USD Million) 355

TABLE NO. 378. :. Switzerland Medical Headgears Market Revenue, By Distribution Channel, 2024 – 2032 (USD Million) 355

TABLE NO. 379. :. Rest of Europe Medical Headgears Market Volume, By End-user, 2018 – 2023 (Mn Units) 356

TABLE NO. 380. :. Rest of Europe Medical Headgears Market Volume, By End-user, 2024 – 2032 (Mn Units) 356

TABLE NO. 381. :. Rest of Europe Medical Headgears Market Revenue, By End-user, 2018 – 2023 (USD Million) 357

TABLE NO. 382. :. Rest of Europe Medical Headgears Market Revenue, By End-user, 2024 – 2032 (USD Million) 357

TABLE NO. 383. :. Rest of Europe Medical Headgears Market Volume, By Material, 2018 – 2023 (Mn Units) 358

TABLE NO. 384. :. Rest of Europe Medical Headgears Market Volume, By Material, 2024 – 2032 (Mn Units) 358

TABLE NO. 385. :. Rest of Europe Medical Headgears Market Revenue, By Material, 2018 – 2023 (USD Million) 359

TABLE NO. 386. :. Rest of Europe Medical Headgears Market Revenue, By Material, 2024 – 2032 (USD Million) 359

TABLE NO. 387. :. Rest of Europe Medical Headgears Market Volume, By Type, 2018 – 2023 (Mn Units) 360

TABLE NO. 388. :. Rest of Europe Medical Headgears Market Volume, By Type, 2024 – 2032 (Mn Units) 360

TABLE NO. 389. :. Rest of Europe Medical Headgears Market Revenue, By Type, 2018 – 2023 (USD Million) 361

TABLE NO. 390. :. Rest of Europe Medical Headgears Market Revenue, By Type, 2024 – 2032 (USD Million) 361

TABLE NO. 391. :. Rest of Europe Medical Headgears Market Volume, By Application, 2018 – 2023 (Mn Units) 362

TABLE NO. 392. :. Rest of Europe Medical Headgears Market Volume, By Application, 2024 – 2032 (Mn Units) 362

TABLE NO. 393. :. Rest of Europe Medical Headgears Market Revenue, By Application, 2018 – 2023 (USD Million) 363

TABLE NO. 394. :. Rest of Europe Medical Headgears Market Revenue, By Application, 2024 – 2032 (USD Million) 363

TABLE NO. 395. :. Rest of Europe Medical Headgears Market Volume, By Distribution Channel, 2018 – 2023 (Mn Units) 364

TABLE NO. 396. :. Rest of Europe Medical Headgears Market Volume, By Distribution Channel, 2024 – 2032 (Mn Units) 364

TABLE NO. 397. :. Rest of Europe Medical Headgears Market Revenue, By Distribution Channel, 2018 – 2023 (USD Million) 365

TABLE NO. 398. :. Rest of Europe Medical Headgears Market Revenue, By Distribution Channel, 2024 – 2032 (USD Million) 365

TABLE NO. 399. :. Asia Pacific Medical Headgears Market Volume, By Country, 2018 – 2023 (Mn Units) 368

TABLE NO. 400. :. Asia Pacific Medical Headgears Market Volume, By Country, 2024 – 2032 (Mn Units) 368

TABLE NO. 401. :. Asia Pacific Medical Headgears Market Revenue, By Country, 2018 – 2023 (USD Million) 369

TABLE NO. 402. :. Asia Pacific Medical Headgears Market Revenue, By Country, 2024 – 2032 (USD Million) 369

TABLE NO. 403. :. Asia Pacific Medical Headgears Market Volume, By End-user, 2018 – 2023 (Mn Units) 370

TABLE NO. 404. :. Asia Pacific Medical Headgears Market Volume, By End-user, 2024 – 2032 (Mn Units) 370

TABLE NO. 405. :. Asia Pacific Medical Headgears Market Revenue, By End-user, 2018 – 2023 (USD Million) 371

TABLE NO. 406. :. Asia Pacific Medical Headgears Market Revenue, By End-user, 2024 – 2032 (USD Million) 371

TABLE NO. 407. :. Asia Pacific Medical Headgears Market Volume, By Material, 2018 – 2023 (Mn Units) 372

TABLE NO. 408. :. Asia Pacific Medical Headgears Market Volume, By Material, 2024 – 2032 (Mn Units) 372

TABLE NO. 409. :. Asia Pacific Medical Headgears Market Revenue, By Material, 2018 – 2023 (USD Million) 373

TABLE NO. 410. :. Asia Pacific Medical Headgears Market Revenue, By Material, 2024 – 2032 (USD Million) 373

TABLE NO. 411. :. Asia Pacific Medical Headgears Market Volume, By Type, 2018 – 2023 (Mn Units) 374

TABLE NO. 412. :. Asia Pacific Medical Headgears Market Volume, By Type, 2024 – 2032 (Mn Units) 374

TABLE NO. 413. :. Asia Pacific Medical Headgears Market Revenue, By Type, 2018 – 2023 (USD Million) 375

TABLE NO. 414. :. Asia Pacific Medical Headgears Market Revenue, By Type, 2024 – 2032 (USD Million) 375

TABLE NO. 415. :. Asia Pacific Medical Headgears Market Volume, By Application, 2018 – 2023 (Mn Units) 376

TABLE NO. 416. :. Asia Pacific Medical Headgears Market Volume, By Application, 2024 – 2032 (Mn Units) 376

TABLE NO. 417. :. Asia Pacific Medical Headgears Market Revenue, By Application, 2018 – 2023 (USD Million) 377

TABLE NO. 418. :. Asia Pacific Medical Headgears Market Revenue, By Application, 2024 – 2032 (USD Million) 377

TABLE NO. 419. :. Asia Pacific Medical Headgears Market Volume, By Distribution Channel, 2018 – 2023 (Mn Units) 378

TABLE NO. 420. :. Asia Pacific Medical Headgears Market Volume, By Distribution Channel, 2024 – 2032 (Mn Units) 378

TABLE NO. 421. :. Asia Pacific Medical Headgears Market Revenue, By Distribution Channel, 2018 – 2023 (USD Million) 379

TABLE NO. 422. :. Asia Pacific Medical Headgears Market Revenue, By Distribution Channel, 2024 – 2032 (USD Million) 379

TABLE NO. 423. :. China Medical Headgears Market Volume, By End-user, 2018 – 2023 (Mn Units) 380

TABLE NO. 424. :. China Medical Headgears Market Volume, By End-user, 2024 – 2032 (Mn Units) 380

TABLE NO. 425. :. China Medical Headgears Market Revenue, By End-user, 2018 – 2023 (USD Million) 381

TABLE NO. 426. :. China Medical Headgears Market Revenue, By End-user, 2024 – 2032 (USD Million) 381

TABLE NO. 427. :. China Medical Headgears Market Volume, By Material, 2018 – 2023 (Mn Units) 382

TABLE NO. 428. :. China Medical Headgears Market Volume, By Material, 2024 – 2032 (Mn Units) 382

TABLE NO. 429. :. China Medical Headgears Market Revenue, By Material, 2018 – 2023 (USD Million) 383

TABLE NO. 430. :. China Medical Headgears Market Revenue, By Material, 2024 – 2032 (USD Million) 383

TABLE NO. 431. :. China Medical Headgears Market Volume, By Type, 2018 – 2023 (Mn Units) 384

TABLE NO. 432. :. China Medical Headgears Market Volume, By Type, 2024 – 2032 (Mn Units) 384

TABLE NO. 433. :. China Medical Headgears Market Revenue, By Type, 2018 – 2023 (USD Million) 385

TABLE NO. 434. :. China Medical Headgears Market Revenue, By Type, 2024 – 2032 (USD Million) 385

TABLE NO. 435. :. China Medical Headgears Market Volume, By Application, 2018 – 2023 (Mn Units) 386

TABLE NO. 436. :. China Medical Headgears Market Volume, By Application, 2024 – 2032 (Mn Units) 386

TABLE NO. 437. :. China Medical Headgears Market Revenue, By Application, 2018 – 2023 (USD Million) 387

TABLE NO. 438. :. China Medical Headgears Market Revenue, By Application, 2024 – 2032 (USD Million) 387

TABLE NO. 439. :. China Medical Headgears Market Volume, By Distribution Channel, 2018 – 2023 (Mn Units) 388

TABLE NO. 440. :. China Medical Headgears Market Volume, By Distribution Channel, 2024 – 2032 (Mn Units) 388

TABLE NO. 441. :. China Medical Headgears Market Revenue, By Distribution Channel, 2018 – 2023 (USD Million) 389

TABLE NO. 442. :. China Medical Headgears Market Revenue, By Distribution Channel, 2024 – 2032 (USD Million) 389

TABLE NO. 443. :. Japan Medical Headgears Market Volume, By End-user, 2018 – 2023 (Mn Units) 390

TABLE NO. 444. :. Japan Medical Headgears Market Volume, By End-user, 2024 – 2032 (Mn Units) 390

TABLE NO. 445. :. Japan Medical Headgears Market Revenue, By End-user, 2018 – 2023 (USD Million) 391

TABLE NO. 446. :. Japan Medical Headgears Market Revenue, By End-user, 2024 – 2032 (USD Million) 391

TABLE NO. 447. :. Japan Medical Headgears Market Volume, By Material, 2018 – 2023 (Mn Units) 392

TABLE NO. 448. :. Japan Medical Headgears Market Volume, By Material, 2024 – 2032 (Mn Units) 392

TABLE NO. 449. :. Japan Medical Headgears Market Revenue, By Material, 2018 – 2023 (USD Million) 393

TABLE NO. 450. :. Japan Medical Headgears Market Revenue, By Material, 2024 – 2032 (USD Million) 393

TABLE NO. 451. :. Japan Medical Headgears Market Volume, By Type, 2018 – 2023 (Mn Units) 394

TABLE NO. 452. :. Japan Medical Headgears Market Volume, By Type, 2024 – 2032 (Mn Units) 394

TABLE NO. 453. :. Japan Medical Headgears Market Revenue, By Type, 2018 – 2023 (USD Million) 395

TABLE NO. 454. :. Japan Medical Headgears Market Revenue, By Type, 2024 – 2032 (USD Million) 395

TABLE NO. 455. :. Japan Medical Headgears Market Volume, By Application, 2018 – 2023 (Mn Units) 396

TABLE NO. 456. :. Japan Medical Headgears Market Volume, By Application, 2024 – 2032 (Mn Units) 396

TABLE NO. 457. :. Japan Medical Headgears Market Revenue, By Application, 2018 – 2023 (USD Million) 397

TABLE NO. 458. :. Japan Medical Headgears Market Revenue, By Application, 2024 – 2032 (USD Million) 397

TABLE NO. 459. :. Japan Medical Headgears Market Volume, By Distribution Channel, 2018 – 2023 (Mn Units) 398

TABLE NO. 460. :. Japan Medical Headgears Market Volume, By Distribution Channel, 2024 – 2032 (Mn Units) 398

TABLE NO. 461. :. Japan Medical Headgears Market Revenue, By Distribution Channel, 2018 – 2023 (USD Million) 399

TABLE NO. 462. :. Japan Medical Headgears Market Revenue, By Distribution Channel, 2024 – 2032 (USD Million) 399

TABLE NO. 463. :. South Korea Medical Headgears Market Volume, By End-user, 2018 – 2023 (Mn Units) 400

TABLE NO. 464. :. South Korea Medical Headgears Market Volume, By End-user, 2024 – 2032 (Mn Units) 400

TABLE NO. 465. :. South Korea Medical Headgears Market Revenue, By End-user, 2018 – 2023 (USD Million) 401

TABLE NO. 466. :. South Korea Medical Headgears Market Revenue, By End-user, 2024 – 2032 (USD Million) 401

TABLE NO. 467. :. South Korea Medical Headgears Market Volume, By Material, 2018 – 2023 (Mn Units) 402

TABLE NO. 468. :. South Korea Medical Headgears Market Volume, By Material, 2024 – 2032 (Mn Units) 402

TABLE NO. 469. :. South Korea Medical Headgears Market Revenue, By Material, 2018 – 2023 (USD Million) 403

TABLE NO. 470. :. South Korea Medical Headgears Market Revenue, By Material, 2024 – 2032 (USD Million) 403

TABLE NO. 471. :. South Korea Medical Headgears Market Volume, By Type, 2018 – 2023 (Mn Units) 404

TABLE NO. 472. :. South Korea Medical Headgears Market Volume, By Type, 2024 – 2032 (Mn Units) 404

TABLE NO. 473. :. South Korea Medical Headgears Market Revenue, By Type, 2018 – 2023 (USD Million) 405

TABLE NO. 474. :. South Korea Medical Headgears Market Revenue, By Type, 2024 – 2032 (USD Million) 405

TABLE NO. 475. :. South Korea Medical Headgears Market Volume, By Application, 2018 – 2023 (Mn Units) 406

TABLE NO. 476. :. South Korea Medical Headgears Market Volume, By Application, 2024 – 2032 (Mn Units) 406

TABLE NO. 477. :. South Korea Medical Headgears Market Revenue, By Application, 2018 – 2023 (USD Million) 407

TABLE NO. 478. :. South Korea Medical Headgears Market Revenue, By Application, 2024 – 2032 (USD Million) 407

TABLE NO. 479. :. South Korea Medical Headgears Market Volume, By Distribution Channel, 2018 – 2023 (Mn Units) 408

TABLE NO. 480. :. South Korea Medical Headgears Market Volume, By Distribution Channel, 2024 – 2032 (Mn Units) 408

TABLE NO. 481. :. South Korea Medical Headgears Market Revenue, By Distribution Channel, 2018 – 2023 (USD Million) 409

TABLE NO. 482. :. South Korea Medical Headgears Market Revenue, By Distribution Channel, 2024 – 2032 (USD Million) 409

TABLE NO. 483. :. India Medical Headgears Market Volume, By End-user, 2018 – 2023 (Mn Units) 410

TABLE NO. 484. :. India Medical Headgears Market Volume, By End-user, 2024 – 2032 (Mn Units) 410

TABLE NO. 485. :. India Medical Headgears Market Revenue, By End-user, 2018 – 2023 (USD Million) 411

TABLE NO. 486. :. India Medical Headgears Market Revenue, By End-user, 2024 – 2032 (USD Million) 411

TABLE NO. 487. :. India Medical Headgears Market Volume, By Material, 2018 – 2023 (Mn Units) 412

TABLE NO. 488. :. India Medical Headgears Market Volume, By Material, 2024 – 2032 (Mn Units) 412

TABLE NO. 489. :. India Medical Headgears Market Revenue, By Material, 2018 – 2023 (USD Million) 413

TABLE NO. 490. :. India Medical Headgears Market Revenue, By Material, 2024 – 2032 (USD Million) 413

TABLE NO. 491. :. India Medical Headgears Market Volume, By Type, 2018 – 2023 (Mn Units) 414

TABLE NO. 492. :. India Medical Headgears Market Volume, By Type, 2024 – 2032 (Mn Units) 414

TABLE NO. 493. :. India Medical Headgears Market Revenue, By Type, 2018 – 2023 (USD Million) 415

TABLE NO. 494. :. India Medical Headgears Market Revenue, By Type, 2024 – 2032 (USD Million) 415

TABLE NO. 495. :. India Medical Headgears Market Volume, By Application, 2018 – 2023 (Mn Units) 416

TABLE NO. 496. :. India Medical Headgears Market Volume, By Application, 2024 – 2032 (Mn Units) 416

TABLE NO. 497. :. India Medical Headgears Market Revenue, By Application, 2018 – 2023 (USD Million) 417

TABLE NO. 498. :. India Medical Headgears Market Revenue, By Application, 2024 – 2032 (USD Million) 417

TABLE NO. 499. :. India Medical Headgears Market Volume, By Distribution Channel, 2018 – 2023 (Mn Units) 418

TABLE NO. 500. :. India Medical Headgears Market Volume, By Distribution Channel, 2024 – 2032 (Mn Units) 418

TABLE NO. 501. :. India Medical Headgears Market Revenue, By Distribution Channel, 2018 – 2023 (USD Million) 419

TABLE NO. 502. :. India Medical Headgears Market Revenue, By Distribution Channel, 2024 – 2032 (USD Million) 419

TABLE NO. 503. :. Australia Medical Headgears Market Volume, By End-user, 2018 – 2023 (Mn Units) 420

TABLE NO. 504. :. Australia Medical Headgears Market Volume, By End-user, 2024 – 2032 (Mn Units) 420

TABLE NO. 505. :. Australia Medical Headgears Market Revenue, By End-user, 2018 – 2023 (USD Million) 421

TABLE NO. 506. :. Australia Medical Headgears Market Revenue, By End-user, 2024 – 2032 (USD Million) 421

TABLE NO. 507. :. Australia Medical Headgears Market Volume, By Material, 2018 – 2023 (Mn Units) 422

TABLE NO. 508. :. Australia Medical Headgears Market Volume, By Material, 2024 – 2032 (Mn Units) 422

TABLE NO. 509. :. Australia Medical Headgears Market Revenue, By Material, 2018 – 2023 (USD Million) 423

TABLE NO. 510. :. Australia Medical Headgears Market Revenue, By Material, 2024 – 2032 (USD Million) 423

TABLE NO. 511. :. Australia Medical Headgears Market Volume, By Type, 2018 – 2023 (Mn Units) 424

TABLE NO. 512. :. Australia Medical Headgears Market Volume, By Type, 2024 – 2032 (Mn Units) 424

TABLE NO. 513. :. Australia Medical Headgears Market Revenue, By Type, 2018 – 2023 (USD Million) 425

TABLE NO. 514. :. Australia Medical Headgears Market Revenue, By Type, 2024 – 2032 (USD Million) 425

TABLE NO. 515. :. Australia Medical Headgears Market Volume, By Application, 2018 – 2023 (Mn Units) 426

TABLE NO. 516. :. Australia Medical Headgears Market Volume, By Application, 2024 – 2032 (Mn Units) 426

TABLE NO. 517. :. Australia Medical Headgears Market Revenue, By Application, 2018 – 2023 (USD Million) 427

TABLE NO. 518. :. Australia Medical Headgears Market Revenue, By Application, 2024 – 2032 (USD Million) 427

TABLE NO. 519. :. Australia Medical Headgears Market Volume, By Distribution Channel, 2018 – 2023 (Mn Units) 428

TABLE NO. 520. :. Australia Medical Headgears Market Volume, By Distribution Channel, 2024 – 2032 (Mn Units) 428

TABLE NO. 521. :. Australia Medical Headgears Market Revenue, By Distribution Channel, 2018 – 2023 (USD Million) 429

TABLE NO. 522. :. Australia Medical Headgears Market Revenue, By Distribution Channel, 2024 – 2032 (USD Million) 429

TABLE NO. 523. :. Thailand Medical Headgears Market Volume, By End-user, 2018 – 2023 (Mn Units) 430

TABLE NO. 524. :. Thailand Medical Headgears Market Volume, By End-user, 2024 – 2032 (Mn Units) 430

TABLE NO. 525. :. Thailand Medical Headgears Market Revenue, By End-user, 2018 – 2023 (USD Million) 431

TABLE NO. 526. :. Thailand Medical Headgears Market Revenue, By End-user, 2024 – 2032 (USD Million) 431

TABLE NO. 527. :. Thailand Medical Headgears Market Volume, By Material, 2018 – 2023 (Mn Units) 432

TABLE NO. 528. :. Thailand Medical Headgears Market Volume, By Material, 2024 – 2032 (Mn Units) 432

TABLE NO. 529. :. Thailand Medical Headgears Market Revenue, By Material, 2018 – 2023 (USD Million) 433

TABLE NO. 530. :. Thailand Medical Headgears Market Revenue, By Material, 2024 – 2032 (USD Million) 433

TABLE NO. 531. :. Thailand Medical Headgears Market Volume, By Type, 2018 – 2023 (Mn Units) 434

TABLE NO. 532. :. Thailand Medical Headgears Market Volume, By Type, 2024 – 2032 (Mn Units) 434

TABLE NO. 533. :. Thailand Medical Headgears Market Revenue, By Type, 2018 – 2023 (USD Million) 435

TABLE NO. 534. :. Thailand Medical Headgears Market Revenue, By Type, 2024 – 2032 (USD Million) 435

TABLE NO. 535. :. Thailand Medical Headgears Market Volume, By Application, 2018 – 2023 (Mn Units) 436

TABLE NO. 536. :. Thailand Medical Headgears Market Volume, By Application, 2024 – 2032 (Mn Units) 436

TABLE NO. 537. :. Thailand Medical Headgears Market Revenue, By Application, 2018 – 2023 (USD Million) 437

TABLE NO. 538. :. Thailand Medical Headgears Market Revenue, By Application, 2024 – 2032 (USD Million) 437

TABLE NO. 539. :. Thailand Medical Headgears Market Volume, By Distribution Channel, 2018 – 2023 (Mn Units) 438

TABLE NO. 540. :. Thailand Medical Headgears Market Volume, By Distribution Channel, 2024 – 2032 (Mn Units) 438

TABLE NO. 541. :. Thailand Medical Headgears Market Revenue, By Distribution Channel, 2018 – 2023 (USD Million) 439

TABLE NO. 542. :. Thailand Medical Headgears Market Revenue, By Distribution Channel, 2024 – 2032 (USD Million) 439

TABLE NO. 543. :. Indonesia Medical Headgears Market Volume, By End-user, 2018 – 2023 (Mn Units) 440

TABLE NO. 544. :. Indonesia Medical Headgears Market Volume, By End-user, 2024 – 2032 (Mn Units) 440

TABLE NO. 545. :. Indonesia Medical Headgears Market Revenue, By End-user, 2018 – 2023 (USD Million) 441

TABLE NO. 546. :. Indonesia Medical Headgears Market Revenue, By End-user, 2024 – 2032 (USD Million) 441

TABLE NO. 547. :. Indonesia Medical Headgears Market Volume, By Material, 2018 – 2023 (Mn Units) 442

TABLE NO. 548. :. Indonesia Medical Headgears Market Volume, By Material, 2024 – 2032 (Mn Units) 442

TABLE NO. 549. :. Indonesia Medical Headgears Market Revenue, By Material, 2018 – 2023 (USD Million) 443

TABLE NO. 550. :. Indonesia Medical Headgears Market Revenue, By Material, 2024 – 2032 (USD Million) 443

TABLE NO. 551. :. Indonesia Medical Headgears Market Volume, By Type, 2018 – 2023 (Mn Units) 444

TABLE NO. 552. :. Indonesia Medical Headgears Market Volume, By Type, 2024 – 2032 (Mn Units) 444

TABLE NO. 553. :. Indonesia Medical Headgears Market Revenue, By Type, 2018 – 2023 (USD Million) 445

TABLE NO. 554. :. Indonesia Medical Headgears Market Revenue, By Type, 2024 – 2032 (USD Million) 445

TABLE NO. 555. :. Indonesia Medical Headgears Market Volume, By Application, 2018 – 2023 (Mn Units) 446

TABLE NO. 556. :. Indonesia Medical Headgears Market Volume, By Application, 2024 – 2032 (Mn Units) 446

TABLE NO. 557. :. Indonesia Medical Headgears Market Revenue, By Application, 2018 – 2023 (USD Million) 447

TABLE NO. 558. :. Indonesia Medical Headgears Market Revenue, By Application, 2024 – 2032 (USD Million) 447

TABLE NO. 559. :. Indonesia Medical Headgears Market Volume, By Distribution Channel, 2018 – 2023 (Mn Units) 448

TABLE NO. 560. :. Indonesia Medical Headgears Market Volume, By Distribution Channel, 2024 – 2032 (Mn Units) 448

TABLE NO. 561. :. Indonesia Medical Headgears Market Revenue, By Distribution Channel, 2018 – 2023 (USD Million) 449

TABLE NO. 562. :. Indonesia Medical Headgears Market Revenue, By Distribution Channel, 2024 – 2032 (USD Million) 449

TABLE NO. 563. :. Vietnam Medical Headgears Market Volume, By End-user, 2018 – 2023 (Mn Units) 450

TABLE NO. 564. :. Vietnam Medical Headgears Market Volume, By End-user, 2024 – 2032 (Mn Units) 450

TABLE NO. 565. :. Vietnam Medical Headgears Market Revenue, By End-user, 2018 – 2023 (USD Million) 451

TABLE NO. 566. :. Vietnam Medical Headgears Market Revenue, By End-user, 2024 – 2032 (USD Million) 451

TABLE NO. 567. :. Vietnam Medical Headgears Market Volume, By Material, 2018 – 2023 (Mn Units) 452

TABLE NO. 568. :. Vietnam Medical Headgears Market Volume, By Material, 2024 – 2032 (Mn Units) 452

TABLE NO. 569. :. Vietnam Medical Headgears Market Revenue, By Material, 2018 – 2023 (USD Million) 453

TABLE NO. 570. :. Vietnam Medical Headgears Market Revenue, By Material, 2024 – 2032 (USD Million) 453

TABLE NO. 571. :. Vietnam Medical Headgears Market Volume, By Type, 2018 – 2023 (Mn Units) 454

TABLE NO. 572. :. Vietnam Medical Headgears Market Volume, By Type, 2024 – 2032 (Mn Units) 454

TABLE NO. 573. :. Vietnam Medical Headgears Market Revenue, By Type, 2018 – 2023 (USD Million) 455

TABLE NO. 574. :. Vietnam Medical Headgears Market Revenue, By Type, 2024 – 2032 (USD Million) 455

TABLE NO. 575. :. Vietnam Medical Headgears Market Volume, By Application, 2018 – 2023 (Mn Units) 456

TABLE NO. 576. :. Vietnam Medical Headgears Market Volume, By Application, 2024 – 2032 (Mn Units) 456

TABLE NO. 577. :. Vietnam Medical Headgears Market Revenue, By Application, 2018 – 2023 (USD Million) 457

TABLE NO. 578. :. Vietnam Medical Headgears Market Revenue, By Application, 2024 – 2032 (USD Million) 457

TABLE NO. 579. :. Vietnam Medical Headgears Market Volume, By Distribution Channel, 2018 – 2023 (Mn Units) 458

TABLE NO. 580. :. Vietnam Medical Headgears Market Volume, By Distribution Channel, 2024 – 2032 (Mn Units) 458

TABLE NO. 581. :. Vietnam Medical Headgears Market Revenue, By Distribution Channel, 2018 – 2023 (USD Million) 459

TABLE NO. 582. :. Vietnam Medical Headgears Market Revenue, By Distribution Channel, 2024 – 2032 (USD Million) 459

TABLE NO. 583. :. Malaysia Medical Headgears Market Volume, By End-user, 2018 – 2023 (Mn Units) 460

TABLE NO. 584. :. Malaysia Medical Headgears Market Volume, By End-user, 2024 – 2032 (Mn Units) 460

TABLE NO. 585. :. Malaysia Medical Headgears Market Revenue, By End-user, 2018 – 2023 (USD Million) 461

TABLE NO. 586. :. Malaysia Medical Headgears Market Revenue, By End-user, 2024 – 2032 (USD Million) 461

TABLE NO. 587. :. Malaysia Medical Headgears Market Volume, By Material, 2018 – 2023 (Mn Units) 462

TABLE NO. 588. :. Malaysia Medical Headgears Market Volume, By Material, 2024 – 2032 (Mn Units) 462

TABLE NO. 589. :. Malaysia Medical Headgears Market Revenue, By Material, 2018 – 2023 (USD Million) 463

TABLE NO. 590. :. Malaysia Medical Headgears Market Revenue, By Material, 2024 – 2032 (USD Million) 463

TABLE NO. 591. :. Malaysia Medical Headgears Market Volume, By Type, 2018 – 2023 (Mn Units) 464

TABLE NO. 592. :. Malaysia Medical Headgears Market Volume, By Type, 2024 – 2032 (Mn Units) 464

TABLE NO. 593. :. Malaysia Medical Headgears Market Revenue, By Type, 2018 – 2023 (USD Million) 465

TABLE NO. 594. :. Malaysia Medical Headgears Market Revenue, By Type, 2024 – 2032 (USD Million) 465

TABLE NO. 595. :. Malaysia Medical Headgears Market Volume, By Application, 2018 – 2023 (Mn Units) 466

TABLE NO. 596. :. Malaysia Medical Headgears Market Volume, By Application, 2024 – 2032 (Mn Units) 466

TABLE NO. 597. :. Malaysia Medical Headgears Market Revenue, By Application, 2018 – 2023 (USD Million) 467

TABLE NO. 598. :. Malaysia Medical Headgears Market Revenue, By Application, 2024 – 2032 (USD Million) 467

TABLE NO. 599. :. Malaysia Medical Headgears Market Volume, By Distribution Channel, 2018 – 2023 (Mn Units) 468

TABLE NO. 600. :. Malaysia Medical Headgears Market Volume, By Distribution Channel, 2024 – 2032 (Mn Units) 468

TABLE NO. 601. :. Malaysia Medical Headgears Market Revenue, By Distribution Channel, 2018 – 2023 (USD Million) 469

TABLE NO. 602. :. Malaysia Medical Headgears Market Revenue, By Distribution Channel, 2024 – 2032 (USD Million) 469

TABLE NO. 603. :. Philippines Medical Headgears Market Volume, By End-user, 2018 – 2023 (Mn Units) 470

TABLE NO. 604. :. Philippines Medical Headgears Market Volume, By End-user, 2024 – 2032 (Mn Units) 470

TABLE NO. 605. :. Philippines Medical Headgears Market Revenue, By End-user, 2018 – 2023 (USD Million) 471

TABLE NO. 606. :. Philippines Medical Headgears Market Revenue, By End-user, 2024 – 2032 (USD Million) 471

TABLE NO. 607. :. Philippines Medical Headgears Market Volume, By Material, 2018 – 2023 (Mn Units) 472

TABLE NO. 608. :. Philippines Medical Headgears Market Volume, By Material, 2024 – 2032 (Mn Units) 472

TABLE NO. 609. :. Philippines Medical Headgears Market Revenue, By Material, 2018 – 2023 (USD Million) 473

TABLE NO. 610. :. Philippines Medical Headgears Market Revenue, By Material, 2024 – 2032 (USD Million) 473

TABLE NO. 611. :. Philippines Medical Headgears Market Volume, By Type, 2018 – 2023 (Mn Units) 474

TABLE NO. 612. :. Philippines Medical Headgears Market Volume, By Type, 2024 – 2032 (Mn Units) 474

TABLE NO. 613. :. Philippines Medical Headgears Market Revenue, By Type, 2018 – 2023 (USD Million) 475

TABLE NO. 614. :. Philippines Medical Headgears Market Revenue, By Type, 2024 – 2032 (USD Million) 475

TABLE NO. 615. :. Philippines Medical Headgears Market Volume, By Application, 2018 – 2023 (Mn Units) 476

TABLE NO. 616. :. Philippines Medical Headgears Market Volume, By Application, 2024 – 2032 (Mn Units) 476

TABLE NO. 617. :. Philippines Medical Headgears Market Revenue, By Application, 2018 – 2023 (USD Million) 477

TABLE NO. 618. :. Philippines Medical Headgears Market Revenue, By Application, 2024 – 2032 (USD Million) 477

TABLE NO. 619. :. Philippines Medical Headgears Market Volume, By Distribution Channel, 2018 – 2023 (Mn Units) 478

TABLE NO. 620. :. Philippines Medical Headgears Market Volume, By Distribution Channel, 2024 – 2032 (Mn Units) 478

TABLE NO. 621. :. Philippines Medical Headgears Market Revenue, By Distribution Channel, 2018 – 2023 (USD Million) 479

TABLE NO. 622. :. Philippines Medical Headgears Market Revenue, By Distribution Channel, 2024 – 2032 (USD Million) 479

TABLE NO. 623. :. Taiwan Medical Headgears Market Volume, By End-user, 2018 – 2023 (Mn Units) 480

TABLE NO. 624. :. Taiwan Medical Headgears Market Volume, By End-user, 2024 – 2032 (Mn Units) 480

TABLE NO. 625. :. Taiwan Medical Headgears Market Revenue, By End-user, 2018 – 2023 (USD Million) 481

TABLE NO. 626. :. Taiwan Medical Headgears Market Revenue, By End-user, 2024 – 2032 (USD Million) 481

TABLE NO. 627. :. Taiwan Medical Headgears Market Volume, By Material, 2018 – 2023 (Mn Units) 482

TABLE NO. 628. :. Taiwan Medical Headgears Market Volume, By Material, 2024 – 2032 (Mn Units) 482

TABLE NO. 629. :. Taiwan Medical Headgears Market Revenue, By Material, 2018 – 2023 (USD Million) 483

TABLE NO. 630. :. Taiwan Medical Headgears Market Revenue, By Material, 2024 – 2032 (USD Million) 483

TABLE NO. 631. :. Taiwan Medical Headgears Market Volume, By Type, 2018 – 2023 (Mn Units) 484

TABLE NO. 632. :. Taiwan Medical Headgears Market Volume, By Type, 2024 – 2032 (Mn Units) 484

TABLE NO. 633. :. Taiwan Medical Headgears Market Revenue, By Type, 2018 – 2023 (USD Million) 485

TABLE NO. 634. :. Taiwan Medical Headgears Market Revenue, By Type, 2024 – 2032 (USD Million) 485

TABLE NO. 635. :. Taiwan Medical Headgears Market Volume, By Application, 2018 – 2023 (Mn Units) 486

TABLE NO. 636. :. Taiwan Medical Headgears Market Volume, By Application, 2024 – 2032 (Mn Units) 486

TABLE NO. 637. :. Taiwan Medical Headgears Market Revenue, By Application, 2018 – 2023 (USD Million) 487

TABLE NO. 638. :. Taiwan Medical Headgears Market Revenue, By Application, 2024 – 2032 (USD Million) 487

TABLE NO. 639. :. Taiwan Medical Headgears Market Volume, By Distribution Channel, 2018 – 2023 (Mn Units) 488

TABLE NO. 640. :. Taiwan Medical Headgears Market Volume, By Distribution Channel, 2024 – 2032 (Mn Units) 488

TABLE NO. 641. :. Taiwan Medical Headgears Market Revenue, By Distribution Channel, 2018 – 2023 (USD Million) 489

TABLE NO. 642. :. Taiwan Medical Headgears Market Revenue, By Distribution Channel, 2024 – 2032 (USD Million) 489

TABLE NO. 643. :. Rest of Asia Pacific Medical Headgears Market Volume, By End-user, 2018 – 2023 (Mn Units) 490

TABLE NO. 644. :. Rest of Asia Pacific Medical Headgears Market Volume, By End-user, 2024 – 2032 (Mn Units) 490

TABLE NO. 645. :. Rest of Asia Pacific Medical Headgears Market Revenue, By End-user, 2018 – 2023 (USD Million) 491

TABLE NO. 646. :. Rest of Asia Pacific Medical Headgears Market Revenue, By End-user, 2024 – 2032 (USD Million) 491

TABLE NO. 647. :. Rest of Asia Pacific Medical Headgears Market Volume, By Material, 2018 – 2023 (Mn Units) 492

TABLE NO. 648. :. Rest of Asia Pacific Medical Headgears Market Volume, By Material, 2024 – 2032 (Mn Units) 492

TABLE NO. 649. :. Rest of Asia Pacific Medical Headgears Market Revenue, By Material, 2018 – 2023 (USD Million) 493

TABLE NO. 650. :. Rest of Asia Pacific Medical Headgears Market Revenue, By Material, 2024 – 2032 (USD Million) 493

TABLE NO. 651. :. Rest of Asia Pacific Medical Headgears Market Volume, By Type, 2018 – 2023 (Mn Units) 494

TABLE NO. 652. :. Rest of Asia Pacific Medical Headgears Market Volume, By Type, 2024 – 2032 (Mn Units) 494

TABLE NO. 653. :. Rest of Asia Pacific Medical Headgears Market Revenue, By Type, 2018 – 2023 (USD Million) 495

TABLE NO. 654. :. Rest of Asia Pacific Medical Headgears Market Revenue, By Type, 2024 – 2032 (USD Million) 495

TABLE NO. 655. :. Rest of Asia Pacific Medical Headgears Market Volume, By Application, 2018 – 2023 (Mn Units) 496

TABLE NO. 656. :. Rest of Asia Pacific Medical Headgears Market Volume, By Application, 2024 – 2032 (Mn Units) 496

TABLE NO. 657. :. Rest of Asia Pacific Medical Headgears Market Revenue, By Application, 2018 – 2023 (USD Million) 497

TABLE NO. 658. :. Rest of Asia Pacific Medical Headgears Market Revenue, By Application, 2024 – 2032 (USD Million) 497

TABLE NO. 659. :. Rest of Asia Pacific Medical Headgears Market Volume, By Distribution Channel, 2018 – 2023 (Mn Units) 498

TABLE NO. 660. :. Rest of Asia Pacific Medical Headgears Market Volume, By Distribution Channel, 2024 – 2032 (Mn Units) 498

TABLE NO. 661. :. Rest of Asia Pacific Medical Headgears Market Revenue, By Distribution Channel, 2018 – 2023 (USD Million) 499

TABLE NO. 662. :. Rest of Asia Pacific Medical Headgears Market Revenue, By Distribution Channel, 2024 – 2032 (USD Million) 499

TABLE NO. 663. :. Latin America Medical Headgears Market Volume, By Country, 2018 – 2023 (Mn Units) 502

TABLE NO. 664. :. Latin America Medical Headgears Market Volume, By Country, 2024 – 2032 (Mn Units) 502

TABLE NO. 665. :. Latin America Medical Headgears Market Revenue, By Country, 2018 – 2023 (USD Million) 503

TABLE NO. 666. :. Latin America Medical Headgears Market Revenue, By Country, 2024 – 2032 (USD Million) 503

TABLE NO. 667. :. Latin America Medical Headgears Market Volume, By End-user, 2018 – 2023 (Mn Units) 504

TABLE NO. 668. :. Latin America Medical Headgears Market Volume, By End-user, 2024 – 2032 (Mn Units) 504

TABLE NO. 669. :. Latin America Medical Headgears Market Revenue, By End-user, 2018 – 2023 (USD Million) 505

TABLE NO. 670. :. Latin America Medical Headgears Market Revenue, By End-user, 2024 – 2032 (USD Million) 505

TABLE NO. 671. :. Latin America Medical Headgears Market Volume, By Material, 2018 – 2023 (Mn Units) 506

TABLE NO. 672. :. Latin America Medical Headgears Market Volume, By Material, 2024 – 2032 (Mn Units) 506

TABLE NO. 673. :. Latin America Medical Headgears Market Revenue, By Material, 2018 – 2023 (USD Million) 507

TABLE NO. 674. :. Latin America Medical Headgears Market Revenue, By Material, 2024 – 2032 (USD Million) 507

TABLE NO. 675. :. Latin America Medical Headgears Market Volume, By Type, 2018 – 2023 (Mn Units) 508

TABLE NO. 676. :. Latin America Medical Headgears Market Volume, By Type, 2024 – 2032 (Mn Units) 508

TABLE NO. 677. :. Latin America Medical Headgears Market Revenue, By Type, 2018 – 2023 (USD Million) 509

TABLE NO. 678. :. Latin America Medical Headgears Market Revenue, By Type, 2024 – 2032 (USD Million) 509

TABLE NO. 679. :. Latin America Medical Headgears Market Volume, By Application, 2018 – 2023 (Mn Units) 510

TABLE NO. 680. :. Latin America Medical Headgears Market Volume, By Application, 2024 – 2032 (Mn Units) 510

TABLE NO. 681. :. Latin America Medical Headgears Market Revenue, By Application, 2018 – 2023 (USD Million) 511

TABLE NO. 682. :. Latin America Medical Headgears Market Revenue, By Application, 2024 – 2032 (USD Million) 511

TABLE NO. 683. :. Latin America Medical Headgears Market Volume, By Distribution Channel, 2018 – 2023 (Mn Units) 512

TABLE NO. 684. :. Latin America Medical Headgears Market Volume, By Distribution Channel, 2024 – 2032 (Mn Units) 512

TABLE NO. 685. :. Latin America Medical Headgears Market Revenue, By Distribution Channel, 2018 – 2023 (USD Million) 513

TABLE NO. 686. :. Latin America Medical Headgears Market Revenue, By Distribution Channel, 2024 – 2032 (USD Million) 513

TABLE NO. 687. :. Brazil Medical Headgears Market Volume, By End-user, 2018 – 2023 (Mn Units) 514

TABLE NO. 688. :. Brazil Medical Headgears Market Volume, By End-user, 2024 – 2032 (Mn Units) 514

TABLE NO. 689. :. Brazil Medical Headgears Market Revenue, By End-user, 2018 – 2023 (USD Million) 515

TABLE NO. 690. :. Brazil Medical Headgears Market Revenue, By End-user, 2024 – 2032 (USD Million) 515

TABLE NO. 691. :. Brazil Medical Headgears Market Volume, By Material, 2018 – 2023 (Mn Units) 516

TABLE NO. 692. :. Brazil Medical Headgears Market Volume, By Material, 2024 – 2032 (Mn Units) 516

TABLE NO. 693. :. Brazil Medical Headgears Market Revenue, By Material, 2018 – 2023 (USD Million) 517

TABLE NO. 694. :. Brazil Medical Headgears Market Revenue, By Material, 2024 – 2032 (USD Million) 517

TABLE NO. 695. :. Brazil Medical Headgears Market Volume, By Type, 2018 – 2023 (Mn Units) 518

TABLE NO. 696. :. Brazil Medical Headgears Market Volume, By Type, 2024 – 2032 (Mn Units) 518

TABLE NO. 697. :. Brazil Medical Headgears Market Revenue, By Type, 2018 – 2023 (USD Million) 519

TABLE NO. 698. :. Brazil Medical Headgears Market Revenue, By Type, 2024 – 2032 (USD Million) 519

TABLE NO. 699. :. Brazil Medical Headgears Market Volume, By Application, 2018 – 2023 (Mn Units) 520

TABLE NO. 700. :. Brazil Medical Headgears Market Volume, By Application, 2024 – 2032 (Mn Units) 520

TABLE NO. 701. :. Brazil Medical Headgears Market Revenue, By Application, 2018 – 2023 (USD Million) 521

TABLE NO. 702. :. Brazil Medical Headgears Market Revenue, By Application, 2024 – 2032 (USD Million) 521

TABLE NO. 703. :. Brazil Medical Headgears Market Volume, By Distribution Channel, 2018 – 2023 (Mn Units) 522

TABLE NO. 704. :. Brazil Medical Headgears Market Volume, By Distribution Channel, 2024 – 2032 (Mn Units) 522

TABLE NO. 705. :. Brazil Medical Headgears Market Revenue, By Distribution Channel, 2018 – 2023 (USD Million) 523

TABLE NO. 706. :. Brazil Medical Headgears Market Revenue, By Distribution Channel, 2024 – 2032 (USD Million) 523

TABLE NO. 707. :. Argentina Medical Headgears Market Volume, By End-user, 2018 – 2023 (Mn Units) 524

TABLE NO. 708. :. Argentina Medical Headgears Market Volume, By End-user, 2024 – 2032 (Mn Units) 524

TABLE NO. 709. :. Argentina Medical Headgears Market Revenue, By End-user, 2018 – 2023 (USD Million) 525

TABLE NO. 710. :. Argentina Medical Headgears Market Revenue, By End-user, 2024 – 2032 (USD Million) 525

TABLE NO. 711. :. Argentina Medical Headgears Market Volume, By Material, 2018 – 2023 (Mn Units) 526

TABLE NO. 712. :. Argentina Medical Headgears Market Volume, By Material, 2024 – 2032 (Mn Units) 526

TABLE NO. 713. :. Argentina Medical Headgears Market Revenue, By Material, 2018 – 2023 (USD Million) 527

TABLE NO. 714. :. Argentina Medical Headgears Market Revenue, By Material, 2024 – 2032 (USD Million) 527

TABLE NO. 715. :. Argentina Medical Headgears Market Volume, By Type, 2018 – 2023 (Mn Units) 528

TABLE NO. 716. :. Argentina Medical Headgears Market Volume, By Type, 2024 – 2032 (Mn Units) 528

TABLE NO. 717. :. Argentina Medical Headgears Market Revenue, By Type, 2018 – 2023 (USD Million) 529

TABLE NO. 718. :. Argentina Medical Headgears Market Revenue, By Type, 2024 – 2032 (USD Million) 529

TABLE NO. 719. :. Argentina Medical Headgears Market Volume, By Application, 2018 – 2023 (Mn Units) 530

TABLE NO. 720. :. Argentina Medical Headgears Market Volume, By Application, 2024 – 2032 (Mn Units) 530

TABLE NO. 721. :. Argentina Medical Headgears Market Revenue, By Application, 2018 – 2023 (USD Million) 531

TABLE NO. 722. :. Argentina Medical Headgears Market Revenue, By Application, 2024 – 2032 (USD Million) 531

TABLE NO. 723. :. Argentina Medical Headgears Market Volume, By Distribution Channel, 2018 – 2023 (Mn Units) 532

TABLE NO. 724. :. Argentina Medical Headgears Market Volume, By Distribution Channel, 2024 – 2032 (Mn Units) 532

TABLE NO. 725. :. Argentina Medical Headgears Market Revenue, By Distribution Channel, 2018 – 2023 (USD Million) 533

TABLE NO. 726. :. Argentina Medical Headgears Market Revenue, By Distribution Channel, 2024 – 2032 (USD Million) 533

TABLE NO. 727. :. Peru Medical Headgears Market Volume, By End-user, 2018 – 2023 (Mn Units) 534

TABLE NO. 728. :. Peru Medical Headgears Market Volume, By End-user, 2024 – 2032 (Mn Units) 534

TABLE NO. 729. :. Peru Medical Headgears Market Revenue, By End-user, 2018 – 2023 (USD Million) 535

TABLE NO. 730. :. Peru Medical Headgears Market Revenue, By End-user, 2024 – 2032 (USD Million) 535

TABLE NO. 731. :. Peru Medical Headgears Market Volume, By Material, 2018 – 2023 (Mn Units) 536

TABLE NO. 732. :. Peru Medical Headgears Market Volume, By Material, 2024 – 2032 (Mn Units) 536

TABLE NO. 733. :. Peru Medical Headgears Market Revenue, By Material, 2018 – 2023 (USD Million) 537

TABLE NO. 734. :. Peru Medical Headgears Market Revenue, By Material, 2024 – 2032 (USD Million) 537

TABLE NO. 735. :. Peru Medical Headgears Market Volume, By Type, 2018 – 2023 (Mn Units) 538

TABLE NO. 736. :. Peru Medical Headgears Market Volume, By Type, 2024 – 2032 (Mn Units) 538

TABLE NO. 737. :. Peru Medical Headgears Market Revenue, By Type, 2018 – 2023 (USD Million) 539

TABLE NO. 738. :. Peru Medical Headgears Market Revenue, By Type, 2024 – 2032 (USD Million) 539

TABLE NO. 739. :. Peru Medical Headgears Market Volume, By Application, 2018 – 2023 (Mn Units) 540

TABLE NO. 740. :. Peru Medical Headgears Market Volume, By Application, 2024 – 2032 (Mn Units) 540

TABLE NO. 741. :. Peru Medical Headgears Market Revenue, By Application, 2018 – 2023 (USD Million) 541

TABLE NO. 742. :. Peru Medical Headgears Market Revenue, By Application, 2024 – 2032 (USD Million) 541

TABLE NO. 743. :. Peru Medical Headgears Market Volume, By Distribution Channel, 2018 – 2023 (Mn Units) 542

TABLE NO. 744. :. Peru Medical Headgears Market Volume, By Distribution Channel, 2024 – 2032 (Mn Units) 542

TABLE NO. 745. :. Peru Medical Headgears Market Revenue, By Distribution Channel, 2018 – 2023 (USD Million) 543

TABLE NO. 746. :. Peru Medical Headgears Market Revenue, By Distribution Channel, 2024 – 2032 (USD Million) 543

TABLE NO. 747. :. Chile Medical Headgears Market Volume, By End-user, 2018 – 2023 (Mn Units) 544

TABLE NO. 748. :. Chile Medical Headgears Market Volume, By End-user, 2024 – 2032 (Mn Units) 544

TABLE NO. 749. :. Chile Medical Headgears Market Revenue, By End-user, 2018 – 2023 (USD Million) 545

TABLE NO. 750. :. Chile Medical Headgears Market Revenue, By End-user, 2024 – 2032 (USD Million) 545

TABLE NO. 751. :. Chile Medical Headgears Market Volume, By Material, 2018 – 2023 (Mn Units) 546

TABLE NO. 752. :. Chile Medical Headgears Market Volume, By Material, 2024 – 2032 (Mn Units) 546

TABLE NO. 753. :. Chile Medical Headgears Market Revenue, By Material, 2018 – 2023 (USD Million) 547

TABLE NO. 754. :. Chile Medical Headgears Market Revenue, By Material, 2024 – 2032 (USD Million) 547

TABLE NO. 755. :. Chile Medical Headgears Market Volume, By Type, 2018 – 2023 (Mn Units) 548

TABLE NO. 756. :. Chile Medical Headgears Market Volume, By Type, 2024 – 2032 (Mn Units) 548

TABLE NO. 757. :. Chile Medical Headgears Market Revenue, By Type, 2018 – 2023 (USD Million) 549

TABLE NO. 758. :. Chile Medical Headgears Market Revenue, By Type, 2024 – 2032 (USD Million) 549

TABLE NO. 759. :. Chile Medical Headgears Market Volume, By Application, 2018 – 2023 (Mn Units) 550

TABLE NO. 760. :. Chile Medical Headgears Market Volume, By Application, 2024 – 2032 (Mn Units) 550

TABLE NO. 761. :. Chile Medical Headgears Market Revenue, By Application, 2018 – 2023 (USD Million) 551

TABLE NO. 762. :. Chile Medical Headgears Market Revenue, By Application, 2024 – 2032 (USD Million) 551

TABLE NO. 763. :. Chile Medical Headgears Market Volume, By Distribution Channel, 2018 – 2023 (Mn Units) 552

TABLE NO. 764. :. Chile Medical Headgears Market Volume, By Distribution Channel, 2024 – 2032 (Mn Units) 552

TABLE NO. 765. :. Chile Medical Headgears Market Revenue, By Distribution Channel, 2018 – 2023 (USD Million) 553

TABLE NO. 766. :. Chile Medical Headgears Market Revenue, By Distribution Channel, 2024 – 2032 (USD Million) 553

TABLE NO. 767. :. Colombia Medical Headgears Market Volume, By End-user, 2018 – 2023 (Mn Units) 554

TABLE NO. 768. :. Colombia Medical Headgears Market Volume, By End-user, 2024 – 2032 (Mn Units) 554

TABLE NO. 769. :. Colombia Medical Headgears Market Revenue, By End-user, 2018 – 2023 (USD Million) 555

TABLE NO. 770. :. Colombia Medical Headgears Market Revenue, By End-user, 2024 – 2032 (USD Million) 555

TABLE NO. 771. :. Colombia Medical Headgears Market Volume, By Material, 2018 – 2023 (Mn Units) 556

TABLE NO. 772. :. Colombia Medical Headgears Market Volume, By Material, 2024 – 2032 (Mn Units) 556

TABLE NO. 773. :. Colombia Medical Headgears Market Revenue, By Material, 2018 – 2023 (USD Million) 557

TABLE NO. 774. :. Colombia Medical Headgears Market Revenue, By Material, 2024 – 2032 (USD Million) 557

TABLE NO. 775. :. Colombia Medical Headgears Market Volume, By Type, 2018 – 2023 (Mn Units) 558

TABLE NO. 776. :. Colombia Medical Headgears Market Volume, By Type, 2024 – 2032 (Mn Units) 558

TABLE NO. 777. :. Colombia Medical Headgears Market Revenue, By Type, 2018 – 2023 (USD Million) 559

TABLE NO. 778. :. Colombia Medical Headgears Market Revenue, By Type, 2024 – 2032 (USD Million) 559

TABLE NO. 779. :. Colombia Medical Headgears Market Volume, By Application, 2018 – 2023 (Mn Units) 560

TABLE NO. 780. :. Colombia Medical Headgears Market Volume, By Application, 2024 – 2032 (Mn Units) 560

TABLE NO. 781. :. Colombia Medical Headgears Market Revenue, By Application, 2018 – 2023 (USD Million) 561

TABLE NO. 782. :. Colombia Medical Headgears Market Revenue, By Application, 2024 – 2032 (USD Million) 561

TABLE NO. 783. :. Colombia Medical Headgears Market Volume, By Distribution Channel, 2018 – 2023 (Mn Units) 562

TABLE NO. 784. :. Colombia Medical Headgears Market Volume, By Distribution Channel, 2024 – 2032 (Mn Units) 562

TABLE NO. 785. :. Colombia Medical Headgears Market Revenue, By Distribution Channel, 2018 – 2023 (USD Million) 563

TABLE NO. 786. :. Colombia Medical Headgears Market Revenue, By Distribution Channel, 2024 – 2032 (USD Million) 563

TABLE NO. 787. :. Rest of Latin America Medical Headgears Market Volume, By End-user, 2018 – 2023 (Mn Units) 564

TABLE NO. 788. :. Rest of Latin America Medical Headgears Market Volume, By End-user, 2024 – 2032 (Mn Units) 564

TABLE NO. 789. :. Rest of Latin America Medical Headgears Market Revenue, By End-user, 2018 – 2023 (USD Million) 565

TABLE NO. 790. :. Rest of Latin America Medical Headgears Market Revenue, By End-user, 2024 – 2032 (USD Million) 565

TABLE NO. 791. :. Rest of Latin America Medical Headgears Market Volume, By Material, 2018 – 2023 (Mn Units) 566

TABLE NO. 792. :. Rest of Latin America Medical Headgears Market Volume, By Material, 2024 – 2032 (Mn Units) 566

TABLE NO. 793. :. Rest of Latin America Medical Headgears Market Revenue, By Material, 2018 – 2023 (USD Million) 567

TABLE NO. 794. :. Rest of Latin America Medical Headgears Market Revenue, By Material, 2024 – 2032 (USD Million) 567

TABLE NO. 795. :. Rest of Latin America Medical Headgears Market Volume, By Type, 2018 – 2023 (Mn Units) 568

TABLE NO. 796. :. Rest of Latin America Medical Headgears Market Volume, By Type, 2024 – 2032 (Mn Units) 568

TABLE NO. 797. :. Rest of Latin America Medical Headgears Market Revenue, By Type, 2018 – 2023 (USD Million) 569

TABLE NO. 798. :. Rest of Latin America Medical Headgears Market Revenue, By Type, 2024 – 2032 (USD Million) 569

TABLE NO. 799. :. Rest of Latin America Medical Headgears Market Volume, By Application, 2018 – 2023 (Mn Units) 570

TABLE NO. 800. :. Rest of Latin America Medical Headgears Market Volume, By Application, 2024 – 2032 (Mn Units) 570

TABLE NO. 801. :. Rest of Latin America Medical Headgears Market Revenue, By Application, 2018 – 2023 (USD Million) 571

TABLE NO. 802. :. Rest of Latin America Medical Headgears Market Revenue, By Application, 2024 – 2032 (USD Million) 571

TABLE NO. 803. :. Rest of Latin America Medical Headgears Market Volume, By Distribution Channel, 2018 – 2023 (Mn Units) 572

TABLE NO. 804. :. Rest of Latin America Medical Headgears Market Volume, By Distribution Channel, 2024 – 2032 (Mn Units) 572

TABLE NO. 805. :. Rest of Latin America Medical Headgears Market Revenue, By Distribution Channel, 2018 – 2023 (USD Million) 573

TABLE NO. 806. :. Rest of Latin America Medical Headgears Market Revenue, By Distribution Channel, 2024 – 2032 (USD Million) 573

TABLE NO. 807. :. Middle East Medical Headgears Market Volume, By Country, 2018 – 2023 (Mn Units) 576

TABLE NO. 808. :. Middle East Medical Headgears Market Volume, By Country, 2024 – 2032 (Mn Units) 576

TABLE NO. 809. :. Middle East Medical Headgears Market Revenue, By Country, 2018 – 2023 (USD Million) 577

TABLE NO. 810. :. Middle East Medical Headgears Market Revenue, By Country, 2024 – 2032 (USD Million) 577

TABLE NO. 811. :. Middle East Medical Headgears Market Volume, By End-user, 2018 – 2023 (Mn Units) 578

TABLE NO. 812. :. Middle East Medical Headgears Market Volume, By End-user, 2024 – 2032 (Mn Units) 578

TABLE NO. 813. :. Middle East Medical Headgears Market Revenue, By End-user, 2018 – 2023 (USD Million) 579

TABLE NO. 814. :. Middle East Medical Headgears Market Revenue, By End-user, 2024 – 2032 (USD Million) 579

TABLE NO. 815. :. Middle East Medical Headgears Market Volume, By Material, 2018 – 2023 (Mn Units) 580

TABLE NO. 816. :. Middle East Medical Headgears Market Volume, By Material, 2024 – 2032 (Mn Units) 580

TABLE NO. 817. :. Middle East Medical Headgears Market Revenue, By Material, 2018 – 2023 (USD Million) 581

TABLE NO. 818. :. Middle East Medical Headgears Market Revenue, By Material, 2024 – 2032 (USD Million) 581

TABLE NO. 819. :. Middle East Medical Headgears Market Volume, By Type, 2018 – 2023 (Mn Units) 582

TABLE NO. 820. :. Middle East Medical Headgears Market Volume, By Type, 2024 – 2032 (Mn Units) 582

TABLE NO. 821. :. Middle East Medical Headgears Market Revenue, By Type, 2018 – 2023 (USD Million) 583

TABLE NO. 822. :. Middle East Medical Headgears Market Revenue, By Type, 2024 – 2032 (USD Million) 583

TABLE NO. 823. :. Middle East Medical Headgears Market Volume, By Application, 2018 – 2023 (Mn Units) 584

TABLE NO. 824. :. Middle East Medical Headgears Market Volume, By Application, 2024 – 2032 (Mn Units) 584

TABLE NO. 825. :. Middle East Medical Headgears Market Revenue, By Application, 2018 – 2023 (USD Million) 585

TABLE NO. 826. :. Middle East Medical Headgears Market Revenue, By Application, 2024 – 2032 (USD Million) 585

TABLE NO. 827. :. Middle East Medical Headgears Market Volume, By Distribution Channel, 2018 – 2023 (Mn Units) 586

TABLE NO. 828. :. Middle East Medical Headgears Market Volume, By Distribution Channel, 2024 – 2032 (Mn Units) 586

TABLE NO. 829. :. Middle East Medical Headgears Market Revenue, By Distribution Channel, 2018 – 2023 (USD Million) 587

TABLE NO. 830. :. Middle East Medical Headgears Market Revenue, By Distribution Channel, 2024 – 2032 (USD Million) 587

TABLE NO. 831. :. UAE Medical Headgears Market Volume, By End-user, 2018 – 2023 (Mn Units) 588

TABLE NO. 832. :. UAE Medical Headgears Market Volume, By End-user, 2024 – 2032 (Mn Units) 588

TABLE NO. 833. :. UAE Medical Headgears Market Revenue, By End-user, 2018 – 2023 (USD Million) 589

TABLE NO. 834. :. UAE Medical Headgears Market Revenue, By End-user, 2024 – 2032 (USD Million) 589

TABLE NO. 835. :. UAE Medical Headgears Market Volume, By Material, 2018 – 2023 (Mn Units) 590

TABLE NO. 836. :. UAE Medical Headgears Market Volume, By Material, 2024 – 2032 (Mn Units) 590

TABLE NO. 837. :. UAE Medical Headgears Market Revenue, By Material, 2018 – 2023 (USD Million) 591

TABLE NO. 838. :. UAE Medical Headgears Market Revenue, By Material, 2024 – 2032 (USD Million) 591

TABLE NO. 839. :. UAE Medical Headgears Market Volume, By Type, 2018 – 2023 (Mn Units) 592

TABLE NO. 840. :. UAE Medical Headgears Market Volume, By Type, 2024 – 2032 (Mn Units) 592

TABLE NO. 841. :. UAE Medical Headgears Market Revenue, By Type, 2018 – 2023 (USD Million) 593

TABLE NO. 842. :. UAE Medical Headgears Market Revenue, By Type, 2024 – 2032 (USD Million) 593

TABLE NO. 843. :. UAE Medical Headgears Market Volume, By Application, 2018 – 2023 (Mn Units) 594

TABLE NO. 844. :. UAE Medical Headgears Market Volume, By Application, 2024 – 2032 (Mn Units) 594

TABLE NO. 845. :. UAE Medical Headgears Market Revenue, By Application, 2018 – 2023 (USD Million) 595

TABLE NO. 846. :. UAE Medical Headgears Market Revenue, By Application, 2024 – 2032 (USD Million) 595

TABLE NO. 847. :. UAE Medical Headgears Market Volume, By Distribution Channel, 2018 – 2023 (Mn Units) 596

TABLE NO. 848. :. UAE Medical Headgears Market Volume, By Distribution Channel, 2024 – 2032 (Mn Units) 596

TABLE NO. 849. :. UAE Medical Headgears Market Revenue, By Distribution Channel, 2018 – 2023 (USD Million) 597

TABLE NO. 850. :. UAE Medical Headgears Market Revenue, By Distribution Channel, 2024 – 2032 (USD Million) 597

TABLE NO. 851. :. KSA Medical Headgears Market Volume, By End-user, 2018 – 2023 (Mn Units) 598

TABLE NO. 852. :. KSA Medical Headgears Market Volume, By End-user, 2024 – 2032 (Mn Units) 598

TABLE NO. 853. :. KSA Medical Headgears Market Revenue, By End-user, 2018 – 2023 (USD Million) 599

TABLE NO. 854. :. KSA Medical Headgears Market Revenue, By End-user, 2024 – 2032 (USD Million) 599

TABLE NO. 855. :. KSA Medical Headgears Market Volume, By Material, 2018 – 2023 (Mn Units) 600

TABLE NO. 856. :. KSA Medical Headgears Market Volume, By Material, 2024 – 2032 (Mn Units) 600

TABLE NO. 857. :. KSA Medical Headgears Market Revenue, By Material, 2018 – 2023 (USD Million) 601

TABLE NO. 858. :. KSA Medical Headgears Market Revenue, By Material, 2024 – 2032 (USD Million) 601

TABLE NO. 859. :. KSA Medical Headgears Market Volume, By Type, 2018 – 2023 (Mn Units) 602

TABLE NO. 860. :. KSA Medical Headgears Market Volume, By Type, 2024 – 2032 (Mn Units) 602

TABLE NO. 861. :. KSA Medical Headgears Market Revenue, By Type, 2018 – 2023 (USD Million) 603

TABLE NO. 862. :. KSA Medical Headgears Market Revenue, By Type, 2024 – 2032 (USD Million) 603

TABLE NO. 863. :. KSA Medical Headgears Market Volume, By Application, 2018 – 2023 (Mn Units) 604

TABLE NO. 864. :. KSA Medical Headgears Market Volume, By Application, 2024 – 2032 (Mn Units) 604

TABLE NO. 865. :. KSA Medical Headgears Market Revenue, By Application, 2018 – 2023 (USD Million) 605

TABLE NO. 866. :. KSA Medical Headgears Market Revenue, By Application, 2024 – 2032 (USD Million) 605

TABLE NO. 867. :. KSA Medical Headgears Market Volume, By Distribution Channel, 2018 – 2023 (Mn Units) 606

TABLE NO. 868. :. KSA Medical Headgears Market Volume, By Distribution Channel, 2024 – 2032 (Mn Units) 606

TABLE NO. 869. :. KSA Medical Headgears Market Revenue, By Distribution Channel, 2018 – 2023 (USD Million) 607

TABLE NO. 870. :. KSA Medical Headgears Market Revenue, By Distribution Channel, 2024 – 2032 (USD Million) 607

TABLE NO. 871. :. Israel Medical Headgears Market Volume, By End-user, 2018 – 2023 (Mn Units) 608

TABLE NO. 872. :. Israel Medical Headgears Market Volume, By End-user, 2024 – 2032 (Mn Units) 608

TABLE NO. 873. :. Israel Medical Headgears Market Revenue, By End-user, 2018 – 2023 (USD Million) 609

TABLE NO. 874. :. Israel Medical Headgears Market Revenue, By End-user, 2024 – 2032 (USD Million) 609

TABLE NO. 875. :. Israel Medical Headgears Market Volume, By Material, 2018 – 2023 (Mn Units) 610

TABLE NO. 876. :. Israel Medical Headgears Market Volume, By Material, 2024 – 2032 (Mn Units) 610

TABLE NO. 877. :. Israel Medical Headgears Market Revenue, By Material, 2018 – 2023 (USD Million) 611

TABLE NO. 878. :. Israel Medical Headgears Market Revenue, By Material, 2024 – 2032 (USD Million) 611

TABLE NO. 879. :. Israel Medical Headgears Market Volume, By Type, 2018 – 2023 (Mn Units) 612

TABLE NO. 880. :. Israel Medical Headgears Market Volume, By Type, 2024 – 2032 (Mn Units) 612

TABLE NO. 881. :. Israel Medical Headgears Market Revenue, By Type, 2018 – 2023 (USD Million) 613

TABLE NO. 882. :. Israel Medical Headgears Market Revenue, By Type, 2024 – 2032 (USD Million) 613

TABLE NO. 883. :. Israel Medical Headgears Market Volume, By Application, 2018 – 2023 (Mn Units) 614

TABLE NO. 884. :. Israel Medical Headgears Market Volume, By Application, 2024 – 2032 (Mn Units) 614

TABLE NO. 885. :. Israel Medical Headgears Market Revenue, By Application, 2018 – 2023 (USD Million) 615

TABLE NO. 886. :. Israel Medical Headgears Market Revenue, By Application, 2024 – 2032 (USD Million) 615

TABLE NO. 887. :. Israel Medical Headgears Market Volume, By Distribution Channel, 2018 – 2023 (Mn Units) 616

TABLE NO. 888. :. Israel Medical Headgears Market Volume, By Distribution Channel, 2024 – 2032 (Mn Units) 616

TABLE NO. 889. :. Israel Medical Headgears Market Revenue, By Distribution Channel, 2018 – 2023 (USD Million) 617

TABLE NO. 890. :. Israel Medical Headgears Market Revenue, By Distribution Channel, 2024 – 2032 (USD Million) 617

TABLE NO. 891. :. Turkey Medical Headgears Market Volume, By End-user, 2018 – 2023 (Mn Units) 618

TABLE NO. 892. :. Turkey Medical Headgears Market Volume, By End-user, 2024 – 2032 (Mn Units) 618

TABLE NO. 893. :. Turkey Medical Headgears Market Revenue, By End-user, 2018 – 2023 (USD Million) 619

TABLE NO. 894. :. Turkey Medical Headgears Market Revenue, By End-user, 2024 – 2032 (USD Million) 619

TABLE NO. 895. :. Turkey Medical Headgears Market Volume, By Material, 2018 – 2023 (Mn Units) 620

TABLE NO. 896. :. Turkey Medical Headgears Market Volume, By Material, 2024 – 2032 (Mn Units) 620

TABLE NO. 897. :. Turkey Medical Headgears Market Revenue, By Material, 2018 – 2023 (USD Million) 621

TABLE NO. 898. :. Turkey Medical Headgears Market Revenue, By Material, 2024 – 2032 (USD Million) 621

TABLE NO. 899. :. Turkey Medical Headgears Market Volume, By Type, 2018 – 2023 (Mn Units) 622

TABLE NO. 900. :. Turkey Medical Headgears Market Volume, By Type, 2024 – 2032 (Mn Units) 622

TABLE NO. 901. :. Turkey Medical Headgears Market Revenue, By Type, 2018 – 2023 (USD Million) 623

TABLE NO. 902. :. Turkey Medical Headgears Market Revenue, By Type, 2024 – 2032 (USD Million) 623

TABLE NO. 903. :. Turkey Medical Headgears Market Volume, By Application, 2018 – 2023 (Mn Units) 624

TABLE NO. 904. :. Turkey Medical Headgears Market Volume, By Application, 2024 – 2032 (Mn Units) 624

TABLE NO. 905. :. Turkey Medical Headgears Market Revenue, By Application, 2018 – 2023 (USD Million) 625

TABLE NO. 906. :. Turkey Medical Headgears Market Revenue, By Application, 2024 – 2032 (USD Million) 625

TABLE NO. 907. :. Turkey Medical Headgears Market Volume, By Distribution Channel, 2018 – 2023 (Mn Units) 626

TABLE NO. 908. :. Turkey Medical Headgears Market Volume, By Distribution Channel, 2024 – 2032 (Mn Units) 626

TABLE NO. 909. :. Turkey Medical Headgears Market Revenue, By Distribution Channel, 2018 – 2023 (USD Million) 627

TABLE NO. 910. :. Turkey Medical Headgears Market Revenue, By Distribution Channel, 2024 – 2032 (USD Million) 627

TABLE NO. 911. :. Iran Medical Headgears Market Volume, By End-user, 2018 – 2023 (Mn Units) 628

TABLE NO. 912. :. Iran Medical Headgears Market Volume, By End-user, 2024 – 2032 (Mn Units) 628

TABLE NO. 913. :. Iran Medical Headgears Market Revenue, By End-user, 2018 – 2023 (USD Million) 629

TABLE NO. 914. :. Iran Medical Headgears Market Revenue, By End-user, 2024 – 2032 (USD Million) 629

TABLE NO. 915. :. Iran Medical Headgears Market Volume, By Material, 2018 – 2023 (Mn Units) 630

TABLE NO. 916. :. Iran Medical Headgears Market Volume, By Material, 2024 – 2032 (Mn Units) 630

TABLE NO. 917. :. Iran Medical Headgears Market Revenue, By Material, 2018 – 2023 (USD Million) 631

TABLE NO. 918. :. Iran Medical Headgears Market Revenue, By Material, 2024 – 2032 (USD Million) 631

TABLE NO. 919. :. Iran Medical Headgears Market Volume, By Type, 2018 – 2023 (Mn Units) 632

TABLE NO. 920. :. Iran Medical Headgears Market Volume, By Type, 2024 – 2032 (Mn Units) 632

TABLE NO. 921. :. Iran Medical Headgears Market Revenue, By Type, 2018 – 2023 (USD Million) 633

TABLE NO. 922. :. Iran Medical Headgears Market Revenue, By Type, 2024 – 2032 (USD Million) 633

TABLE NO. 923. :. Iran Medical Headgears Market Volume, By Application, 2018 – 2023 (Mn Units) 634

TABLE NO. 924. :. Iran Medical Headgears Market Volume, By Application, 2024 – 2032 (Mn Units) 634

TABLE NO. 925. :. Iran Medical Headgears Market Revenue, By Application, 2018 – 2023 (USD Million) 635

TABLE NO. 926. :. Iran Medical Headgears Market Revenue, By Application, 2024 – 2032 (USD Million) 635

TABLE NO. 927. :. Iran Medical Headgears Market Volume, By Distribution Channel, 2018 – 2023 (Mn Units) 636

TABLE NO. 928. :. Iran Medical Headgears Market Volume, By Distribution Channel, 2024 – 2032 (Mn Units) 636

TABLE NO. 929. :. Rest of Middle East Medical Headgears Market Revenue, By Distribution Channel, 2018 – 2023 (USD Million) 637

TABLE NO. 930. :. Rest of Middle East Medical Headgears Market Revenue, By Distribution Channel, 2024 – 2032 (USD Million) 637

TABLE NO. 931. :. Rest of Middle East Medical Headgears Market Volume, By End-user, 2018 – 2023 (Mn Units) 638

TABLE NO. 932. :. Rest of Middle East Medical Headgears Market Volume, By End-user, 2024 – 2032 (Mn Units) 638

TABLE NO. 933. :. Rest of Middle East Medical Headgears Market Revenue, By End-user, 2018 – 2023 (USD Million) 639

TABLE NO. 934. :. Rest of Middle East Medical Headgears Market Revenue, By End-user, 2024 – 2032 (USD Million) 639

TABLE NO. 935. :. Rest of Middle East Medical Headgears Market Volume, By Material, 2018 – 2023 (Mn Units) 640

TABLE NO. 936. :. Rest of Middle East Medical Headgears Market Volume, By Material, 2024 – 2032 (Mn Units) 640

TABLE NO. 937. :. Rest of Middle East Medical Headgears Market Revenue, By Material, 2018 – 2023 (USD Million) 641

TABLE NO. 938. :. Rest of Middle East Medical Headgears Market Revenue, By Material, 2024 – 2032 (USD Million) 641

TABLE NO. 939. :. Rest of Middle East Medical Headgears Market Volume, By Type, 2018 – 2023 (Mn Units) 642

TABLE NO. 940. :. Rest of Middle East Medical Headgears Market Volume, By Type, 2024 – 2032 (Mn Units) 642

TABLE NO. 941. :. Rest of Middle East Medical Headgears Market Revenue, By Type, 2018 – 2023 (USD Million) 643

TABLE NO. 942. :. Rest of Middle East Medical Headgears Market Revenue, By Type, 2024 – 2032 (USD Million) 643

TABLE NO. 943. :. Rest of Middle East Medical Headgears Market Volume, By Application, 2018 – 2023 (Mn Units) 644

TABLE NO. 944. :. Rest of Middle East Medical Headgears Market Volume, By Application, 2024 – 2032 (Mn Units) 644

TABLE NO. 945. :. Rest of Middle East Medical Headgears Market Revenue, By Application, 2018 – 2023 (USD Million) 645

TABLE NO. 946. :. Rest of Middle East Medical Headgears Market Revenue, By Application, 2024 – 2032 (USD Million) 645

TABLE NO. 947. :. Rest of Middle East Medical Headgears Market Volume, By Distribution Channel, 2018 – 2023 (Mn Units) 646

TABLE NO. 948. :. Rest of Middle East Medical Headgears Market Volume, By Distribution Channel, 2024 – 2032 (Mn Units) 646

TABLE NO. 949. :. Rest of Middle East Medical Headgears Market Revenue, By Distribution Channel, 2018 – 2023 (USD Million) 647

TABLE NO. 950. :. Rest of Middle East Medical Headgears Market Revenue, By Distribution Channel, 2024 – 2032 (USD Million) 647

TABLE NO. 951. :. Africa Medical Headgears Market Volume, By Country, 2018 – 2023 (Mn Units) 650

TABLE NO. 952. :. Africa Medical Headgears Market Volume, By Country, 2024 – 2032 (Mn Units) 650

TABLE NO. 953. :. Africa Medical Headgears Market Revenue, By Country, 2018 – 2023 (USD Million) 651

TABLE NO. 954. :. Africa Medical Headgears Market Revenue, By Country, 2024 – 2032 (USD Million) 651

TABLE NO. 955. :. Africa Medical Headgears Market Volume, By End-user, 2018 – 2023 (Mn Units) 652

TABLE NO. 956. :. Africa Medical Headgears Market Volume, By End-user, 2024 – 2032 (Mn Units) 652

TABLE NO. 957. :. Africa Medical Headgears Market Revenue, By End-user, 2018 – 2023 (USD Million) 653

TABLE NO. 958. :. Africa Medical Headgears Market Revenue, By End-user, 2024 – 2032 (USD Million) 653

TABLE NO. 959. :. Africa Medical Headgears Market Volume, By Material, 2018 – 2023 (Mn Units) 654

TABLE NO. 960. :. Africa Medical Headgears Market Volume, By Material, 2024 – 2032 (Mn Units) 654

TABLE NO. 961. :. Africa Medical Headgears Market Revenue, By Material, 2018 – 2023 (USD Million) 655

TABLE NO. 962. :. Africa Medical Headgears Market Revenue, By Material, 2024 – 2032 (USD Million) 655

TABLE NO. 963. :. Africa Medical Headgears Market Volume, By Type, 2018 – 2023 (Mn Units) 656

TABLE NO. 964. :. Africa Medical Headgears Market Volume, By Type, 2024 – 2032 (Mn Units) 656

TABLE NO. 965. :. Africa Medical Headgears Market Revenue, By Type, 2018 – 2023 (USD Million) 657

TABLE NO. 966. :. Africa Medical Headgears Market Revenue, By Type, 2024 – 2032 (USD Million) 657

TABLE NO. 967. :. Africa Medical Headgears Market Volume, By Application, 2018 – 2023 (Mn Units) 658

TABLE NO. 968. :. Africa Medical Headgears Market Volume, By Application, 2024 – 2032 (Mn Units) 658

TABLE NO. 969. :. Africa Medical Headgears Market Revenue, By Application, 2018 – 2023 (USD Million) 659

TABLE NO. 970. :. Africa Medical Headgears Market Revenue, By Application, 2024 – 2032 (USD Million) 659

TABLE NO. 971. :. Africa Medical Headgears Market Volume, By Distribution Channel, 2018 – 2023 (Mn Units) 660

TABLE NO. 972. :. Africa Medical Headgears Market Volume, By Distribution Channel, 2024 – 2032 (Mn Units) 660

TABLE NO. 973. :. Africa Medical Headgears Market Revenue, By Distribution Channel, 2018 – 2023 (USD Million) 661

TABLE NO. 974. :. Africa Medical Headgears Market Revenue, By Distribution Channel, 2024 – 2032 (USD Million) 661

TABLE NO. 975. :. South Africa Medical Headgears Market Volume, By End-user, 2018 – 2023 (Mn Units) 662

TABLE NO. 976. :. South Africa Medical Headgears Market Volume, By End-user, 2024 – 2032 (Mn Units) 662

TABLE NO. 977. :. South Africa Medical Headgears Market Revenue, By End-user, 2018 – 2023 (USD Million) 663

TABLE NO. 978. :. South Africa Medical Headgears Market Revenue, By End-user, 2024 – 2032 (USD Million) 663

TABLE NO. 979. :. South Africa Medical Headgears Market Volume, By Material, 2018 – 2023 (Mn Units) 664

TABLE NO. 980. :. South Africa Medical Headgears Market Volume, By Material, 2024 – 2032 (Mn Units) 664

TABLE NO. 981. :. South Africa Medical Headgears Market Revenue, By Material, 2018 – 2023 (USD Million) 665

TABLE NO. 982. :. South Africa Medical Headgears Market Revenue, By Material, 2024 – 2032 (USD Million) 665

TABLE NO. 983. :. South Africa Medical Headgears Market Volume, By Type, 2018 – 2023 (Mn Units) 666

TABLE NO. 984. :. South Africa Medical Headgears Market Volume, By Type, 2024 – 2032 (Mn Units) 666

TABLE NO. 985. :. South Africa Medical Headgears Market Revenue, By Type, 2018 – 2023 (USD Million) 667

TABLE NO. 986. :. South Africa Medical Headgears Market Revenue, By Type, 2024 – 2032 (USD Million) 667

TABLE NO. 987. :. South Africa Medical Headgears Market Volume, By Application, 2018 – 2023 (Mn Units) 668

TABLE NO. 988. :. South Africa Medical Headgears Market Volume, By Application, 2024 – 2032 (Mn Units) 668

TABLE NO. 989. :. South Africa Medical Headgears Market Revenue, By Application, 2018 – 2023 (USD Million) 669

TABLE NO. 990. :. South Africa Medical Headgears Market Revenue, By Application, 2024 – 2032 (USD Million) 669

TABLE NO. 991. :. South Africa Medical Headgears Market Volume, By Distribution Channel, 2018 – 2023 (Mn Units) 670

TABLE NO. 992. :. South Africa Medical Headgears Market Volume, By Distribution Channel, 2024 – 2032 (Mn Units) 670

TABLE NO. 993. :. South Africa Medical Headgears Market Revenue, By Distribution Channel, 2018 – 2023 (USD Million) 671

TABLE NO. 994. :. South Africa Medical Headgears Market Revenue, By Distribution Channel, 2024 – 2032 (USD Million) 671

TABLE NO. 995. :. Egypt Medical Headgears Market Volume, By End-user, 2018 – 2023 (Mn Units) 672

TABLE NO. 996. :. Egypt Medical Headgears Market Volume, By End-user, 2024 – 2032 (Mn Units) 672

TABLE NO. 997. :. Egypt Medical Headgears Market Revenue, By End-user, 2018 – 2023 (USD Million) 673

TABLE NO. 998. :. Egypt Medical Headgears Market Revenue, By End-user, 2024 – 2032 (USD Million) 673

TABLE NO. 999. :. Egypt Medical Headgears Market Volume, By Material, 2018 – 2023 (Mn Units) 674

TABLE NO. 1000. :                   Egypt Medical Headgears Market Volume, By Material, 2024 – 2032 (Mn Units) 674

TABLE NO. 1001. :                   Egypt Medical Headgears Market Revenue, By Material, 2018 – 2023 (USD Million) 675

TABLE NO. 1002. :                   Egypt Medical Headgears Market Revenue, By Material, 2024 – 2032 (USD Million) 675

TABLE NO. 1003. :                   Egypt Medical Headgears Market Volume, By Type, 2018 – 2023 (Mn Units) 676

TABLE NO. 1004. :                   Egypt Medical Headgears Market Volume, By Type, 2024 – 2032 (Mn Units) 676

TABLE NO. 1005. :                   Egypt Medical Headgears Market Revenue, By Type, 2018 – 2023 (USD Million) 677

TABLE NO. 1006. :                   Egypt Medical Headgears Market Revenue, By Type, 2024 – 2032 (USD Million) 677

TABLE NO. 1007. :                   Egypt Medical Headgears Market Volume, By Application, 2018 – 2023 (Mn Units) 678

TABLE NO. 1008. :                   Egypt Medical Headgears Market Volume, By Application, 2024 – 2032 (Mn Units) 678

TABLE NO. 1009. :                   Egypt Medical Headgears Market Revenue, By Application, 2018 – 2023 (USD Million) 679

TABLE NO. 1010. :                   Egypt Medical Headgears Market Revenue, By Application, 2024 – 2032 (USD Million) 679

TABLE NO. 1011. :                   Egypt Medical Headgears Market Volume, By Distribution Channel, 2018 – 2023 (Mn Units) 680

TABLE NO. 1012. :                   Egypt Medical Headgears Market Volume, By Distribution Channel, 2024 – 2032 (Mn Units) 680

TABLE NO. 1013. :                   Egypt Medical Headgears Market Revenue, By Distribution Channel, 2018 – 2023 (USD Million) 681

TABLE NO. 1014. :                   Egypt Medical Headgears Market Revenue, By Distribution Channel, 2024 – 2032 (USD Million) 681

TABLE NO. 1015. :                   Nigeria Medical Headgears Market Volume, By End-user, 2018 – 2023 (Mn Units) 682

TABLE NO. 1016. :                   Nigeria Medical Headgears Market Volume, By End-user, 2024 – 2032 (Mn Units) 682

TABLE NO. 1017. :                   Nigeria Medical Headgears Market Revenue, By End-user, 2018 – 2023 (USD Million) 683

TABLE NO. 1018. :                   Nigeria Medical Headgears Market Revenue, By End-user, 2024 – 2032 (USD Million) 683

TABLE NO. 1019. :                   Nigeria Medical Headgears Market Volume, By Material, 2018 – 2023 (Mn Units) 684

TABLE NO. 1020. :                   Nigeria Medical Headgears Market Volume, By Material, 2024 – 2032 (Mn Units) 684

TABLE NO. 1021. :                   Nigeria Medical Headgears Market Revenue, By Material, 2018 – 2023 (USD Million) 685

TABLE NO. 1022. :                   Nigeria Medical Headgears Market Revenue, By Material, 2024 – 2032 (USD Million) 685

TABLE NO. 1023. :                   Nigeria Medical Headgears Market Volume, By Type, 2018 – 2023 (Mn Units) 686

TABLE NO. 1024. :                   Nigeria Medical Headgears Market Volume, By Type, 2024 – 2032 (Mn Units) 686

TABLE NO. 1025. :                   Nigeria Medical Headgears Market Revenue, By Type, 2018 – 2023 (USD Million) 687

TABLE NO. 1026. :                   Nigeria Medical Headgears Market Revenue, By Type, 2024 – 2032 (USD Million) 687

TABLE NO. 1027. :                   Nigeria Medical Headgears Market Volume, By Application, 2018 – 2023 (Mn Units) 688

TABLE NO. 1028. :                   Nigeria Medical Headgears Market Volume, By Application, 2024 – 2032 (Mn Units) 688

TABLE NO. 1029. :                   Nigeria Medical Headgears Market Revenue, By Application, 2018 – 2023 (USD Million) 689

TABLE NO. 1030. :                   Nigeria Medical Headgears Market Revenue, By Application, 2024 – 2032 (USD Million) 689

TABLE NO. 1031. :                   Nigeria Medical Headgears Market Volume, By Distribution Channel, 2018 – 2023 (Mn Units) 690

TABLE NO. 1032. :                   Nigeria Medical Headgears Market Volume, By Distribution Channel, 2024 – 2032 (Mn Units) 690

TABLE NO. 1033. :                   Nigeria Medical Headgears Market Revenue, By Distribution Channel, 2018 – 2023 (USD Million) 691

TABLE NO. 1034. :                   Nigeria Medical Headgears Market Revenue, By Distribution Channel, 2024 – 2032 (USD Million) 691

TABLE NO. 1035. :                   Algeria Medical Headgears Market Volume, By End-user, 2018 – 2023 (Mn Units) 692

TABLE NO. 1036. :                   Algeria Medical Headgears Market Volume, By End-user, 2024 – 2032 (Mn Units) 692

TABLE NO. 1037. :                   Algeria Medical Headgears Market Revenue, By End-user, 2018 – 2023 (USD Million) 693

TABLE NO. 1038. :                   Algeria Medical Headgears Market Revenue, By End-user, 2024 – 2032 (USD Million) 693

TABLE NO. 1039. :                   Algeria Medical Headgears Market Volume, By Material, 2018 – 2023 (Mn Units) 694

TABLE NO. 1040. :                   Algeria Medical Headgears Market Volume, By Material, 2024 – 2032 (Mn Units) 694

TABLE NO. 1041. :                   Algeria Medical Headgears Market Revenue, By Material, 2018 – 2023 (USD Million) 695

TABLE NO. 1042. :                   Algeria Medical Headgears Market Revenue, By Material, 2024 – 2032 (USD Million) 695

TABLE NO. 1043. :                   Algeria Medical Headgears Market Volume, By Type, 2018 – 2023 (Mn Units) 696

TABLE NO. 1044. :                   Algeria Medical Headgears Market Volume, By Type, 2024 – 2032 (Mn Units) 696

TABLE NO. 1045. :                   Algeria Medical Headgears Market Revenue, By Type, 2018 – 2023 (USD Million) 697

TABLE NO. 1046. :                   Algeria Medical Headgears Market Revenue, By Type, 2024 – 2032 (USD Million) 697

TABLE NO. 1047. :                   Algeria Medical Headgears Market Volume, By Application, 2018 – 2023 (Mn Units) 698

TABLE NO. 1048. :                   Algeria Medical Headgears Market Volume, By Application, 2024 – 2032 (Mn Units) 698

TABLE NO. 1049. :                   Algeria Medical Headgears Market Revenue, By Application, 2018 – 2023 (USD Million) 699

TABLE NO. 1050. :                   Algeria Medical Headgears Market Revenue, By Application, 2024 – 2032 (USD Million) 699

TABLE NO. 1051. :                   Algeria Medical Headgears Market Volume, By Distribution Channel, 2018 – 2023 (Mn Units) 700

TABLE NO. 1052. :                   Algeria Medical Headgears Market Volume, By Distribution Channel, 2024 – 2032 (Mn Units) 700

TABLE NO. 1053. :                   Algeria Medical Headgears Market Revenue, By Distribution Channel, 2018 – 2023 (USD Million) 701

TABLE NO. 1054. :                   Algeria Medical Headgears Market Revenue, By Distribution Channel, 2024 – 2032 (USD Million) 701

TABLE NO. 1055. :                   Morocco Medical Headgears Market Volume, By End-user, 2018 – 2023 (Mn Units) 702

TABLE NO. 1056. :                   Morocco Medical Headgears Market Volume, By End-user, 2024 – 2032 (Mn Units) 702

TABLE NO. 1057. :                   Morocco Medical Headgears Market Revenue, By End-user, 2018 – 2023 (USD Million) 703

TABLE NO. 1058. :                   Morocco Medical Headgears Market Revenue, By End-user, 2024 – 2032 (USD Million) 703

TABLE NO. 1059. :                   Morocco Medical Headgears Market Volume, By Material, 2018 – 2023 (Mn Units) 704

TABLE NO. 1060. :                   Morocco Medical Headgears Market Volume, By Material, 2024 – 2032 (Mn Units) 704

TABLE NO. 1061. :                   Morocco Medical Headgears Market Revenue, By Material, 2018 – 2023 (USD Million) 705

TABLE NO. 1062. :                   Morocco Medical Headgears Market Revenue, By Material, 2024 – 2032 (USD Million) 705

TABLE NO. 1063. :                   Morocco Medical Headgears Market Volume, By Type, 2018 – 2023 (Mn Units) 706

TABLE NO. 1064. :                   Morocco Medical Headgears Market Volume, By Type, 2024 – 2032 (Mn Units) 706

TABLE NO. 1065. :                   Morocco Medical Headgears Market Revenue, By Type, 2018 – 2023 (USD Million) 707

TABLE NO. 1066. :                   Morocco Medical Headgears Market Revenue, By Type, 2024 – 2032 (USD Million) 707

TABLE NO. 1067. :                   Morocco Medical Headgears Market Volume, By Application, 2018 – 2023 (Mn Units) 708

TABLE NO. 1068. :                   Morocco Medical Headgears Market Volume, By Application, 2024 – 2032 (Mn Units) 708

TABLE NO. 1069. :                   Morocco Medical Headgears Market Revenue, By Application, 2018 – 2023 (USD Million) 709

TABLE NO. 1070. :                   Morocco Medical Headgears Market Revenue, By Application, 2024 – 2032 (USD Million) 709

TABLE NO. 1071. :                   Morocco Medical Headgears Market Volume, By Distribution Channel, 2018 – 2023 (Mn Units) 710

TABLE NO. 1072. :                   Morocco Medical Headgears Market Volume, By Distribution Channel, 2024 – 2032 (Mn Units) 710

TABLE NO. 1073. :                   Morocco Medical Headgears Market Revenue, By Distribution Channel, 2018 – 2023 (USD Million) 711

TABLE NO. 1074. :                   Morocco Medical Headgears Market Revenue, By Distribution Channel, 2024 – 2032 (USD Million) 711

TABLE NO. 1075. :                   Rest of Africa Medical Headgears Market Volume, By End-user, 2018 – 2023 (Mn Units) 712

TABLE NO. 1076. :                   Rest of Africa Medical Headgears Market Volume, By End-user, 2024 – 2032 (Mn Units) 712

TABLE NO. 1077. :                   Rest of Africa Medical Headgears Market Revenue, By End-user, 2018 – 2023 (USD Million) 713

TABLE NO. 1078. :                   Rest of Africa Medical Headgears Market Revenue, By End-user, 2024 – 2032 (USD Million) 713

TABLE NO. 1079. :                   Rest of Africa Medical Headgears Market Volume, By Material, 2018 – 2023 (Mn Units) 714

TABLE NO. 1080. :                   Rest of Africa Medical Headgears Market Volume, By Material, 2024 – 2032 (Mn Units) 714

TABLE NO. 1081. :                   Rest of Africa Medical Headgears Market Revenue, By Material, 2018 – 2023 (USD Million) 715

TABLE NO. 1082. :                   Rest of Africa Medical Headgears Market Revenue, By Material, 2024 – 2032 (USD Million) 715

TABLE NO. 1083. :                   Rest of Africa Medical Headgears Market Volume, By Type, 2018 – 2023 (Mn Units) 716

TABLE NO. 1084. :                   Rest of Africa Medical Headgears Market Volume, By Type, 2024 – 2032 (Mn Units) 716

TABLE NO. 1085. :                   Rest of Africa Medical Headgears Market Revenue, By Type, 2018 – 2023 (USD Million) 717

TABLE NO. 1086. :                   Rest of Africa Medical Headgears Market Revenue, By Type, 2024 – 2032 (USD Million) 717

TABLE NO. 1087. :                   Rest of Africa Medical Headgears Market Volume, By Application, 2018 – 2023 (Mn Units) 718

TABLE NO. 1088. :                   Rest of Africa Medical Headgears Market Volume, By Application, 2024 – 2032 (Mn Units) 718

TABLE NO. 1089. :                   Rest of Africa Medical Headgears Market Revenue, By Application, 2018 – 2023 (USD Million) 719

TABLE NO. 1090. :                   Rest of Africa Medical Headgears Market Revenue, By Application, 2024 – 2032 (USD Million) 719

TABLE NO. 1091. :                   Rest of Africa Medical Headgears Market Volume, By Distribution Channel, 2018 – 2023 (Mn Units) 720

TABLE NO. 1092. :                   Rest of Africa Medical Headgears Market Volume, By Distribution Channel, 2024 – 2032 (Mn Units) 720

TABLE NO. 1093. :                   Rest of Africa Medical Headgears Market Revenue, By Distribution Channel, 2018 – 2023 (USD Million) 721

TABLE NO. 1094. :                   Rest of Africa Medical Headgears Market Revenue, By Distribution Channel, 2024 – 2032 (USD Million) 721

Frequently Asked Questions

How does COVID-19 impact the global medical headgear market?

Medical headgear sales have not been significantly impacted by the COVID-19 pandemic, which has only resulted in some stress on the supply chain.

Which is the leading region of the market for medical headgear?

In 2022, North America held the largest revenue share of the global medical headgear market.

What are the key drivers for the growth of the medical headgear market?

The rise in orthopedic surgeries and growing safety concerns among healthcare professionals worldwide are major factors driving the expansion of the medical headgear market.

Which is the major segment in the medical headgear market by product type?

The LED segment had a major share in the global market in 2022.

Which is the major segment in the medical headgears market by end-user?

In 2022, the hospital’s segment held a major global market revenue share.

Clinical Rollators Market

Published:
Report ID: 35120

Automated Microscopy Market

Published:
Report ID: 35117

Anastomosis Devices Market

Published:
Report ID: 35112

Orthopedic Navigation Systems Market

Published:
Report ID: 35108

Laryngeal Stents Market

Published:
Report ID: 35102

Medical Copper Tubing Market

Published:
Report ID: 35098

Molecular Transport Medium Market

Published:
Report ID: 35092

Neurovascular Thrombectomy Device Market

Published:
Report ID: 35073

Diagnostic Imaging Centers Market

Published:
Report ID: 35050

Electric Stimulation Devices Market

Published:
Report ID: 35047

Angiotensin Converting Enzyme (ACE) Inhibitors Market

Published:
Report ID: 12832

Venipuncture Procedure Market

Published:
Report ID: 34886

Purchase Options

$2999
Delivery Format: Excel.
$4999
Designed for the individual purchaser.
$6999
Users located at a single corporate site or regional office.
$7999
Allowed for unlimited sharing globally within one company.
Smallform of Sample request

Have a question?

User Profile

Don’t settle for less – trust Mitul to help you find the best solution.

Report delivery within 24 to 48 hours

– Other Info –

What people say?-

User Review

I am very impressed with the information in this report. The author clearly did their research when they came up with this product and it has already given me a lot of ideas.

Jana Schmidt
CEDAR CX Technologies

– Connect with us –

Phone

+91 6232 49 3207


support

24/7 Research Support


sales@credenceresearch.com

– Research Methodology –

Going beyond the basics: advanced techniques in research methodology

– Trusted By –

Pepshi, LG, Nestle
Motorola, Honeywell, Johnson and johnson
LG Chem, SIEMENS, Pfizer
Unilever, Samsonite, QIAGEN