Market Overview
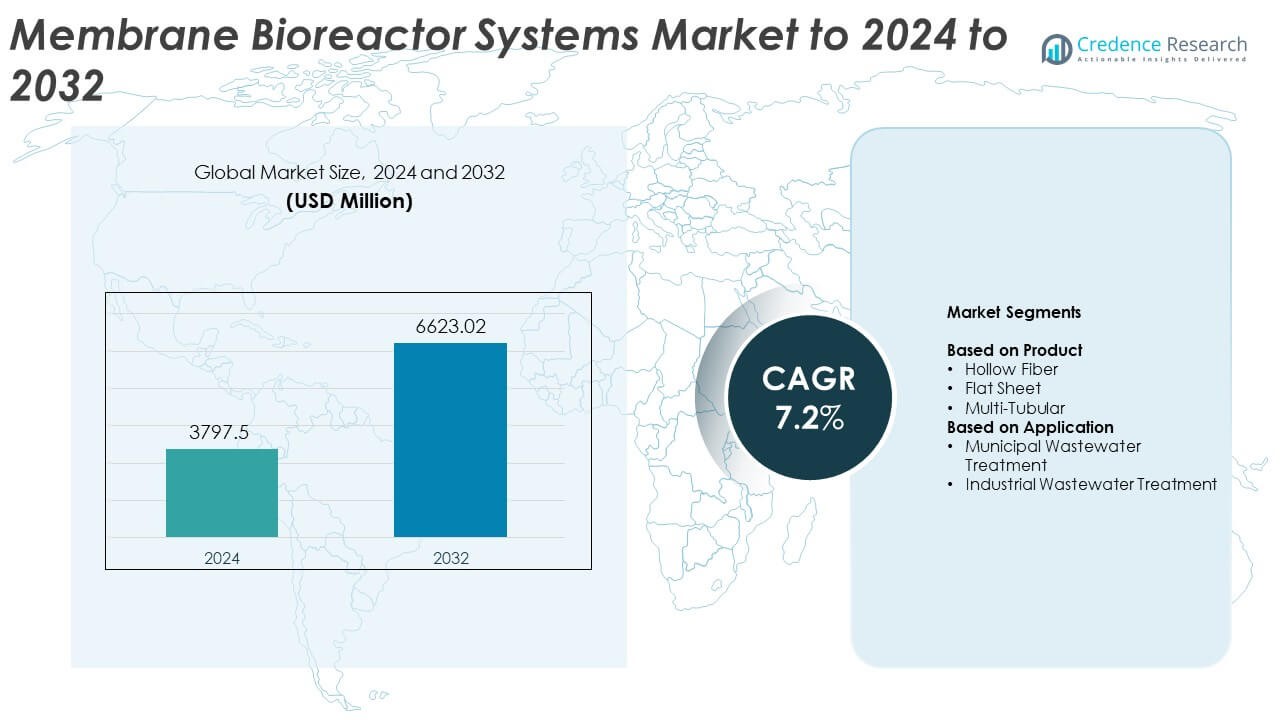
Membrane Bioreactor Systems Market size was valued at USD 3797.5 Million in 2024 and is anticipated to reach USD 6623.02 Million by 2032, at a CAGR of 7.2% during the forecast period.
| REPORT ATTRIBUTE |
DETAILS |
| Historical Period |
2020-2023 |
| Base Year |
2024 |
| Forecast Period |
2025-2032 |
| Membrane Bioreactor Systems Market Size 2024 |
USD 3797.5 Million |
| Membrane Bioreactor Systems Market, CAGR |
7.2% |
| Membrane Bioreactor Systems Market Size 2032 |
USD 6623.02 Million |
The Membrane Bioreactor Systems Market is shaped by leading companies such as Xylem, Pentair, Veolia, 3M, United Utilities Group PLC, DuPont, and SUEZ, each advancing membrane efficiency, automation, and large-scale treatment capabilities. These players compete by improving durability, lowering energy demand, and supporting reuse-focused wastewater programs across municipal and industrial facilities. Asia Pacific leads the market with about 34% share in 2024, driven by rapid urban growth and strong regulatory action. North America follows with nearly 31% due to advanced infrastructure upgrades, while Europe holds around 29% share supported by strict environmental standards and strong investments in high-performance treatment systems.
Access crucial information at unmatched prices!
Request your sample report today & start making informed decisions powered by Credence Research Inc.!
Download Sample
Market Insights
- The Membrane Bioreactor Systems Market reached USD 3797.5 Million in 2024 and is projected to hit USD 6623.02 Million by 2032, growing at a CAGR of 7.2%.
• Market growth is driven by rising wastewater reuse demand and stricter discharge norms that push municipalities and industries to adopt high-efficiency membrane treatment systems.
• Key trends include wider adoption of advanced membrane materials, automation for predictive maintenance, and growing demand for decentralized compact treatment units across fast-urbanizing regions.
• Competition intensifies as major players enhance membrane durability, expand modular system offerings, and focus on energy-efficient designs, while regional suppliers gain traction with cost-focused solutions.
• Asia Pacific leads with about 34% share in 2024, followed by North America with nearly 31% and Europe at around 29%, while Hollow Fiber remains the dominant product segment with about 57% share and Municipal Wastewater Treatment leads applications with roughly 63% share.
Market Segmentation Analysis:
By Product
Hollow Fiber leads this segment with about 57% share in 2024. This design dominates due to high packing density, lower energy use, and strong suitability for large municipal plants. Operators prefer Hollow Fiber modules because these membranes support continuous treatment with lower operational cost and stable filtration efficiency. Flat Sheet membranes hold steady adoption in small and medium facilities that need simple maintenance and robust durability. Multi Tubular systems expand in niche industrial uses where high-strength membranes handle heavy solids and complex effluents. Overall demand grows as wastewater treatment standards tighten and filtration reliability becomes a key priority.
- For instance, Toray MBR modules with PVDF flat-sheet membranes have been installed in numerous projects globally, contributing to a total accumulated plant capacity of over 1.3 million m³/day worldwide (as of March 2025).
By Application
Municipal Wastewater Treatment dominates this segment with nearly 63% share in 2024. Cities upgrade aging infrastructure and adopt advanced biological treatment to meet stricter discharge norms, boosting demand for membrane bioreactors. Urban population growth pushes municipalities to prefer compact MBR designs that save space and improve effluent quality. Industrial Wastewater Treatment grows steadily as industries adopt MBR systems to manage variable loads, chemical-resistant waste, and high-strength effluents. Rising regulatory compliance, tighter reuse standards, and a strong push toward sustainable operations continue to reinforce adoption across both segments.
- For instance, SUEZ confirmed that its Doha West MBR plant in Qatar operates at a verified treatment capacity of 280,000 m³/day, as published in SUEZ project documentation and on the website for Qatar’s Public Works Authority (Ashghal)
Key Growth Drivers
Rising Wastewater Reuse Requirements
Stricter discharge norms and water scarcity push governments and utilities to adopt advanced treatment technologies. Membrane bioreactor systems offer high effluent clarity, making them suitable for reuse in irrigation, cooling, and industrial processes. Urban areas rely on MBR units because compact layouts reduce land needs while maintaining strong biological performance. Rising reuse mandates in Asia, Europe, and the Middle East continue to stimulate steady investments, positioning MBR systems as a preferred choice for long-term water security.
- For instance, the ACCIONA-built Atotonilco wastewater treatment plant is one of the largest in the world, designed to treat an average flow of 35 m³/s, which is approximately 3,024,000 m³/dayduring the low-flow season, with a maximum capacity of 50 m³/s (4.32 million m³/day) during the rainy season.
Urban Population Growth and Infrastructure Upgrades
Expanding cities face increasing wastewater loads that require modern and reliable treatment solutions. MBR systems help municipalities manage rising volumes through high-capacity membranes and stable process efficiency. Utilities replace outdated conventional systems with MBRs to enhance operational stability and meet tougher regional regulations. Government funding for smart and resilient water networks supports further system adoption across both developed and emerging markets, driving consistent growth in the segment.
- For instance, Veolia’s public documents focus on overall environmental performance and sustainability initiatives, such as treating approximately 7 billion cubic meters of wastewater globally in 2024
Industrial Expansion and Regulatory Compliance
Industrial activity generates complex wastewater streams that demand advanced biological and membrane filtration. MBR systems provide reliable treatment for chemicals, pharmaceuticals, food processing, and electronics industries that operate under strict compliance rules. Companies adopt MBR units to meet zero-liquid-discharge pathways and reduce environmental penalties. Growing focus on eco-friendly operations increases interest in MBR systems that support reuse, reduce sludge production, and deliver high-quality effluent across diverse industries.
Key Trends and Opportunities
Advancements in Membrane Materials and Automation
New membrane coatings, higher flux designs, and improved fouling resistance support lower operating costs and longer system life. Automation, including AI-based monitoring and predictive maintenance tools, increases plant reliability and reduces downtime. Utilities and industries prefer digital MBR systems that optimize aeration control and process stability. These advancements create strong opportunities for manufacturers to deliver more efficient systems that suit both large-scale municipal facilities and decentralized treatment setups.
- For instance, Pentair X-Flow develops and manufactures membrane technology, including ultrafiltration (UF) and reverse osmosis (RO) membranes for various applications. While the company emphasizes performance improvements and efficiency gains in its marketing and product literature, such as a 10% higher flux with its XF75 elements compared to the XF64 using the same energy.
Growing Demand for Decentralized Treatment Systems
Decentralized wastewater treatment gains traction as communities, resorts, and industrial parks seek compact and modular solutions. MBR systems enable onsite treatment with consistent effluent quality, supporting reuse and reducing pressure on central networks. Rising construction in remote, peri-urban, and off-grid areas strengthens adoption of packaged MBR units. Developers and facility managers value easy installation, smaller footprints, and compliance alignment, creating wider opportunities for market players.
- For instance, Fluence Corporation has deployed hundreds of MABR (membrane aerated biofilm reactor) systems around the world, packaged in its containerized Aspiral™ solutions. The Aspiral family offers several models, such as the S1 (up to 50 m³/day) and L4 (up to 200 m³/day), with individual unit capacities ranging from 20 to 350 m³/day depending on site-specific requirements.
Key Challenges
High Capital and Operating Costs
MBR systems require significant investment in membranes, aeration equipment, and advanced controls. Many small municipalities and industries face budget constraints that delay adoption, despite long-term efficiency benefits. Operational challenges related to membrane fouling increase energy use and maintenance frequency. These cost factors continue to limit wide-scale deployment in price-sensitive regions, slowing growth in low-income markets.
Operational Complexity and Skilled Workforce Shortage
MBR systems rely on precise biological balance and membrane management, requiring trained operators to ensure consistent performance. Many regions face a shortage of skilled technicians capable of handling digital controls, membrane cleaning cycles, and troubleshooting. Inadequate workforce availability leads to inefficiencies, improper maintenance, and higher operational risks. This challenge restricts adoption in developing markets where technical expertise remains limited.
Regional Analysis
North America
North America holds about 31% share in 2024, driven by advanced wastewater regulations, strong municipal budgets, and rising reuse programs across the United States and Canada. Utilities upgrade aging plants to meet stricter nutrient removal targets, encouraging the adoption of membrane bioreactor systems. Industrial users in food processing, pharmaceuticals, and electronics also deploy MBR units to comply with discharge rules. Growing investments in decentralized treatment and sustainable infrastructure further strengthen regional growth, supported by technology-focused suppliers active in the market.
Europe
Europe accounts for nearly 29% share in 2024, supported by long-standing environmental policies and strong adoption of high-performance wastewater treatment technologies. Countries such as Germany, France, the United Kingdom, and the Netherlands continue investing in nutrient reduction systems and advanced effluent quality upgrades. Municipal utilities prefer membrane bioreactor systems for compact design and consistent treatment outcomes. Industrial facilities also integrate MBRs to meet strict EU discharge directives. Ongoing circular water initiatives and increased focus on reuse programs continue to enhance demand across the region.
Asia Pacific
Asia Pacific leads the global market with around 34% share in 2024, driven by rapid urbanization, heavy industrial expansion, and rising pressure on freshwater supplies. China, India, Japan, and South Korea invest heavily in modern wastewater treatment to meet tightening environmental regulations. Municipalities adopt membrane bioreactor systems for large population centers, while industries rely on MBRs to manage complex effluents. Government-led infrastructure programs and increased funding for smart water management boost regional growth, making Asia Pacific the strongest and fastest-growing market.
Latin America
Latin America holds roughly 4% share in 2024, with rising attention to improving wastewater treatment coverage in developing urban areas. Countries including Brazil, Mexico, and Chile adopt membrane bioreactor systems to address growing pollution and expand compliance with national discharge standards. Industrial zones also show increasing interest as companies face stricter environmental oversight. Although investment levels remain uneven across the region, expanding infrastructure programs and greater focus on water reuse provide steady growth opportunities for MBR vendors.
Middle East and Africa
Middle East and Africa represent about 2% share in 2024, driven by strong demand for high-efficiency treatment solutions in water-scarce countries. Gulf nations prioritize membrane bioreactor systems for municipal and industrial reuse, supporting long-term sustainability goals. Industrial sectors, including petrochemical and food processing, adopt MBRs to meet regulated discharge limits. In Africa, uptake remains gradual but improves with expanding urban development and increasing focus on sanitation projects. Limited budgets challenge widespread adoption, yet targeted investments continue to create selective growth pockets.
Market Segmentations:
By Product
- Hollow Fiber
- Flat Sheet
- Multi-Tubular
By Application
- Municipal Wastewater Treatment
- Industrial Wastewater Treatment
By Geography
- North America
- Europe
- Germany
- France
- U.K.
- Italy
- Spain
- Rest of Europe
- Asia Pacific
- China
- Japan
- India
- South Korea
- South-east Asia
- Rest of Asia Pacific
- Latin America
- Brazil
- Argentina
- Rest of Latin America
- Middle East & Africa
- GCC Countries
- South Africa
- Rest of the Middle East and Africa
Competitive Landscape
The Membrane Bioreactor Systems Market features major participants such as Xylem, Pentair, Veolia, 3M, United Utilities Group PLC, DuPont, and SUEZ in the competitive landscape. These companies strengthen their positions through continuous investments in membrane innovation, digital monitoring platforms, and energy-efficient process controls that enhance operational stability. Manufacturers focus on expanding product portfolios with advanced modules designed to reduce fouling, extend membrane life, and lower aeration demand. Many players pursue partnerships with municipal authorities, EPC contractors, and industrial operators to secure long-term treatment projects. The market also sees rising competition from regional suppliers offering cost-effective systems for decentralized and mid-scale applications. Strategic moves such as facility expansions, technology licensing, and integration of automation tools further support competitive differentiation.
Shape Your Report to Specific Countries or Regions & Enjoy 30% Off!
Key Player Analysis
- Xylem (U.S.)
- Pentair (U.K.)
- Veolia (France)
- 3M (U.S.)
- United Utilities Group PLC (U.K.)
- DuPont (U.S.)
- SUEZ (France)
Recent Developments
- In 2025, SUEZ (as part of a consortium for the Greater Paris Sanitation Authority – SIAAP) commissioned a new, large-scale biogas production unit at the Seine Aval wastewater treatment plant in Paris.
- In 2025, Veolia established new benchmarks for large-scale water reuse projects, including its role in France’s largest treated wastewater reuse project in Argelès-sur-Mer.
- In 2025, DuPont deployed its MemPulse™ membrane bioreactor (MBR) system combined with OxyMem™ membrane aerated bioreactor (MABR) technology in a new 6.0 MLD wastewater treatment plant in Raglan, New Zealand.
Report Coverage
The research report offers an in-depth analysis based on Product, Application and Geography. It details leading market players, providing an overview of their business, product offerings, investments, revenue streams, and key applications. Additionally, the report includes insights into the competitive environment, SWOT analysis, current market trends, as well as the primary drivers and constraints. Furthermore, it discusses various factors that have driven market expansion in recent years. The report also explores market dynamics, regulatory scenarios, and technological advancements that are shaping the industry. It assesses the impact of external factors and global economic changes on market growth. Lastly, it provides strategic recommendations for new entrants and established companies to navigate the complexities of the market.
Future Outlook
- The market will expand as water reuse becomes a central priority worldwide.
- Municipal plants will adopt more compact membrane bioreactor designs to save space.
- Industrial users will increase installation to meet stricter discharge and sustainability rules.
- New membrane materials will reduce fouling and lower long-term operating costs.
- Automation and AI-based monitoring will improve system reliability and efficiency.
- Decentralized treatment units will gain traction in remote and fast-growing urban areas.
- Energy-efficient aeration systems will support wider adoption across budget-sensitive regions.
- Government funding for wastewater upgrades will strengthen market penetration.
- Manufacturers will focus on modular, plug-and-play systems for quicker deployment.
- Rising climate pressures will drive demand for advanced wastewater treatment technologies.


