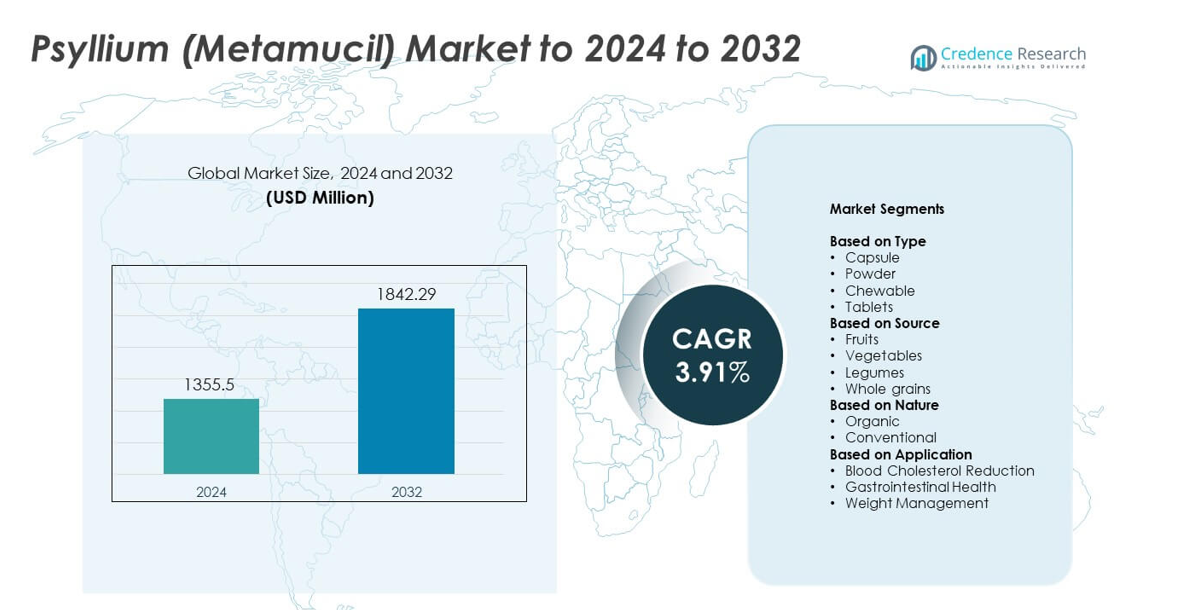
food and beverage
Home » Metamucil Market

Metamucil Market By Type (Capsule, Powder, Chewable, Tablets) By Source (Fruits, Vegetables, Legumes, Whole grains) By Nature (Organic, Conventional) By Application (Blood Cholesterol Reduction, Gastrointestinal Health, Weight Management) – Growth, Future Prospects & Competitive Analysis, 2016 – 2028

Price: $4999

Published: | Report ID: 9568 | Category: Food & Beverage

About this report

The global Metamucil market report explores the critical analysis of the Metamucil industry using key parameters. The report consists of investment strategies, the need for investments in the Metamucil industry, and the multiple benefits for the investors. Importantly, this report sets out major changes in the global technical regulations for the Metamucil industry and how economic and non-economic barriers are helping the Metamucil market grow. Moreover, the report analyzes the global, regional, and country-level historic and forecasted market size. The report also provides a comprehensive analysis of key investment propositions, demand and supply gap, competitors positioning, STAR analysis, SRC analysis, and Tornado analysis. Key technological developments and other analyses such as porter’s five forces analysis, PESTEL analysis, value chain analysis, etc.

REPORT ATTRIBUTE DETAILS
Metamucil Market by Volume Yes
Metamucil Market by Value Yes
Metamucil Market, Tornado Analysis Yes
Metamucil Market, STAR Analysis Yes
Metamucil Market, SRC Analysis Yes
Metamucil Market, Import-Export Data Yes (On Demand)
Metamucil Market Pricing Analysis Yes (On Demand)
Metamucil Market Segment Analysis By Type (Capsule, Powder, Chewable, and Tablets)

By Source (Fruits, Vegetables, Legumes, and Whole grains)

By Nature (Organic and Conventional)

By Application (Blood Cholesterol Reduction, Gastrointestinal Health, and Weight Management)

Metamucil Market, Regional Analysis North America (US and Canada)

Europe (Germany, UK, France, Italy, Spain, and Rest of Europe)

Asia Pacific (China, India, Japan, South Korea, South East Asia, and Rest of Asia Pacific)

Latin America (Brazil, Mexico, and Rest of Latin America)

Middle East and Africa (GCC Countries, South Africa, and Rest of Middle East and Africa)

Metamucil Market Key Companies Robinson Pharma, Inc., Renew Life, Benefiber, Citrucel, Metamucil, Walgreens, Now, Optimum Nutrition, BarnDad’s, Myogenix, Twinlab,  Garden of Life, and SPECIES
Metamucil Market Competitive Landscape Market Share Analysis

Competitive Benchmarking

Key Players Market Positioning

Geographical Presence Analysis

Major Strategies Adopted

Key Highlights of the report

How are the major segments performing in the Metamucil market?

  • In 2021, the whole grain accounted for the largest share of the market as it is widely used as dietary fiber and Metamucil.
  • In 2021, the conventional segment was anticipated to hold a prominent share in the global Metamucil market as it is widely used due to its relative cost efficiency.

Which region dominated the Metamucil market?

Asia Pacific Metamucil market is predicted to experience the highest CAGR between 2022 and 2028. In 2021, Asia Pacific dominated the market and took up more than 39.0% of worldwide revenue. It is anticipated that China, Indonesia, and Japan will top the world in food and beverage products in the upcoming years. During the projected years, it is anticipated that positive trends in the Asia Pacific food and beverage industry will increase demand for Metamucil.

Design Element 2

Access crucial information at unmatched prices!

Request your free sample report today & start making informed decisions powered by Credence Research!

CTA Design Element 3

How is US Market performing in the Metamucil market?

Over 60 to 70 million Americans face various digestive health difficulties, according to a National Institutes of Health study. Furthermore, according to the Harvard School of Public Health, adults and children require at least 20 to 30 grams of dietary fiber daily. Consuming dietary fiber also lowers the chance of developing certain diseases, such as diabetes, heart disease, diverticular disease, and constipation. The above elements are anticipated to boost demand for Metamucil in the US.

What is the competitive environment of the Metamucil market?

The Metamucil industry’s competitive environment provides information on the entire economic profit made by suppliers and businesses, the sales and revenues created in this sector, the Metamucil market share globally, the business organization summary, the introduction of new products, and the opportunities for the Metamucil market.

Executive Summary

What is Metamucil?

An added source of fiber is Metamucil. Metamucil, first offered in 1934 by G. D. Searle & Company, was purchased by Procter & Gamble in 1985. The name mixes the fiber class it uses (mucilage) and the Greek word for change (meta). As a “behind the counter” brand in its early years, Metamucil managed occasional drug-store distribution. The brand has been promoted to consumers through print and television advertising since 1974 when it started to be sold in eating establishments. Versions with flavors were introduced in 1979.

Which are the key investments by the Metamucil market players?

Leading players operating in the Metamucil market are focusing on expansion in production capacities for Metamucil. Players are also concentrating on strategic mergers, acquisitions, and collaborations to gain a competitive edge. For instance, Over four times more gastroenterologists (GEs) recommended the Fiber Choice line ®’s of chewable prebiotic fiber gummies and tablets in 2018 than the next-closest branded rival. A major line of fiber supplements called FiberChoice has been bought by Caret Pharma, a Caret Group affiliate. Caret Pharma wants to grow its medical food sector with this acquisition.

Some major players in the Metamucil market are Robinson Pharma, Inc., Renew Life, Benefiber, Citrucel, Metamucil, Walgreens, Now, Optimum Nutrition, BarnDad’s, Myogenix, Twinlab,  Garden of Life, and SPECIES.

What are the Major Driving Factors for the Metamucil Market?

People’s eating patterns and lives are changing significantly, so fiber-rich supplements are becoming more popular. People in emerging nations and economies with high rates of economic growth work long hours to make ends meet, resulting in a decrease in the number of nutrients they consume daily. This is the main factor fueling the rise of the overall market for fiber supplements. The global development of the fiber supplement market is driven by changes in dietary habits and a serious lack of fiber consumption among people. Additionally, dietitians advise consumers to take fiber supplements to ensure that their bodies are getting enough of the substance. A growing understanding of the value of fiber for the body and how a lack of it can harm the body is a key driver propelling the market’s growth for fiber supplements.

What are the Major Risks for the Metamucil Market?

A major obstacle to the market entry of fiber supplements is the FDA’s strict rules. Reviewing and approving a product is time-consuming and expensive, and the manufacturing stage may result in high production expenses. Additionally, a rise in adulterated and misbranded products and false claims on labels has eroded customer confidence in fiber supplements. These elements will probably prevent the market for fiber supplements from expanding.

Which is the key application in the Metamucil market?

The potassium hydroxide segment is expected to hold a larger share of the global potassium market during the forecast period. Potassium hydroxide is an inorganic combination with the formula KOH and is also comprehended as potash lye, lye, or caustic potash. Potassium hydroxide is created by the reaction of potassium carbonate and calcium hydroxide. This is a salt metathesis response and gives precipitation of solid calcium carbonate and exits potassium hydroxide in the solution. It forms a clear solution with water and white to barely yellow lumps, flakes, pellets, or rods in solid form. It is effortlessly soluble in almost all liquids, such as water, ethanol, methanol, and glycerine. It is non-combustible but positively corrosive and has a moderately intense melting point. Potassium hydroxide is mostly utilized in the food industry, chemical manufacturing, soft soap, and petroleum refining.

How is the Metamucil market performing in regions?

The Asia Pacific market is anticipated to see the highest CAGR in revenue between 2022 and 2028. Asia Pacific dominated the market and earned more than 39.0% of global revenue in 2021. China, Indonesia, and Japan are expected to produce more food and beverages than any other country in the following years. Positive developments in the Asia Pacific food and beverage sector will likely boost demand for Metamucil during the forecasted years. Due to their exposure to foreign food goods, Chinese consumers are now following worldwide food trends. Since nutritional intake became a concern for many people when making food decisions during COVID-19, consumers are thus seen to have a higher desire for healthy items with significant nutritional advantages, which may aid in market expansion.

From 2022 to 2028, the North American Metamucil market is anticipated to grow at a faster CAGR. In 2021, the biggest market for items that improve health and immunity was North America. Consumer awareness of the components in packaged food products has led to a significant evolution in the region’s nutritional care industry. Consuming dietary fiber is now extremely important due to North America’s new popular diets and lifestyles.

What is the regulatory landscape for the Metamucil market?

A major obstacle to the market entry of fiber supplements is the FDA’s strict rules. Reviewing and approving a product is time-consuming and expensive, and the manufacturing stage may result in high production expenses.

What is the Market Size of Metamucil regarding value?

The global Metamucil market is anticipated to grow at a substantial CAGR of 6.1% in the upcoming years. The global Metamucil industry was estimated to be worth USD 18.1 billion in 2021 and was expected to be worth USD 25.8 billion by 2028.

Shape Your Report to Specific Countries or Regions & Enjoy 30% Off!

What are the major players planning for the future of the Metamucil market?

Fresh and creative promotional tactics are also fueling the adoption of fiber supplements. Nutraceutical businesses are experimenting with various fibers to create fiber supplements that taste nice and propel the market toward growth.

Segmentation of Global Metamucil Market-

Global Metamucil Market – By Type

  • Capsule
  • Powder
  • Chewable
  • Tablets

Global Metamucil Market – By Source

  • Fruits
  • Vegetables
  • Legumes
  • Whole grains

Global Metamucil Market – By Nature

  • Organic
  • Conventional

Global Metamucil Market – By Application

  • Blood Cholesterol Reduction
  • Gastrointestinal Health
  • Weight Management

Global Metamucil Market – By Region

  • North America
    • US
    • Canada
  • Europe
    • Germany
    • France
    • UK.
    • Italy
    • Spain
    • Rest of Europe
  • Asia Pacific
    • China
    • Japan
    • India
    • South Korea
    • South-east Asia
    • Rest of Asia Pacific
  • Latin America
    • Brazil
    • Mexico
    • Rest of Latin America
  • Middle East & Africa
    • GCC Countries
    • South Africa
    • Rest of Middle East and Africa

1. Preface
1.1. Report Description
1.1.1. Purpose of the Report
1.1.2. Target Audience
1.1.3. USP and Key Offerings
1.2. Research Scope
1.3. Research Methodology
1.3.1. Phase I – Secondary Research
1.3.2. Phase II – Primary Research
1.3.3. Phase III – Expert Panel Review
1.3.4. Approach Adopted
1.3.4.1. Top-Down Approach
1.3.4.2. Bottom-Up Approach
1.3.5. Assumptions
1.4. Market Segmentation

2. Executive Summary
2.1. Market Snapshot: Global Metamucil Market
2.2. Global Metamucil Market, By Type
2.3. Global Metamucil Market, By Source
2.4. Global Metamucil Market, By Nature
2.5. Global Metamucil Market, By Application
2.6. Global Metamucil Market, By Region

3. Market Dynamics & Factors Analysis
3.1. Introduction
3.1.1. Global Metamucil Market Value, 2016-2028, (US$ Bn)
3.2. Market Dynamics
3.2.1. Key Growth Trends
3.2.2. Market Drivers
3.2.3. Market Restraints
3.2.4. Market Opportunities
3.2.5. Major Industry Challenges
3.3. Attractive Investment Proposition,2021
3.3.1. Type
3.3.2. Source
3.3.3. Nature
3.3.4. Application
3.3.5. Geography

4. Premium Insights
4.1. STAR (Situation, Task, Action, Results) Analysis
4.2. Porter’s Five Forces Analysis
4.2.1. Threat of New Entrants
4.2.2. Bargaining Power of Buyers/Consumers
4.2.3. Bargaining Power of Suppliers
4.2.4. Threat of Substitute Types
4.2.5. Intensity of Competitive Rivalry
4.3. Value Chain Analysis
4.4. Technology Analysis
4.5. Marketing Strategy Analysis
4.5.1. Direct Marketing
4.5.2. Indirect Marketing
4.5.3. Marketing Channel Development Trend

5. Market Positioning of Key Players, 2021
5.1. Company market share of key players, 2021
5.2. Competitive Benchmarking
5.3. Market Positioning of Key Vendors
5.4. Geographical Presence Analysis
5.5. Major Strategies Adopted by Key Players
5.5.1. Key Strategies Analysis
5.5.2. Mergers and Acquisitions
5.5.3. Partnerships
5.5.4. Product Launch
5.5.5. Geographical Expansion
5.5.6. Others

6. COVID 19 Impact Analysis
6.1. Global Metamucil Market Pre Vs Post COVID 19, 2019 – 2028
6.2. Impact on Import & Export
6.3. Impact on Demand & Supply

7. Global Metamucil Market
7.1. Global Metamucil Market, By Type, 2016-2028(US$ Bn)
7.1.1. Overview
7.1.2. Global Metamucil Market, By Type, 2021 vs 2028 (in%)
7.1.3. Global Metamucil Market, By Capsule, 2016-2028 (US$ Bn)
7.1.4. Global Metamucil Market, By Powder, 2016-2028 (US$ Bn)
7.1.5. Global Metamucil Market, By Chewable, 2016-2028 (US$ Bn)
7.1.6. Global Metamucil Market, By Tablet, 2016-2028 (US$ Bn)
7.2. Global Metamucil Market, By Source, 2016-2028(US$ Bn)
7.2.1. Overview
7.2.2. Global Metamucil Market, By Source, 2021 vs 2028 (in%)
7.2.3. Global Metamucil Market, By Fruits, 2016-2028 (US$ Bn)
7.2.4. Global Metamucil Market, By Vegetables, 2016-2028 (US$ Bn)
7.2.5. Global Metamucil Market, By Legumes, 2016-2028 (US$ Bn)
7.2.6. Global Metamucil Market, By Whole Grain, 2016-2028 (US$ Bn)
7.3. Global Metamucil Market, By Nature, 2016-2028(US$ Bn)
7.3.1. Overview
7.3.2. Global Metamucil Market, By Nature, 2021 vs 2028 (in%)
7.3.3. Global Metamucil Market, By Organic, 2016-2028 (US$ Bn)
7.3.4. Global Metamucil Market, By Conventional, 2016-2028 (US$ Bn)
7.4. Global Metamucil Market, By Application, 2016-2028(US$ Bn)
7.4.1. Overview
7.4.2. Global Metamucil Market, By Application, 2021 vs 2028 (in%)
7.4.3. Global Metamucil Market, By Blood Cholesterol Reduction, 2016-2028 (US$ Bn)
7.4.4. Global Metamucil Market, By Gastrointestinal Health, 2016-2028 (US$ Bn)
7.4.5. Global Metamucil Market, By Weight Management, 2016-2028 (US$ Bn)

8. North America Metamucil Market Analysis
8.1. North America Metamucil Market, By Type, 2016-2028(US$ Bn)
8.1.1. Overview
8.1.2. SRC Analysis
8.2. North America Metamucil Market, By Source, 2016-2028(US$ Bn)
8.2.1. Overview
8.2.2. SRC Analysis
8.3. North America Metamucil Market, By Nature, 2016-2028(US$ Bn)
8.3.1. Overview
8.3.2. SRC Analysis
8.4. North America Metamucil Market, By Application, 2016-2028(US$ Bn)
8.4.1. Overview
8.4.2. SRC Analysis
8.5. North America Metamucil Market, by Country, 2016-2028 (US$ Bn)
8.5.1. U.S.
8.5.1.1. U.S. Metamucil Market Estimates and Forecast, 2016-2028 (US$ Bn)
8.5.1.2. U.S. Metamucil, By Type, 2016-2028 (US$ Bn)
8.5.1.3. U.S. Metamucil, By Source, 2016-2028 (US$ Bn)
8.5.1.4. U.S. Metamucil, By Nature, 2016-2028 (US$ Bn)
8.5.1.5. U.S. Metamucil, By Applicationr, 2016-2028 (US$ Bn)
8.5.2. Canada
8.5.2.1. Canada Metamucil Market Estimates and Forecast, 2016-2028 (US$ Bn)
8.5.2.2. Canada Metamucil, By Type, 2016-2028 (US$ Bn)
8.5.2.3. Canada Metamucil, By Source, 2016-2028 (US$ Bn)
8.5.2.4. Canada Metamucil, By Nature, 2016-2028 (US$ Bn)
8.5.2.5. Canada Metamucil, By Applicationr, 2016-2028 (US$ Bn)

9. Europe Metamucil Market Analysis
9.1. Europe Metamucil Market, By Type, 2016-2028(US$ Bn)
9.1.1. Overview
9.1.2. SRC Analysis
9.2. Europe Metamucil Market, By Source, 2016-2028(US$ Bn)
9.2.1. Overview
9.2.2. SRC Analysis
9.3. Europe Metamucil Market, By Nature, 2016-2028(US$ Bn)
9.3.1. Overview
9.3.2. SRC Analysis
9.4. Europe Metamucil Market, By Application, 2016-2028(US$ Bn)
9.4.1. Overview
9.4.2. SRC Analysis
9.5. Europe Metamucil Market, by Country, 2016-2028 (US$ Bn)
9.5.1. Germany
9.5.1.1. Germany Metamucil Market Estimates and Forecast, 2016-2028 (US$ Bn)
9.5.1.2. Germany Metamucil, By Type, 2016-2028 (US$ Bn)
9.5.1.3. Germany Metamucil, By Source, 2016-2028 (US$ Bn)
9.5.1.4. Germany Metamucil, By Nature, 2016-2028 (US$ Bn)
9.5.1.5. Germany Metamucil, By Applicationr, 2016-2028 (US$ Bn)
9.5.2. France
9.5.2.1. France Metamucil Market Estimates and Forecast, 2016-2028 (US$ Bn)
9.5.2.2. France Metamucil, By Type, 2016-2028 (US$ Bn)
9.5.2.3. France Metamucil, By Source, 2016-2028 (US$ Bn)
9.5.2.4. France Metamucil, By Nature, 2016-2028 (US$ Bn)
9.5.2.5. France Metamucil, By Application, 2016-2028 (US$ Bn)
9.5.3. UK
9.5.3.1. UK Metamucil Market Estimates and Forecast, 2016-2028 (US$ Bn)
9.5.3.2. UK Metamucil, By Type, 2016-2028 (US$ Bn)
9.5.3.3. UK Metamucil, By Source, 2016-2028 (US$ Bn)
9.5.3.4. UK Metamucil, By Nature, 2016-2028 (US$ Bn)
9.5.3.5. UK Metamucil, By Applicationr, 2016-2028 (US$ Bn)
9.5.4. Italy
9.5.4.1. Italy Metamucil Market Estimates and Forecast, 2016-2028 (US$ Bn)
9.5.4.2. Italy Metamucil, By Type, 2016-2028 (US$ Bn)
9.5.4.3. Italy Metamucil, By Source, 2016-2028 (US$ Bn)
9.5.4.4. Italy Metamucil, By Nature, 2016-2028 (US$ Bn)
9.5.4.5. Italy Metamucil, By Applicationr, 2016-2028 (US$ Bn)
9.5.5. Spain
9.5.5.1. Spain Metamucil Market Estimates and Forecast, 2016-2028 (US$ Bn)
9.5.5.2. Spain Metamucil, By Type, 2016-2028 (US$ Bn)
9.5.5.3. Spain Metamucil, By Source, 2016-2028 (US$ Bn)
9.5.5.4. Spain Metamucil, By Nature, 2016-2028 (US$ Bn)
9.5.5.5. Spain Metamucil, By Applicationr, 2016-2028 (US$ Bn)
9.5.6. Rest of Europe
9.5.6.1. Rest of Europe Metamucil Market Estimates and Forecast, 2016-2028 (US$ Bn)
9.5.6.2. Rest of Europe Metamucil, By Type, 2016-2028 (US$ Bn)
9.5.6.3. Rest of Europe Metamucil, By Source, 2016-2028 (US$ Bn)
9.5.6.4. Rest of Europe Metamucil, By Nature, 2016-2028 (US$ Bn)
9.5.6.5. Rest of Europe Metamucil, By Applicationr, 2016-2028 (US$ Bn)

10. Asia Pacific Metamucil Market Analysis
10.1. Asia Pacific Metamucil Market, By Type, 2016-2028(US$ Bn)
10.1.1. Overview
10.1.2. SRC Analysis
10.2. Asia Pacific Metamucil Market, By Source, 2016-2028(US$ Bn)
10.2.1. Overview
10.2.2. SRC Analysis
10.3. Asia Pacific Metamucil Market, By Nature, 2016-2028(US$ Bn)
10.3.1. Overview
10.3.2. SRC Analysis
10.4. Asia Pacific Metamucil Market, by Applicationr, 2016-2028(US$ Bn)
10.4.1. Overview
10.4.2. SRC Analysis
10.5. Asia Pacific Metamucil Market, by Country, 2016-2028 (US$ Bn)
10.5.1. China
10.5.1.1. China Metamucil Market Estimates and Forecast, 2016-2028 (US$ Bn)
10.5.1.2. China Metamucil, By Type, 2016-2028 (US$ Bn)
10.5.1.3. China Metamucil, By Source, 2016-2028 (US$ Bn)
10.5.1.4. China Metamucil, By Nature, 2016-2028 (US$ Bn)
10.5.1.5. China Metamucil, By Applicationr, 2016-2028 (US$ Bn)
10.5.2. Japan
10.5.2.1. Japan Metamucil Market Estimates and Forecast, 2016-2028 (US$ Bn)
10.5.2.2. Japan Metamucil, By Type, 2016-2028 (US$ Bn)
10.5.2.3. Japan Metamucil, By Source, 2016-2028 (US$ Bn)
10.5.2.4. Japan Metamucil, By Nature, 2016-2028 (US$ Bn)
10.5.2.5. Japan Metamucil, By Applicationr, 2016-2028 (US$ Bn)
10.5.3. India
10.5.3.1. India Metamucil Market Estimates and Forecast, 2016-2028 (US$ Bn)
10.5.3.2. India Metamucil, By Type, 2016-2028 (US$ Bn)
10.5.3.3. India Metamucil, By Source, 2016-2028 (US$ Bn)
10.5.3.4. India Metamucil, By Nature, 2016-2028 (US$ Bn)
10.5.3.5. India Metamucil, By Applicationr, 2016-2028 (US$ Bn)
10.5.4. South Korea
10.5.4.1. South Korea Metamucil Market Estimates and Forecast, 2016-2028 (US$ Bn)
10.5.4.2. South Korea Metamucil, By Type, 2016-2028 (US$ Bn)
10.5.4.3. South Korea Metamucil, By Source, 2016-2028 (US$ Bn)
10.5.4.4. South Korea Metamucil, By Nature, 2016-2028 (US$ Bn)
10.5.4.5. South Korea Metamucil, By Applicationr, 2016-2028 (US$ Bn)
10.5.5. South-East Asia
10.5.5.1. South-East Asia Metamucil Market Estimates and Forecast, 2016-2028 (US$ Bn)
10.5.5.2. South-East Asia Metamucil, By Type, 2016-2028 (US$ Bn)
10.5.5.3. South-East Asia Metamucil, By Source, 2016-2028 (US$ Bn)
10.5.5.4. South-East Asia Metamucil, By Nature, 2016-2028 (US$ Bn)
10.5.5.5. South-East Asia Metamucil, By Applicationr, 2016-2028 (US$ Bn)
10.5.6. Rest of Asia Pacific
10.5.6.1. Rest of Asia Pacific Metamucil Market Estimates and Forecast, 2016-2028 (US$ Bn)
10.5.6.2. Rest of Asia Pacific Metamucil, By Type, 2016-2028 (US$ Bn)
10.5.6.3. Rest of Asia Pacific Metamucil, By Source, 2016-2028 (US$ Bn)
10.5.6.4. Rest of Asia Pacific Metamucil, By Nature, 2016-2028 (US$ Bn)
10.5.6.5. Rest of Asia Pacific Metamucil, By Application, 2016-2028 (US$ Bn)

11. Latin America Metamucil Market Analysis
11.1. Latin America Metamucil Market, By Type, 2016-2028(US$ Bn)
11.1.1. Overview
11.1.2. SRC Analysis
11.2. Latin America Metamucil Market, By Source, 2016-2028(US$ Bn)
11.2.1. Overview
11.2.2. SRC Analysis
11.3. Latin America Metamucil Market, By Nature, 2016-2028(US$ Bn)
11.3.1. Overview
11.3.2. SRC Analysis
11.4. Latin America Metamucil Market, By Application, 2016-2028(US$ Bn)
11.4.1. Overview
11.4.2. SRC Analysis
11.5. Latin America Metamucil Market, by Country, 2016-2028 (US$ Bn)
11.5.1. Brazil
11.5.1.1. Brazil Metamucil Market Estimates and Forecast, 2016-2028 (US$ Bn)
11.5.1.2. Brazil Metamucil, By Type, 2016-2028 (US$ Bn)
11.5.1.3. Brazil Metamucil, By Source, 2016-2028 (US$ Bn)
11.5.1.4. Brazil Metamucil, By Nature, 2016-2028 (US$ Bn)
11.5.1.5. Brazil Metamucil, By Applicationr, 2016-2028 (US$ Bn)
11.5.2. Mexico
11.5.2.1. Mexico Metamucil Market Estimates and Forecast, 2016-2028 (US$ Bn)
11.5.2.2. Mexico Metamucil, By Type, 2016-2028 (US$ Bn)
11.5.2.3. Mexico Metamucil, By Source, 2016-2028 (US$ Bn)
11.5.2.4. Mexico Metamucil, By Nature, 2016-2028 (US$ Bn)
11.5.2.5. Mexico Metamucil, By Applicationr, 2016-2028 (US$ Bn)
11.5.3. Rest of Latin America
11.5.3.1. Rest of Latin America Metamucil Market Estimates and Forecast, 2016-2028 (US$ Bn)
11.5.3.2. Rest of Latin America Metamucil, By Type, 2016-2028 (US$ Bn)
11.5.3.3. Rest of Latin America Metamucil, By Source, 2016-2028 (US$ Bn)
11.5.3.4. Rest of Latin America Metamucil, By Nature, 2016-2028 (US$ Bn)
11.5.3.5. Rest of Latin America Metamucil, By Applicationr, 2016-2028 (US$ Bn)

12. Middle East and Africa Metamucil Market Analysis
12.1. Middle East and Africa Metamucil Market, By Type, 2016-2028(US$ Bn)
12.1.1. Overview
12.1.2. SRC Analysis
12.2. Middle East and Africa Metamucil Market, By Source, 2016-2028(US$ Bn)
12.2.1. Overview
12.2.2. SRC Analysis
12.3. Middle East and Africa Metamucil Market, By Nature, 2016-2028(US$ Bn)
12.3.1. Overview
12.3.2. SRC Analysis
12.4. Middle East and Africa Metamucil Market, By Application, 2016-2028(US$ Bn)
12.4.1. Overview
12.4.2. SRC Analysis
12.5. Middle East and Africa Metamucil Market, by Country, 2016-2028 (US$ Bn)
12.5.1. GCC Countries
12.5.1.1. GCC Countries il Metamucil Market Estimates and Forecast, 2016-2028 (US$ Bn)
12.5.1.2. GCC Countries Metamucil, By Type, 2016-2028 (US$ Bn)
12.5.1.3. GCC Countries Metamucil, By Source, 2016-2028 (US$ Bn)
12.5.1.4. GCC Countries Metamucil, By Nature, 2016-2028 (US$ Bn)
12.5.1.5. GCC Countries Metamucil, By Applicationr, 2016-2028 (US$ Bn)
12.5.2. South Africa
12.5.2.1. South Africa Metamucil Market Estimates and Forecast, 2016-2028 (US$ Bn)
12.5.2.2. South Africa Metamucil, By Type, 2016-2028 (US$ Bn)
12.5.2.3. South Africa Metamucil, By Source, 2016-2028 (US$ Bn)
12.5.2.4. South Africa Metamucil, By Nature, 2016-2028 (US$ Bn)
12.5.2.5. South Africa Metamucil, By Applicationr, 2016-2028 (US$ Bn)
12.5.3. Rest of Middle East and Africa
12.5.3.1. Rest of Middle East and Africa Metamucil Market Estimates and Forecast, 2016-2028 (US$ Bn)
12.5.3.2. Rest of Middle East and Africa Metamucil, By Type, 2016-2028 (US$ Bn)
12.5.3.3. Rest of Middle East and Africa Metamucil, By Source, 2016-2028 (US$ Bn)
12.5.3.4. Rest of Middle East and Africa Metamucil, By Nature, 2016-2028 (US$ Bn)
12.5.3.5. Rest of Middle East and Africa Metamucil, By Applicationr, 2016-2028 (US$ Bn)

13. Company Profiles
13.1. Robinson Pharma, Inc.
13.1.1. Company Overview
13.1.2. Products/Services Portfolio
13.1.3. Geographical Presence
13.1.4. Financial Summary
13.1.4.1. Market Revenue and Net Profit (2019-2021)
13.1.4.2. Business Segment Revenue Analysis
13.1.4.3. Geographical Revenue Analysis
13.2. Renew Life
13.3. Benefiber
13.4. Citrucel
13.5. Metamucil
13.6. Walgreens
13.7. Now
13.8. Optimum Nutrition
13.9. BarnDad’s
13.10. Myogenix
13.11. Twinlab
13.12. Garden of Life
13.13. SPECIES
13.14. Others

List of Figures

FIG. 1 Global Metamucil Market: Research Methodology
FIG. 2 Market Size Estimation – Top Down & Bottom up Approach
FIG. 3 Global Metamucil Market Segmentation
FIG. 4 Global Metamucil Market, By Type, 2021 (US$ Bn)
FIG. 5 Global Metamucil Market, By Source, 2021 (US$ Bn)
FIG. 6 Global Metamucil Market, By Nature Type, 2021 (US$ Bn)
FIG. 7 Global Metamucil Market, By Application, 2021 (US$ Bn)
FIG. 8 Global Metamucil Market, by Geography, 2021 (US$ Bn)
FIG. 9 Attractive Investment Proposition, By Type, 2021
FIG. 10 Attractive Investment Proposition, By Source, 2021
FIG. 11 Attractive Investment Proposition, By Nature Type, 2021
FIG. 12 Attractive Investment Proposition, By Application, 2021
FIG. 13 Attractive Investment Proposition, by Geography, 2021
FIG. 14 Global Market Share Analysis of Key Metamucil Market Manufacturers, 2021
FIG. 15 Global Market Positioning of Key Metamucil Market Manufacturers, 2021
FIG. 16 Global Metamucil Market Value Contribution, By Type, 2021 & 2028 (Value %)
FIG. 17 Global Metamucil Market, by Capsule, Value, 2016-2028 (US$ Bn)
FIG. 18 Global Metamucil Market, by Powder, Value, 2016-2028 (US$ Bn)
FIG. 19 Global Metamucil Market, by Chewable, Value, 2016-2028 (US$ Bn)
FIG. 20 Global Metamucil Market, by Tablets, Value, 2016-2028 (US$ Bn)
FIG. 21 Global Metamucil Market Value Contribution, By Source, 2021 & 2028 (Value %)
FIG. 22 Global Metamucil Market, By Fruits, Value, 2016-2028 (US$ Bn)
FIG. 23 Global Metamucil Market, By Vegetables, Value, 2016-2028 (US$ Bn)
FIG. 24 Global Metamucil Market, By Legumes, Value, 2016-2028 (US$ Bn)
FIG. 25 Global Metamucil Market, By Whole Grain, Value, 2016-2028 (US$ Bn)
FIG. 26 Global Metamucil Market Value Contribution, By Nature, 2021 & 2028 (Value %)
FIG. 27 Global Metamucil Market, By Conventional, Value, 2016-2028 (US$ Bn)
FIG. 28 Global Metamucil Market, By Organic, Value, 2016-2028 (US$ Bn)
FIG. 29 Global Metamucil Market Value Contribution, By Application, 2021 & 2028 (Value %)
FIG. 30 Global Metamucil Market, By Blood Cholesterol Reduction, Value, 2016-2028 (US$ Bn)
FIG. 31 Global Metamucil Market, By Gastrointestinal Health, Value, 2016-2028 (US$ Bn)
FIG. 32 Global Metamucil Market, By Weight Management, Value, 2016-2028 (US$ Bn)
FIG. 33 U.S. Metamucil Market, 2016-2028 (US$ Bn)
FIG. 34 Canada Metamucil Market, 2016-2028 (US$ Bn)
FIG. 35 Germany Metamucil Market, 2016-2028 (US$ Bn)
FIG. 36 France Metamucil Market, 2016-2028 (US$ Bn)
FIG. 37 U.K. Metamucil Market, 2016-2028 (US$ Bn)
FIG. 38 Italy Metamucil Market, 2016-2028 (US$ Bn)
FIG. 39 Spain Metamucil Market, 2016-2028 (US$ Bn)
FIG. 40 Rest of Europe Metamucil Market, 2016-2028 (US$ Bn)
FIG. 41 China Metamucil Market, 2016-2028 (US$ Bn)
FIG. 42 Japan Metamucil Market, 2016-2028 (US$ Bn)
FIG. 43 India Metamucil Market, 2016-2028 (US$ Bn)
FIG. 44 South Korea Metamucil Market, 2016-2028 (US$ Bn)
FIG. 45 Southeast Asia Metamucil Market, 2016-2028 (US$ Bn)
FIG. 46 Rest of Asia Pacific Metamucil Market, 2016-2028 (US$ Bn)
FIG. 47 Latin America Metamucil Market, 2016-2028 (US$ Bn)
FIG. 48 Brazil Metamucil Market, 2016-2028 (US$ Bn)
FIG. 49 Mexico Metamucil Market, 2016-2028 (US$ Bn)
FIG. 50 Rest of Latin America Metamucil Market, 2016-2028 (US$ Bn)
FIG. 51 Middle East & Africa Metamucil Market, 2016-2028 (US$ Bn)
FIG. 52 GCC Countries Metamucil Market, 2016-2028 (US$ Bn)
FIG. 53 South Africa Metamucil Market, 2016-2028 (US$ Bn)
FIG. 54 Rest of Middle East and Africa Metamucil Market, 2016-2028 (US$ Bn)

List of Tables

TABLE 1 Market Snapshot: Global Metamucil Market
TABLE 2 Global Metamucil Market, by Competitive Benchmarking, 2021
TABLE 3 Global Metamucil Market, by Geographical Presence Analysis, 2021
TABLE 4 Global Metamucil Market, by Key Strategies Analysis, 2021
TABLE 5 Global Metamucil Market, By Type, 2016-2028 (US$ Bn)
TABLE 6 Global Metamucil Market, By Source, 2016-2028 (US$ Bn)
TABLE 7 Global Metamucil Market, By Nature, 2016-2028 (US$ Bn)
TABLE 8 Global Metamucil Market, By Application, 2016-2028 (US$ Bn)
TABLE 9 Global Metamucil Market, by Geography, 2016-2028 (US$ Bn)
TABLE 10 North America Metamucil Market, By Type, 2016-2028 (US$ Bn)
TABLE 11 North America Metamucil Market, By Source, 2016-2028 (US$ Bn)
TABLE 12 North America Metamucil Market, By Nature, 2016-2028 (US$ Bn)
TABLE 13 North America Metamucil Market, By Application, 2016-2028 (US$ Bn)
TABLE 14 North America Metamucil Market, by Country, 2016-2028 (US$ Bn)
TABLE 15 US Metamucil Market, By Type, 2016-2028 (US$ Bn)
TABLE 16 US Metamucil Market, By Source, 2016-2028 (US$ Bn)
TABLE 17 US Metamucil Market, By Nature, 2016-2028 (US$ Bn)
TABLE 18 US Metamucil Market, By Application, 2016-2028 (US$ Bn)
TABLE 19 Canada Metamucil Market, By Type, 2016-2028 (US$ Bn)
TABLE 20 Canada Metamucil Market, By Source, 2016-2028 (US$ Bn)
TABLE 21 Canada Metamucil Market, By Nature, 2016-2028 (US$ Bn)
TABLE 22 Canada Metamucil Market, By Application, 2016-2028 (US$ Bn)
TABLE 23 Europe Metamucil Market, By Type, 2016-2028 (US$ Bn)
TABLE 24 Europe Metamucil Market, By Source, 2016-2028 (US$ Bn)
TABLE 25 Europe Metamucil Market, By Nature, 2016-2028 (US$ Bn)
TABLE 26 Europe Metamucil Market, By Application, 2016-2028 (US$ Bn)
TABLE 27 Europe Metamucil Market, by Country, 2016-2028 (US$ Bn)
TABLE 28 Germany Metamucil Market, By Type, 2016-2028 (US$ Bn)
TABLE 29 Germany Metamucil Market, By Source, 2016-2028 (US$ Bn)
TABLE 30 Germany Metamucil Market, By Nature, 2016-2028 (US$ Bn)
TABLE 31 Germany Metamucil Market, by Applicationr, 2016-2028 (US$ Bn)
TABLE 32 France Metamucil Market, By Type, 2016-2028 (US$ Bn)
TABLE 33 France Metamucil Market, By Source, 2016-2028 (US$ Bn)
TABLE 34 France Metamucil Market, By Nature, 2016-2028 (US$ Bn)
TABLE 35 France Metamucil Market, by Applicationr, 2016-2028 (US$ Bn)
TABLE 36 UK Metamucil Market, By Type, 2016-2028 (US$ Bn)
TABLE 37 UK Metamucil Market, By Source, 2016-2028 (US$ Bn)
TABLE 38 UK Metamucil Market, By Nature, 2016-2028 (US$ Bn)
TABLE 39 UK Metamucil Market, by Applicationr, 2016-2028 (US$ Bn)
TABLE 40 Italy Metamucil Market, By Type, 2016-2028 (US$ Bn)
TABLE 41 Italy Metamucil Market, By Source, 2016-2028 (US$ Bn)
TABLE 42 Italy Metamucil Market, By Nature, 2016-2028 (US$ Bn)
TABLE 43 Italy Metamucil Market, by Applicationr, 2016-2028 (US$ Bn)
TABLE 44 Spain Metamucil Market, By Type, 2016-2028 (US$ Bn)
TABLE 45 Spain Metamucil Market, By Source, 2016-2028 (US$ Bn)
TABLE 46 Spain Metamucil Market, By Nature, 2016-2028 (US$ Bn)
TABLE 47 Spain Metamucil Market, by Applicationr, 2016-2028 (US$ Bn)
TABLE 48 Rest of Europe Metamucil Market, By Type, 2016-2028 (US$ Bn)
TABLE 49 Rest of Europe Metamucil Market, By Source, 2016-2028 (US$ Bn)
TABLE 50 Rest of Europe Metamucil Market, By Nature, 2016-2028 (US$ Bn)
TABLE 51 Rest of Europe Metamucil Market, By Application, 2016-2028 (US$ Bn)
TABLE 52 Asia Pacific Metamucil Market, By Type, 2016-2028 (US$ Bn)
TABLE 53 Asia Pacific Metamucil Market, By Source, 2016-2028 (US$ Bn)
TABLE 54 Asia Pacific Metamucil Market, By Nature, 2016-2028 (US$ Bn)
TABLE 55 Asia Pacific Metamucil Market, by Applicationr, 2016-2028 (US$ Bn)
TABLE 56 Asia Pacific Metamucil Market, by Country, 2016-2028 (US$ Bn)
TABLE 57 China Metamucil Market, By Type, 2016-2028 (US$ Bn)
TABLE 58 China Metamucil Market, By Source, 2016-2028 (US$ Bn)
TABLE 59 China Metamucil Market, By Nature, 2016-2028 (US$ Bn)
TABLE 60 China Metamucil Market, by Applicationr, 2016-2028 (US$ Bn)
TABLE 61 Japan Metamucil Market, By Type, 2016-2028 (US$ Bn)
TABLE 62 Japan Metamucil Market, By Source, 2016-2028 (US$ Bn)
TABLE 63 Japan Metamucil Market, By Nature, 2016-2028 (US$ Bn)
TABLE 64 Japan Metamucil Market, by Applicationr, 2016-2028 (US$ Bn)
TABLE 65 India Metamucil Market, By Type, 2016-2028 (US$ Bn)
TABLE 66 India Metamucil Market, By Source, 2016-2028 (US$ Bn)
TABLE 67 India Metamucil Market, By Nature, 2016-2028 (US$ Bn)
TABLE 68 India Metamucil Market, by Applicationr, 2016-2028 (US$ Bn)
TABLE 69 South Korea Metamucil Market, By Type, 2016-2028 (US$ Bn)
TABLE 70 South Korea Metamucil Market, By Source, 2016-2028 (US$ Bn)
TABLE 71 South Korea Metamucil Market, By Nature, 2016-2028 (US$ Bn)
TABLE 72 South Korea Metamucil Market, by Applicationr, 2016-2028 (US$ Bn)
TABLE 73 South East Asia Metamucil Market, By Type, 2016-2028 (US$ Bn)
TABLE 74 South East Asia Metamucil Market, By Source, 2016-2028 (US$ Bn)
TABLE 75 South East Asia Metamucil Market, By Nature, 2016-2028 (US$ Bn)
TABLE 76 South East Asia Metamucil Market, By Application, 2016-2028 (US$ Bn)
TABLE 77 Rest of Asia Pacific Metamucil Market, By Type, 2016-2028 (US$ Bn)
TABLE 78 Rest of Asia Pacific Metamucil Market, By Source, 2016-2028 (US$ Bn)
TABLE 79 Rest of Asia Pacific Metamucil Market, By Nature, 2016-2028 (US$ Bn)
TABLE 80 Rest of Asia Pacific Metamucil Market, By Application, 2016-2028 (US$ Bn)
TABLE 81 Latin America Metamucil Market, By Type, 2016-2028 (US$ Bn)
TABLE 82 Latin America Metamucil Market, By Source, 2016-2028 (US$ Bn)
TABLE 83 Latin America Metamucil Market, By Nature, 2016-2028 (US$ Bn)
TABLE 84 Latin America Metamucil Market, By Application, 2016-2028 (US$ Bn)
TABLE 85 Latin America Metamucil Market, by Country, 2016-2028 (US$ Bn)
TABLE 86 Brazil Metamucil Market, By Type, 2016-2028 (US$ Bn)
TABLE 87 Brazil Metamucil Market, By Source, 2016-2028 (US$ Bn)
TABLE 88 Brazil Metamucil Market, By Nature, 2016-2028 (US$ Bn)
TABLE 89 Brazil Metamucil Market, by Applicationr, 2016-2028 (US$ Bn)
TABLE 90 Mexico Metamucil Market, By Type, 2016-2028 (US$ Bn)
TABLE 91 Mexico Metamucil Market, By Source, 2016-2028 (US$ Bn)
TABLE 92 Mexico Metamucil Market, By Nature, 2016-2028 (US$ Bn)
TABLE 93 Mexico Metamucil Market, by Applicationr, 2016-2028 (US$ Bn)
TABLE 94 Rest of Latin America Metamucil Market, By Type, 2016-2028 (US$ Bn)
TABLE 95 Rest of Latin America Metamucil Market, By Source, 2016-2028 (US$ Bn)
TABLE 96 Rest of Latin America Metamucil Market, By Nature, 2016-2028 (US$ Bn)
TABLE 97 Rest of Latin America Metamucil Market, By Application, 2016-2028 (US$ Bn)
TABLE 98 Middle East and Africa Metamucil Market, By Type, 2016-2028 (US$ Bn)
TABLE 99 Middle East and Africa Metamucil Market, By Source, 2016-2028 (US$ Bn)
TABLE 100 Middle East and Africa Metamucil Market, By Nature, 2016-2028 (US$ Bn)
TABLE 101 Middle East and Africa Metamucil Market, By Application, 2016-2028 (US$ Bn)
TABLE 102 Middle East and Africa Metamucil Market, by Country, 2016-2028 (US$ Bn)
TABLE 103 GCC Countries Metamucil Market, By Type, 2016-2028 (US$ Bn)
TABLE 104 GCC Countries Metamucil Market, By Source, 2016-2028 (US$ Bn)
TABLE 105 GCC Countries Metamucil Market, By Nature, 2016-2028 (US$ Bn)
TABLE 106 GCC Countries Metamucil Market, by Applicationr, 2016-2028 (US$ Bn)
TABLE 107 South Africa Metamucil Market, By Type, 2016-2028 (US$ Bn)
TABLE 108 South Africa Metamucil Market, By Source, 2016-2028 (US$ Bn)
TABLE 109 South Africa Metamucil Market, By Nature, 2016-2028 (US$ Bn)
TABLE 110 South Africa Metamucil Market, by Applicationr, 2016-2028 (US$ Bn)
TABLE 111 Rest of Middle East and Africa Metamucil Market, By Type, 2016-2028 (US$ Bn)
TABLE 112 Rest of Middle East and Africa Metamucil Market, By Source, 2016-2028 (US$ Bn)
TABLE 113 Rest of Middle East and Africa Metamucil Market, By Nature, 2016-2028 (US$ Bn)
TABLE 114 Rest of Middle East and Africa Metamucil Market, By Application, 2016-2028 (US$ Bn)

Frequently Asked Questions

How does COVID-19 Impact the global Metamucil market?

COVID-19 has had a substantial impact on the market due to the outbreak of the COVID-19 pandemic, which reduced the demand for unnecessary drugs.

Which is the leading region of the market for Metamucil?

Asia Pacific accounted for the highest share in the global Metamucil market.

What are the key drivers for the growth of the Metamucil market?

Changes in eating habits, significant deficiency of fibers amongst people, and growing gluten-free intolerance drive the Metamucil market.

Which is the major segment in the Metamucil market by nature?

The conventional segment had a major global market share in 2021.

Which is the major segment in the Metamucil market by source?

The whole grain segment had a major share in the global market.

food and beverage

Saudi Arabia Coffee Market

Published:
Report ID: 30641

food and beverage

UK Gluten Free Products Market

Published:
Report ID: 30545

food and beverage

UAE Meat Market

Published:
Report ID: 22779

food and beverage

Middle East and Africa Fruit Concentrate Market

Published:
Report ID: 30459

food and beverage

Malaysia Meat Market

Published:
Report ID: 29262

food and beverage

Plant Extracts Market

Published:
Report ID: 26996

food and beverage

Modified Starch Market

Published:
Report ID: 24135

food and beverage

Ethnic Foods Market

Published:
Report ID: 24068

food and beverage

Batter and Breader Premixes Market

Published:
Report ID: 23633

food and beverage

North America Cheese Market

Published:
Report ID: 23507

food and beverage

Europe Cheese Market

Published:
Report ID: 23432

food and beverage

Global Black Rice Market

Published:
Report ID: 7096

Purchase Options

Buy With Trust, Competitive Pricing - In-depth Analysis

$2999

Delivery Format: Excel.

$4999

Designed for the individual purchaser.

$6999

Users located at a single corporate site or regional office.

$9999

Allowed for unlimited sharing globally within one company.


Still Not Sure?

Have a question?

User Profile

Don’t settle for less – trust Mitul to help you find the best solution.

Report delivery within 24 to 48 hours

– Other Info –

What people say?-

User Review

I am very impressed with the information in this report. The author clearly did their research when they came up with this product and it has already given me a lot of ideas.

Jana Schmidt
CEDAR CX Technologies

– Connect with us –

Phone

+91 6232 49 3207


support

24/7 Research Support


sales@credenceresearch.com

– Research Methodology –

Going beyond the basics: advanced techniques in research methodology

– Trusted By –

Pepshi, LG, Nestle
Motorola, Honeywell, Johnson and johnson
LG Chem, SIEMENS, Pfizer
Unilever, Samsonite, QIAGEN
WhatsApp Now