| REPORT ATTRIBUTE | DETAILS |
|---|---|
| Historical Period | 2020-2023 |
| Base Year | 2024 |
| Forecast Period | 2025-2032 |
| Neutropenia Treatment Market Size 20244 | USD 16,547.16 million |
| Neutropenia Treatment Market, CAGR | 5.63% |
| Neutropenia Treatment Market Size 2032 | USD 25,597.48 million |
Market Overview
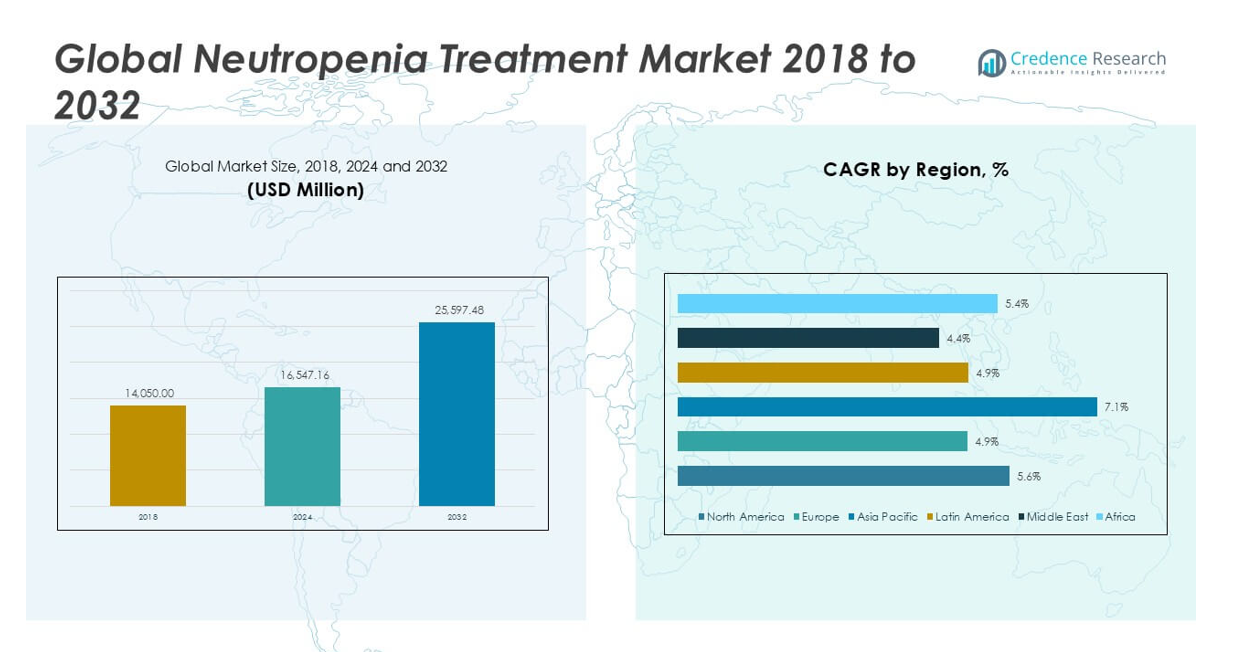
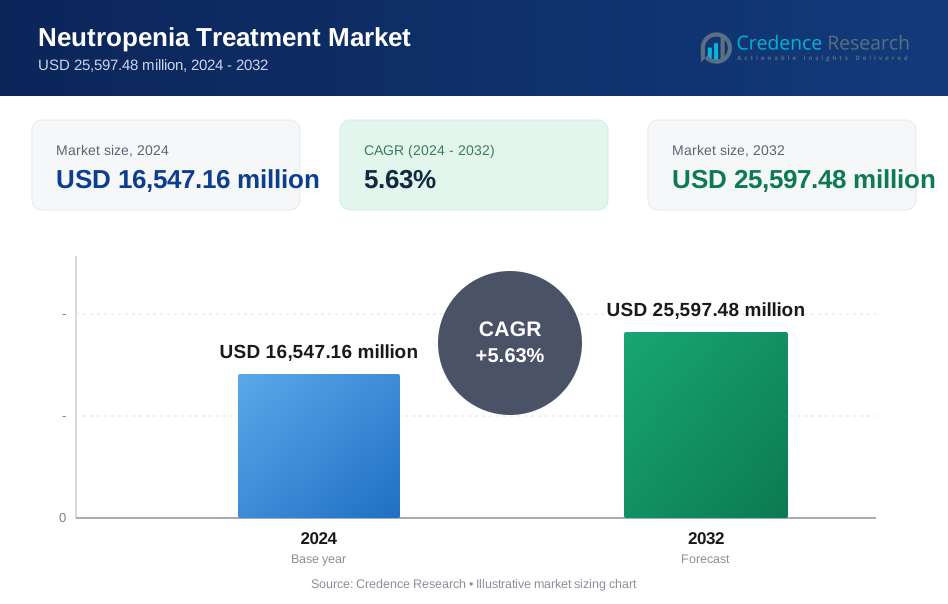
The Neutropenia Treatment Market size was valued at USD 14,050 million in 2018 and USD 16,547.16 million in 2024. It is anticipated to reach USD 25,597.48 million by 2032, at a CAGR of 5.63% during the forecast period.
The Neutropenia Treatment Market is experiencing steady growth, driven by the rising incidence of cancer and increased use of chemotherapy, which frequently leads to neutropenia as a side effect. The growing elderly population and advances in cancer treatment protocols further increase demand for effective neutropenia therapies, including granulocyte-colony stimulating factors (G-CSFs) and novel biologics. Greater awareness among healthcare providers and patients, coupled with improved diagnosis rates, continues to boost market expansion. In addition, the entry of biosimilars and ongoing research into next-generation therapeutics are making treatment more accessible and cost-effective. However, the market faces challenges from high treatment costs and potential side effects associated with long-term therapy. Key trends include the adoption of personalized medicine, increasing patient support programs, and a focus on developing drugs with fewer adverse effects, all contributing to the dynamic evolution of the global neutropenia treatment landscape.
The geographical analysis of the Neutropenia Treatment Market highlights strong demand across North America, Europe, and Asia Pacific, with each region benefiting from advanced healthcare infrastructure, increasing cancer prevalence, and improved access to innovative therapies. North America remains at the forefront due to a high volume of cancer diagnoses and the early adoption of biologics, while Europe follows with robust oncology networks and rising uptake of biosimilars. Asia Pacific is experiencing the fastest growth, driven by expanding healthcare access and rising awareness in countries such as China, Japan, and India. Leading companies shaping the competitive landscape include Amgen, known for its established portfolio of colony-stimulating factors; Teva Pharmaceutical Industries Ltd., with a growing range of biosimilar products; and Novartis AG, recognized for its focus on oncology innovation. These key players, together with other global and regional firms, continue to drive market evolution through product development and strategic partnerships.
Market Insights
- The Neutropenia Treatment Market is projected to grow from USD 16,547.16 million in 2024 to USD 25,597.48 million by 2032, reflecting a CAGR of 5.63% during the forecast period.
- Rising cancer incidence and the widespread use of chemotherapy are driving demand for neutropenia treatments, particularly in high-risk patient populations.
- The market is witnessing strong trends toward the adoption of biosimilars and personalized medicine, with digital health solutions and remote monitoring expanding access and improving patient outcomes.
- Key players such as Amgen, Teva Pharmaceutical Industries Ltd., and Novartis AG maintain a competitive edge through robust product portfolios, strategic collaborations, and ongoing investments in research and development.
- High treatment costs and safety concerns related to long-term use of colony-stimulating factors and other therapies act as restraints, limiting broader market adoption in certain regions.
- North America leads the market in terms of value, supported by advanced healthcare infrastructure, while Asia Pacific is expected to experience the fastest growth due to increasing healthcare access and awareness in countries like China, Japan, and India.
- Regional disparities persist, with emerging economies facing challenges in affordability and distribution, but targeted public health initiatives and new regulatory policies are gradually improving access to neutropenia treatments worldwide.
Market Drivers
Rising Cancer Prevalence and Expanded Chemotherapy Use Drive Demand
The increasing global incidence of cancer continues to drive the Neutropenia Treatment Market. Cancer patients undergoing chemotherapy are at significant risk of developing neutropenia, creating robust demand for preventive and therapeutic interventions. The ongoing adoption of aggressive cancer treatment regimens and the expansion of cancer care facilities worldwide have heightened the necessity for neutropenia management. Health systems are prioritizing early identification and intervention, supporting consistent market growth. This focus on comprehensive oncology care supports higher uptake of both established and innovative therapies. Regulatory agencies continue to approve new treatment protocols that integrate neutropenia management as a standard component. Expanding cancer awareness campaigns further amplify the need for effective neutropenia solutions.
- For instance, Amgen’s Neulasta® (pegfilgrastim) was prescribed over 5 million times in the U.S. in a single year, becoming the most commonly used long-acting G-CSF for chemotherapy-induced neutropenia.
Advancements in Biologics and Biosimilars Increase Access and Affordability
Rapid progress in biologics and the introduction of biosimilar drugs have transformed the competitive landscape of the Neutropenia Treatment Market. Pharmaceutical manufacturers are developing new formulations of granulocyte-colony stimulating factors (G-CSFs) and other biologics to enhance patient outcomes. The emergence of biosimilars is reducing treatment costs, allowing more healthcare providers to offer advanced therapies to a wider patient base. Payers and healthcare systems are adopting biosimilars to optimize spending and expand coverage. Regulatory support for biosimilar approvals in key markets, including the U.S. and Europe, is accelerating market penetration. Investment in research and development by both multinational and regional companies is facilitating ongoing product innovation. It enables broader treatment options for healthcare professionals and patients alike.
- For instance, Teva Pharmaceutical Industries has supplied more than 3 million doses of its biosimilar filgrastim (Granix®) in the U.S. since its launch, making it a top biosimilar G-CSF in hospital formularies.
Growing Geriatric Population and Rising Susceptibility Amplify Market Size
The rapid growth of the global elderly population fuels expansion in the Neutropenia Treatment Market. Older adults often face multiple comorbidities and are more likely to require aggressive medical interventions, raising their risk of developing neutropenia. Health systems are dedicating more resources to the management of complications in aging patients, supporting consistent demand for neutropenia therapies. The trend toward aging populations in developed and emerging economies places sustained pressure on the market. Public health initiatives target better access to supportive care for vulnerable groups, including the elderly. Improved diagnostic capabilities and awareness among clinicians further increase case identification. These demographic shifts contribute significantly to the overall market outlook.
Healthcare Policy Initiatives and Patient Education Strengthen Market Fundamentals
Global and regional policy initiatives focused on cancer care are shaping the direction of the Neutropenia Treatment Market. Governments are increasing funding for cancer treatment infrastructure and providing incentives for hospitals to adopt evidence-based neutropenia management protocols. Patient education programs about infection risks and early symptom reporting help promote timely intervention and adherence to treatment plans. Pharmaceutical companies are collaborating with healthcare organizations to improve access and affordability, including co-pay assistance and patient support services. Payer policies increasingly support coverage for neutropenia prevention in high-risk populations. Standardization of treatment guidelines by leading oncology associations encourages best practices across diverse healthcare settings. It strengthens the market foundation and supports sustained growth.
Market Trends
Personalized Medicine and Precision Therapeutics Gain Prominence
Personalized medicine is shaping the future of the Neutropenia Treatment Market, driven by advances in genomic research and molecular diagnostics. It allows clinicians to tailor neutropenia management strategies according to individual patient profiles and underlying risk factors. Healthcare providers are integrating predictive analytics and biomarker-driven protocols to determine the best course of action for patients at risk of severe neutropenia. Pharmaceutical companies are developing therapies that target specific patient subgroups, aiming to reduce adverse events and optimize clinical outcomes. The trend toward customization extends to dosing regimens and the selection of granulocyte-colony stimulating factors or alternative agents. This approach is increasing treatment efficacy and patient satisfaction. It reinforces the trend toward a more individualized healthcare experience.
- For instance, Pfizer’s precision medicine efforts included enrolling over 23,000 cancer patients in genomics-guided trials by 2022, directly influencing neutropenia risk management and therapy selection.
Expansion of Biosimilars and Competitive Pricing Strategies
The introduction and rapid adoption of biosimilar products mark a significant trend in the Neutropenia Treatment Market. Biosimilars offer comparable safety and efficacy to originator biologics but come at a lower cost, allowing broader access to effective therapies. Pharmaceutical manufacturers are employing competitive pricing strategies to gain market share and support healthcare cost containment. Payers and providers are prioritizing value-based care and maximizing resource allocation through increased biosimilar use. This trend is accelerating the shift toward cost-effective treatment without compromising quality. Regulatory bodies in North America, Europe, and Asia are streamlining approval processes for biosimilars, encouraging further market expansion. It is reshaping the competitive environment and promoting patient access.
- For instance, Sandoz (a Novartis division) has distributed over 15 million doses of Zarxio® (filgrastim-sndz) globally since approval, making it the most widely used biosimilar G-CSF worldwide.
Integration of Digital Health Solutions and Remote Patient Monitoring
The adoption of digital health platforms is a transformative trend in the Neutropenia Treatment Market, particularly for monitoring at-risk patients. Healthcare organizations are deploying telemedicine services and remote monitoring tools to track patient health, treatment adherence, and early warning signs of neutropenia-related complications. Digital solutions improve patient engagement and facilitate timely interventions, which can help prevent hospitalizations and lower healthcare costs. The trend supports home-based care, where patients can safely receive certain therapies and ongoing support outside traditional clinical settings. Pharmaceutical companies are partnering with technology firms to deliver integrated care models. It supports more proactive and patient-centric management of neutropenia.
Focus on Patient Support Programs and Health Equity Initiatives
Patient support programs are becoming a central trend in the Neutropenia Treatment Market, aiming to improve therapy adherence and health outcomes. Pharmaceutical companies are expanding access initiatives, including co-pay assistance, education, and psychosocial support services for patients and caregivers. Health equity initiatives target underserved populations by addressing barriers related to cost, awareness, and healthcare infrastructure. Collaboration between public health agencies and industry stakeholders is ensuring that effective neutropenia therapies reach broader patient groups. Standardized best practice guidelines and care pathways are promoting more consistent treatment across diverse healthcare environments. It underlines the industry’s commitment to inclusive and patient-focused care.
Market Challenges Analysis
High Treatment Costs and Limited Access Restrict Market Growth
High costs of advanced neutropenia therapies remain a significant challenge in the Neutropenia Treatment Market. Biologics and innovative drugs require substantial investment, which can limit patient access, especially in low- and middle-income regions. Insurance coverage disparities and stringent reimbursement policies often delay or restrict the adoption of newer treatments. Hospitals and healthcare systems struggle to provide comprehensive care when faced with budget constraints and rising drug prices. Patients without adequate insurance face significant financial burdens, which may lead to poor adherence or incomplete treatment cycles. It creates disparities in outcomes between developed and emerging markets. Addressing affordability and improving coverage is essential for broader market penetration.
Side Effects and Safety Concerns Limit Adoption of Certain Therapies
Therapies for neutropenia, while effective, can present safety challenges, including the risk of serious side effects such as bone pain, infections, and allergic reactions. Concerns over long-term use of granulocyte-colony stimulating factors and other biologics prompt caution among healthcare providers. Regulatory scrutiny is increasing, with authorities requiring more rigorous post-market surveillance and risk management protocols. Variability in patient response to treatment complicates standardization of care, prompting the need for ongoing monitoring and adjustment. It can delay therapy initiation or require changes in prescribed regimens. These safety considerations hinder rapid adoption of new products and increase the complexity of managing neutropenia in diverse patient populations.
Market Opportunities
Expansion of Biosimilars and Novel Therapeutics Presents Growth Prospects
Expanding the availability of biosimilars and innovative drug formulations creates significant opportunities in the Neutropenia Treatment Market. Biosimilars are entering new geographic regions and broadening patient access through lower-cost options, enabling healthcare providers to reach a larger segment of the population. Investment in research and development focuses on next-generation therapies that offer enhanced safety profiles and improved efficacy. Regulatory bodies in multiple regions are streamlining the approval process for biosimilars, which accelerates product launches and market penetration. Pharmaceutical companies that leverage these trends position themselves for growth in both established and emerging markets. It supports cost containment efforts for payers and health systems while maintaining high-quality patient care.
Advances in Digital Health and Patient Engagement Drive Market Evolution
Rapid advances in digital health platforms offer new opportunities to improve outcomes and optimize care in the Neutropenia Treatment Market. Integration of telemedicine, remote monitoring, and data analytics helps clinicians deliver more personalized and responsive treatment plans. These technologies facilitate earlier intervention and reduce hospital admissions by enabling real-time tracking of patient symptoms and medication adherence. Pharmaceutical companies and healthcare providers are forming strategic partnerships to deliver comprehensive, technology-enabled care models. Health systems adopting these innovations enhance patient satisfaction and operational efficiency. It creates a competitive advantage for early adopters and sets new standards for patient-centered care in neutropenia management.
Market Segmentation Analysis:
By Treatment:
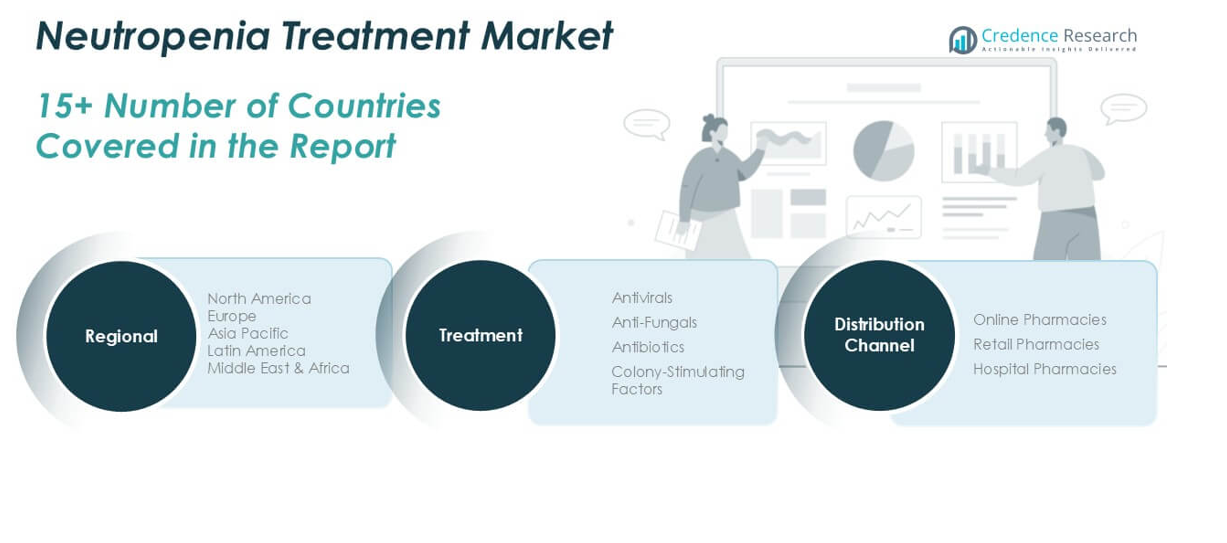
The market features antivirals, anti-fungals, antibiotics, and colony-stimulating factors. Colony-stimulating factors hold a dominant share, driven by their central role in reducing the duration and severity of neutropenia, particularly among cancer patients undergoing chemotherapy. Healthcare providers prioritize these agents to restore neutrophil counts, which helps lower the risk of severe infections. Antibiotics and anti-fungals remain vital in the immediate management of febrile neutropenia and in treating established bacterial or fungal infections. The demand for broad-spectrum antibiotics continues to rise with increasing hospital-acquired infections in immunocompromised patients. Anti-fungals gain traction as clinicians address emerging challenges from resistant fungal pathogens in high-risk groups. Antivirals play a comparatively smaller yet essential role, particularly in patients with viral infections due to severe or prolonged neutropenia.
- For instance, Spectrum Pharmaceuticals enrolled over 600 patients in Phase 3 clinical trials for its novel G-CSF, resulting in FDA approval for use in neutropenia management.
By Distribution Channel:
The Neutropenia Treatment Market is segmented into online pharmacies, retail pharmacies, and hospital pharmacies. Hospital pharmacies command the largest share, supported by the fact that neutropenia treatment frequently begins in acute care settings under strict medical supervision. Hospitals facilitate prompt access to injectable therapies and advanced medications, ensuring timely and efficient patient management. Retail pharmacies contribute substantially to outpatient care, supporting long-term medication adherence and access to oral formulations. Online pharmacies are experiencing robust growth, driven by increasing digital adoption, improved logistics, and the demand for convenience among patients with chronic neutropenia. It provides patients in remote or underserved locations with easier access to prescribed therapies, ensuring continuity of care beyond hospital settings. The evolving balance among these channels reflects broader shifts toward decentralized healthcare delivery and patient-centric treatment models. Each segment continues to adapt in response to regulatory changes, evolving patient needs, and ongoing innovations in pharmaceutical care.
- For instance, CVS Health filled over 40,000 prescriptions for neutropenia therapeutics through its digital pharmacy platform in 2022, marking a significant increase in remote and home-based treatment delivery.
Segments:
Based on Treatment:
- Antivirals
- Anti-fungals
- Antibiotics
- Colony-Stimulating Factors
Based on Distribution Channel:
- Online Pharmacies
- Retail Pharmacies
- Hospital Pharmacies
Based on the Geography:
- North America
- U.S.
- Canada
- Mexico
- Europe
- UK
- France
- Germany
- Italy
- Spain
- Russia
- Belgium
- Netherlands
- Austria
- Sweden
- Poland
- Denmark
- Switzerland
- Rest of Europe
- Asia Pacific
- China
- Japan
- South Korea
- India
- Australia
- Thailand
- Indonesia
- Vietnam
- Malaysia
- Philippines
- Taiwan
- Rest of Asia Pacific
- Latin America
- Brazil
- Argentina
- Peru
- Chile
- Colombia
- Rest of Latin America
- Middle East
- UAE
- KSA
- Israel
- Turkey
- Iran
- Rest of Middle East
- Africa
- Egypt
- Nigeria
- Algeria
- Morocco
- Rest of Africa
Regional Analysis
North America Neutropenia Treatment Market
North America Neutropenia Treatment Market grew from USD 5,475.29 million in 2018 to USD 6,368.74 million in 2024 and is projected to reach USD 9,801.66 million by 2032, reflecting a compound annual growth rate (CAGR) of 5.6%. North America is holding a 38% market share. The United States leads the regional market, supported by a high prevalence of cancer, advanced healthcare infrastructure, and strong adoption of novel therapies. Canada contributes significantly through robust cancer care programs and access to new biologics and biosimilars. High healthcare spending, favorable reimbursement policies, and ongoing innovation continue to reinforce the region’s leadership in neutropenia management.
Europe Neutropenia Treatment Market
Europe Neutropenia Treatment Market grew from USD 4,153.18 million in 2018 to USD 4,722.11 million in 2024 and is expected to reach USD 6,895.26 million by 2032, at a CAGR of 4.9%. Europe accounts for a 27% market share. Major contributors include Germany, France, and the United Kingdom, each with strong oncology care networks and wide access to neutropenia therapeutics. Efforts to expand biosimilar usage and implement uniform cancer care standards drive steady market growth. Regulatory harmonization across the European Union supports faster adoption of innovative treatments.
Asia Pacific Neutropenia Treatment Market
Asia Pacific Neutropenia Treatment Market grew from USD 2,779.09 million in 2018 to USD 3,452.50 million in 2024 and is estimated to reach USD 5,962.75 million by 2032, at a CAGR of 7.1%. Asia Pacific holds a 23% market share, led by countries such as China, Japan, and India. Rapid improvements in healthcare infrastructure, rising cancer incidence, and expanded access to advanced therapies drive regional growth. Government initiatives to improve early diagnosis and affordable treatment continue to widen patient access. The region benefits from a surge in clinical research and local pharmaceutical production.
Latin America Neutropenia Treatment Market
Latin America Neutropenia Treatment Market grew from USD 774.16 million in 2018 to USD 871.93 million in 2024 and is anticipated to reach USD 1,272.03 million by 2032, with a CAGR of 4.9%. Latin America accounts for a 5% market share. Key countries include Brazil, Mexico, and Argentina, where oncology care is advancing alongside improved healthcare funding and awareness. The adoption of biosimilars and public health programs enhances accessibility, but disparities persist between urban and rural healthcare delivery.
Middle East Neutropenia Treatment Market
Middle East Neutropenia Treatment Market grew from USD 484.73 million in 2018 to USD 531.06 million in 2024 and is forecast to reach USD 744.72 million by 2032, at a CAGR of 4.4%. The Middle East holds a 3% market share, with Saudi Arabia and the United Arab Emirates as primary contributors. Growth is supported by ongoing investments in hospital infrastructure and increased adoption of advanced treatments. Challenges such as cost constraints and variable insurance coverage remain, yet initiatives to strengthen oncology care are progressing.
Africa Neutropenia Treatment Market
Africa Neutropenia Treatment Market grew from USD 383.57 million in 2018 to USD 600.84 million in 2024 and is projected to reach USD 921.06 million by 2032, reflecting a CAGR of 5.4%. Africa represents a 4% market share, with South Africa, Egypt, and Nigeria as leading countries. The region experiences gradual improvement in healthcare access, with expanding pharmaceutical distribution and rising awareness of neutropenia treatment. Persistent challenges include limited specialist care and infrastructural gaps, but market potential is increasing due to growing healthcare investments and international partnerships.
Key Player Analysis
- Amgen
- Teva Pharmaceutical Industries Ltd.
- Spectrum Pharmaceuticals
- Pfizer
- Partner Therapeutics
- Novartis AG
- Mylan N.V.
- Cellerant Therapeutics
- Kyowa Kiri
- BeyondSpring
Competitive Analysis
The competitive landscape of the Neutropenia Treatment Market features prominent players such as Amgen, Teva Pharmaceutical Industries Ltd., Novartis AG, Pfizer, Spectrum Pharmaceuticals, and Mylan N.V., each contributing to industry innovation and global expansion. Amgen remains the market leader, leveraging its extensive portfolio of colony-stimulating factors, advanced biologics, and long-standing expertise in oncology care. Strategic priorities include investment in research and development, partnerships with healthcare providers, and expansion into emerging markets. Competitors actively pursue regulatory approvals to ensure rapid market entry for new therapies, aiming to meet evolving clinical guidelines and patient needs. The market also emphasizes affordability and accessibility, with companies introducing cost-effective biosimilar options that support broader adoption. Differentiation through comprehensive product portfolios and enhanced patient support programs strengthens brand presence and loyalty. Continuous technological advancements and a commitment to high-quality standards keep the competitive environment dynamic and responsive to shifts in patient demographics and healthcare infrastructure.
Recent Developments
- In December 2023, Coherus BioSciences, Inc. received FDA approval for its on-body injector (OBI) version of the biosimilar pegfilgrastim-cbqv -Udencya, named Udencya Onbody. It is recommended to cancer patient’s post-chemotherapy to reduce febrile neutropenia risk. The launch intended to introduce a new, proprietary device offering patients automated medication delivery, thereby strengthening its business portfolio.
- In November 2023, Evive Biotech and Acrotech Biopharma obtained FDA approval for Ryzneuta, aimed at reducing infection rates, specifically febrile neutropenia, in adults with non-myeloid malignancies undergoing myelosuppressive anti-cancer treatment. The launch addressed the demand for effective first-line and alternative therapies among cancer patients.
Market Concentration & Characteristics
The Neutropenia Treatment Market exhibits a moderate to high degree of concentration, with a handful of established pharmaceutical and biotechnology firms controlling a significant portion of global revenue. It is characterized by a strong emphasis on biologic therapies, particularly granulocyte-colony stimulating factors, which dominate clinical practice. The market favors companies with robust research and development capabilities, advanced manufacturing infrastructure, and a proven track record in regulatory compliance. Innovation, product differentiation, and the ability to navigate complex approval processes play a pivotal role in sustaining market leadership. It displays barriers to entry for new competitors due to high development costs, stringent quality standards, and the need for substantial clinical evidence. Biosimilars are gaining momentum and contributing to a gradual shift toward more competitive pricing, yet the market remains driven by patented products and established brand loyalty. The presence of global and regional players ensures ongoing investment in next-generation therapies, supporting steady market evolution.
Report Coverage
The research report offers an in-depth analysis based on Treatment, Distribution Channel and Geography. It details leading market players, providing an overview of their business, product offerings, investments, revenue streams, and key applications. Additionally, the report includes insights into the competitive environment, SWOT analysis, current market trends, as well as the primary drivers and constraints. Furthermore, it discusses various factors that have driven market expansion in recent years. The report also explores market dynamics, regulatory scenarios, and technological advancements that are shaping the industry. It assesses the impact of external factors and global economic changes on market growth. Lastly, it provides strategic recommendations for new entrants and established companies to navigate the complexities of the market.
Future Outlook
- The Neutropenia Treatment Market will continue to expand driven by increased cancer survival rates and broader chemotherapy use.
- Patients will gain access to improved therapies through the ongoing development of advanced biologics and biosimilars.
- Digital health tools and remote monitoring platforms will play a central role in patient management and early intervention.
- Precision medicine approaches will refine treatment selection and dosing based on individual risk profiles.
- Strategic partnerships between pharmaceutical firms and healthcare providers will streamline therapy delivery models.
- Regulatory bodies will simplify approval pathways for biosimilars and novel therapies, increasing market competition.
- Patient support programs will expand to enhance adherence and reduce financial barriers.
- Emerging markets will see substantial growth from government investments in oncology infrastructure and healthcare access.
- Research into therapies with fewer side effects will produce safer options for long-term neutropenia management.
- A shift toward value-based care will encourage adoption of cost-effective treatment regimens without compromising quality.
Request a Free Sample
Fill in your details and we'll send you a free sample report.
- Sample data tables & charts
- Research methodology
Market Dynamics
Rising Cancer Prevalence and Expanded Chemotherapy Use
The increasing global incidence of cancer and the widespread adoption of chemotherapy regimens are leading to a higher number of patients at risk for neutropenia, directly boosting demand for both preventive and therapeutic neutropenia treatments.
Advancements in Biologics and Biosimilars
Rapid innovation in biologic therapies, especially granulocyte-colony stimulating factors, and the introduction of biosimilars are making neutropenia treatment more accessible and affordable, expanding the patient base and driving market growth.
Growing Geriatric Population
The aging global population is more susceptible to cancer and related complications such as neutropenia, resulting in a larger pool of patients requiring ongoing neutropenia management and supportive care.
Healthcare Policy Initiatives and Patient Education
Government investments in oncology infrastructure, standardization of treatment protocols, and patient education programs are improving early diagnosis and access to neutropenia therapies, supporting sustained market expansion.
Integration of Digital Health and Remote Monitoring
The adoption of digital health platforms and remote patient monitoring is enhancing treatment adherence and early intervention, reducing hospitalizations and improving outcomes for neutropenia patients, thereby supporting market growth.
Need a Custom Version of This Report?
Tailor the scope, geography, or segments to your exact requirements.
- Custom geography or segment scope
- Direct access to our analyst team
Frequently Asked Questions
What is the market size and growth rate of the Global Neutropenia Treatment Market?
What are the major factors driving market growth?
What role do biosimilars play in market growth?
Why does North America dominate the neutropenia treatment market?
Which companies are key players in the neutropenia treatment market?
Table of Content
Chapter 1 Market Segmentation
- 1.1 Segmentation Framework
- 1.1.1 Product and Service Classification
- 1.1.2 Application and End-Use Classification
- 1.1.3 Technology and Solution Classification
- 1.1.4 Customer and Distribution Channel Classification
- 1.1.5 Geographic Segmentation
- 1.1.6 Market Segment Definitions and Boundaries
- 1.2 By Treatment
- 1.2.1 Colony-Stimulating Factors
- 1.2.2 Antibiotics
- 1.2.3 Anti-fungals
- 1.2.4 Antivirals
Chapter 2 Introduction
- 2.1 Report Objectives and Scope
- 2.2 Product Definition and Industry Terminology
- 2.3 Market Inclusions and Exclusions
- 2.4 Research Process
- 2.4.1 Primary Research and Expert Interviews
- 2.4.2 Secondary Research and Source Review
- 2.4.3 Top-Down and Bottom-Up Estimation
- 2.4.4 Data Triangulation and Verification
- 2.5 Market Size Measurement Basis
- 2.5.1 2024: USD 16,547.16 million → 2032: USD 25,597.48 million
- 2.6 Historical and Forecast Reference Periods
- 2.6.1 Base Year: 2024
- 2.6.2 Forecast Period: 2024-2032
- 2.7 Research Assumptions and Limitations
Chapter 3 Executive Summary
- 3.1 Market Snapshot and Key Findings
- 3.2 Base-Year Market Size, 2024
- 3.3 Forecast Market Size, 2032
- 3.4 Revenue and Volume Growth Outlook
- 3.5 Key Demand and Supply Indicators
- 3.6 Leading Market Segments
- 3.7 Fastest-Growing Market Opportunities
- 3.8 Regional Performance Highlights
- 3.9 Technology and Industry Transformation
- 3.10 Competitive Landscape Summary
- 3.11 Analyst View and Strategic Implications
Chapter 4 Global Neutropenia Treatment Market Trends and Developments
- 4.1 Historical Industry Development
- 4.2 Recent Market Trends and Developments
- 4.3 Demand and Customer Behavior Trends
- 4.4 Technology and Product Innovation
- 4.5 Artificial Intelligence, Automation and Digitalization
- 4.6 Local Manufacturing and Supply Chain Realignment
- 4.7 Industry Partnerships, Mergers and Acquisitions
- 4.8 Sustainability and Circular Economy Developments
- 4.9 Government and Private Sector Investment Trends
- 4.10 Emerging Business Models and Commercialization
- 4.11 Industry Developments and Announcements
Chapter 5 Global Neutropenia Treatment Market Production, Supply and Demand Analysis
- 5.1 Demand Trend and Consumption Analysis
- 5.2 Demand Forecast, 2024-2032
- 5.3 Production and Output Trend
- 5.4 Production and Output Forecast, 2024-2032
- 5.5 Installed Capacity and Capacity Utilization
- 5.6 Company-Wise Production Plants and Statistics
- 5.6.1 Installed Production Capacity
- 5.6.2 Actual Production
- 5.6.3 Planned Capacity and Expansion Targets
- 5.7 Supply Chain Structure and Procurement Trends
- 5.8 Supply-Demand Gap and Bottlenecks
- 5.9 Import Dependence and Sourcing Structure
- 5.10 Contract Manufacturing and Outsourcing
- 5.11 Regional Supply and Demand Concentration
Chapter 6 Global Neutropenia Treatment Market Pricing Analysis
- 6.1 Pricing Structure and Measurement
- 6.2 Historical Pricing Trends
- 6.3 Pricing Outlook, 2024-2032
- 6.4 Average Selling Price and Unit Economics
- 6.5 Pricing by Product and Market Segment
- 6.6 Geographic Pricing Differences
- 6.7 Key Input, Energy, Labor and Logistics Costs
- 6.8 Contract Pricing and Purchasing Models
- 6.9 Pricing Sensitivity and Competitive Positioning
- 6.10 Price, Margin and Profitability Implications
Chapter 7 Global Neutropenia Treatment Market Dynamics
- 7.1 Market Growth Drivers
- 7.1.1 Demand-Side Drivers
- 7.1.2 Technology and Innovation Drivers
- 7.1.3 Infrastructure and Investment Drivers
- 7.1.4 Regulatory and Policy Drivers
- 7.2 Market Restraints
- 7.2.1 Cost and Affordability Constraints
- 7.2.2 Technology and Adoption Barriers
- 7.2.3 Supply Chain and Operational Constraints
- 7.3 Market Challenges
- 7.3.1 Competitive Pressure and Margin Erosion
- 7.3.2 Skills, Infrastructure and Implementation Gaps
- 7.4 Emerging Market Opportunities
- 7.5 Market Dynamics Impact and Time-Horizon Assessment
Chapter 8 Global Neutropenia Treatment Value Chain Analysis
- 8.1 Industry Value Chain Overview
- 8.2 Upstream Suppliers and Critical Inputs
- 8.3 Technology and Component Providers
- 8.4 Manufacturing or Service Delivery
- 8.5 Distribution, Channel Partners and Integrators
- 8.6 Downstream Applications and End Users
- 8.7 Value Addition and Profit Pools
- 8.8 Vertical Integration and Outsourcing
- 8.9 Supplier Concentration and Risk
- 8.10 Supply Chain Localization and Resilience
Chapter 9 Global Neutropenia Treatment Market Regulations and Policies
- 9.1 Relevant Laws, Standards and Compliance Frameworks
- 9.2 Product, Service, Safety and Quality Requirements
- 9.3 Government Policies, Incentives and Subsidies
- 9.4 Imports, Exports and Trade Barriers
- 9.5 Public Procurement and Local Content Requirements
- 9.6 Environmental and Sustainability Compliance
- 9.7 Upcoming Policy Changes and Market Implications
Chapter 10 Global Neutropenia Treatment Market Hotspots and Opportunities
- 10.1 Market Opportunity Mapping and Growth Hotspots
- 10.2 High-Growth Applications and Customer Groups
- 10.3 Underserved Markets and White-Space Opportunities
- 10.4 Emerging Technology and Product Opportunities
- 10.5 New Capacity and Investment Hotspots
- 10.6 Market Entry and Expansion Opportunities
- 10.7 Distribution and Partnership Opportunities
- 10.8 Near-Term and Long-Term Commercial Potential
- 10.9 Opportunity Attractiveness and Execution Risks
Chapter 11 Global Neutropenia Treatment Market Outlook, 2024-2032
- 11.1 Market Size and Analysis
- 11.1.1 Revenue (Market Measurement: 2024: USD 16,547.16 million → 2032: USD 25,597.48 million)
- 11.1.2 Market Volume and Quantity Sold
- 11.1.3 Historical Market Size
- 11.1.4 Base-Year Market Size, 2024
- 11.2 Market Forecast, 2024-2032
- 11.2.1 Revenue Forecast to 2032
- 11.2.2 Volume Forecast to 2032
- 11.2.3 CAGR and Year-on-Year Growth
- 11.2.4 Incremental Revenue Opportunity
- 11.3 Forecast Assumptions and Scenario Analysis
- 11.3.1 Base-Case Forecast
- 11.3.2 Optimistic and Conservative Scenarios
- 11.3.3 Technology, Pricing and Policy Sensitivities
- 11.4 Market Attractiveness and Growth Outlook
Chapter 12 Global Neutropenia Treatment Market Segmentation and Outlook
- 12.1 Segmentation Summary and Market Shares, 2024
- 12.2 Largest and Fastest-Growing Segments
- 12.3 By Treatment - Market Size and Forecast, 2024-2032
- 12.3.1 Segment Definition and Scope
- 12.3.2 Historical Market Size
- 12.3.3 Revenue Forecast, 2024-2032
- 12.3.4 Volume Forecast, 2024-2032
- 12.3.5 Base-Year Market Share, 2024
- 12.3.6 Segment CAGR and Growth Drivers
- 12.3.7 Subsegment Market Size and Forecast
- 12.3.7.1 Colony-Stimulating Factors
- 12.3.7.2 Antibiotics
- 12.3.7.3 Anti-fungals
- 12.3.7.4 Antivirals
- 12.3.8 Subsegment Pricing and Adoption Trends
- 12.3.9 Leading Suppliers and Competition
- 12.3.10 Regional Demand and Opportunities
- 12.4 Segment Growth Comparison
- 12.5 Segment Attractiveness and Priority Matrix
Chapter 13 Global Neutropenia Treatment Geographic Market Outlook, 2024-2032
- 13.1 Regional Market Size and Share, 2024
- 13.2 Regional Market Forecast, 2024-2032
- 13.3 Regional Pricing, Production and Demand Differences
- 13.4 North America
- 13.4.1 United States
- 13.4.2 Canada
- 13.4.3 Mexico
- 13.5 Europe
- 13.5.1 Germany
- 13.5.2 France
- 13.5.3 Italy
- 13.5.4 United Kingdom
- 13.5.5 Spain
- 13.5.6 Poland
- 13.5.7 Russia
- 13.5.8 Netherlands
- 13.5.9 Belgium
- 13.5.10 Sweden
- 13.5.11 Denmark
- 13.5.12 Norway
- 13.5.13 Rest of Europe
- 13.6 Asia Pacific
- 13.6.1 China
- 13.6.2 India
- 13.6.3 Japan
- 13.6.4 South Korea
- 13.6.5 Thailand
- 13.6.6 Indonesia
- 13.6.7 Vietnam
- 13.6.8 Malaysia
- 13.6.9 Australia
- 13.6.10 Rest of Asia Pacific
- 13.7 Latin America
- 13.7.1 Brazil
- 13.7.2 Argentina
- 13.7.3 Colombia
- 13.7.4 Chile
- 13.7.5 Rest of Latin America
- 13.8 Middle East
- 13.8.1 Saudi Arabia
- 13.8.2 United Arab Emirates
- 13.8.3 Turkey
- 13.8.4 Israel
- 13.8.5 Iran
- 13.8.6 Rest of the Middle East
- 13.9 Africa
- 13.9.1 South Africa
- 13.9.2 Egypt
- 13.9.3 Nigeria
- 13.9.4 Morocco
- 13.9.5 Rest of Africa
- 13.10 Regional Investment, Policy and Supply Chain Differences
- 13.11 Regional Competitive Landscape
- 13.12 Geographic Growth Hotspots
Chapter 14 Global Neutropenia Treatment Technology, Innovation and Sustainability Outlook
- 14.1 Technology Landscape and Maturity
- 14.2 Product, Process and Service Innovation
- 14.3 AI, Automation and Digital Tools in the Industry
- 14.4 Technology Adoption and Performance Benchmarking
- 14.5 Innovation Pipeline and R&D Investment
- 14.6 Patent and Intellectual Property Trends
- 14.7 Energy Efficiency and Resource Management
- 14.8 Sustainability, Recycling and Circularity
- 14.9 Technology Roadmap, 2024-2032
- 14.10 Risks of Obsolescence and Technology Substitution
Chapter 15 Global Neutropenia Treatment Market Key Strategic Imperatives
- 15.1 Growth and Market Entry Priorities
- 15.2 High-Return Products and Segments
- 15.3 Pricing, Profitability and Cost Optimization
- 15.4 Technology Investment and Product Differentiation
- 15.5 Supply Chain Localization and Resilience
- 15.6 Distribution and Customer Acquisition
- 15.7 Partnership, Acquisition and Capacity Strategy
- 15.8 Regional Expansion Priorities
- 15.9 Short-, Medium- and Long-Term Actions
Chapter 16 Competition Outlook
- 16.1 Industry Competition Characteristics
- 16.2 Market Structure and Concentration
- 16.3 Market Share and Competitive Positioning, 2024
- 16.4 Company-Wise Revenue and Product Benchmarking
- 16.5 Production and Service Capacity Benchmarking
- 16.6 Technology, Pricing and Differentiation
- 16.7 Regional Footprint and Distribution Strength
- 16.8 Mergers, Acquisitions and Strategic Alliances
- 16.9 New Entrants and Competitive Threats
- 16.10 Porter's Five Forces and Industry Attractiveness
- 16.11 Competitive Outlook, 2024-2032
Chapter 17 Company Profiles
- 17.1 Company Coverage and Selection Criteria
- 17.2 Amgen
- 17.2.1 Business Description
- 17.2.2 Company Ownership and Geographic Presence
- 17.2.3 Product and Service Portfolio
- 17.2.4 Manufacturing and Operating Footprint
- 17.2.5 Production Capacity and Expansion Plans
- 17.2.6 Financial Performance and Investment
- 17.2.7 Market Share and Competitive Position
- 17.2.8 Technology and Innovation Capabilities
- 17.2.9 Strategic Alliances or Partnerships
- 17.2.10 Recent Developments
- 17.2.11 Growth Strategy and Outlook
- 17.3 Teva Pharmaceutical Industries Ltd.
- 17.4 Novartis AG
- 17.5 Pfizer
- 17.6 Spectrum Pharmaceuticals
- 17.7 Mylan N.V.
- 17.8 Cellerant Therapeutics
- 17.9 Kyowa Kirin
- 17.10 BeyondSpring
- 17.11 Coherus BioSciences
- 17.12 Other Relevant Market Participants
Note: Every listed company is profiled on the structure shown under the first company. The company list is preliminary and may change based on research findings, market developments, data availability and client requirements.
Chapter 18 Disclaimer
- 18.1 Research and Forecast Disclaimer
- 18.2 Data Source and Estimation Limitations
Note: The depth of individual sections depends on data availability for this market. Volume, capacity, trade and other unit-based metrics are included where applicable.