
Market Overview
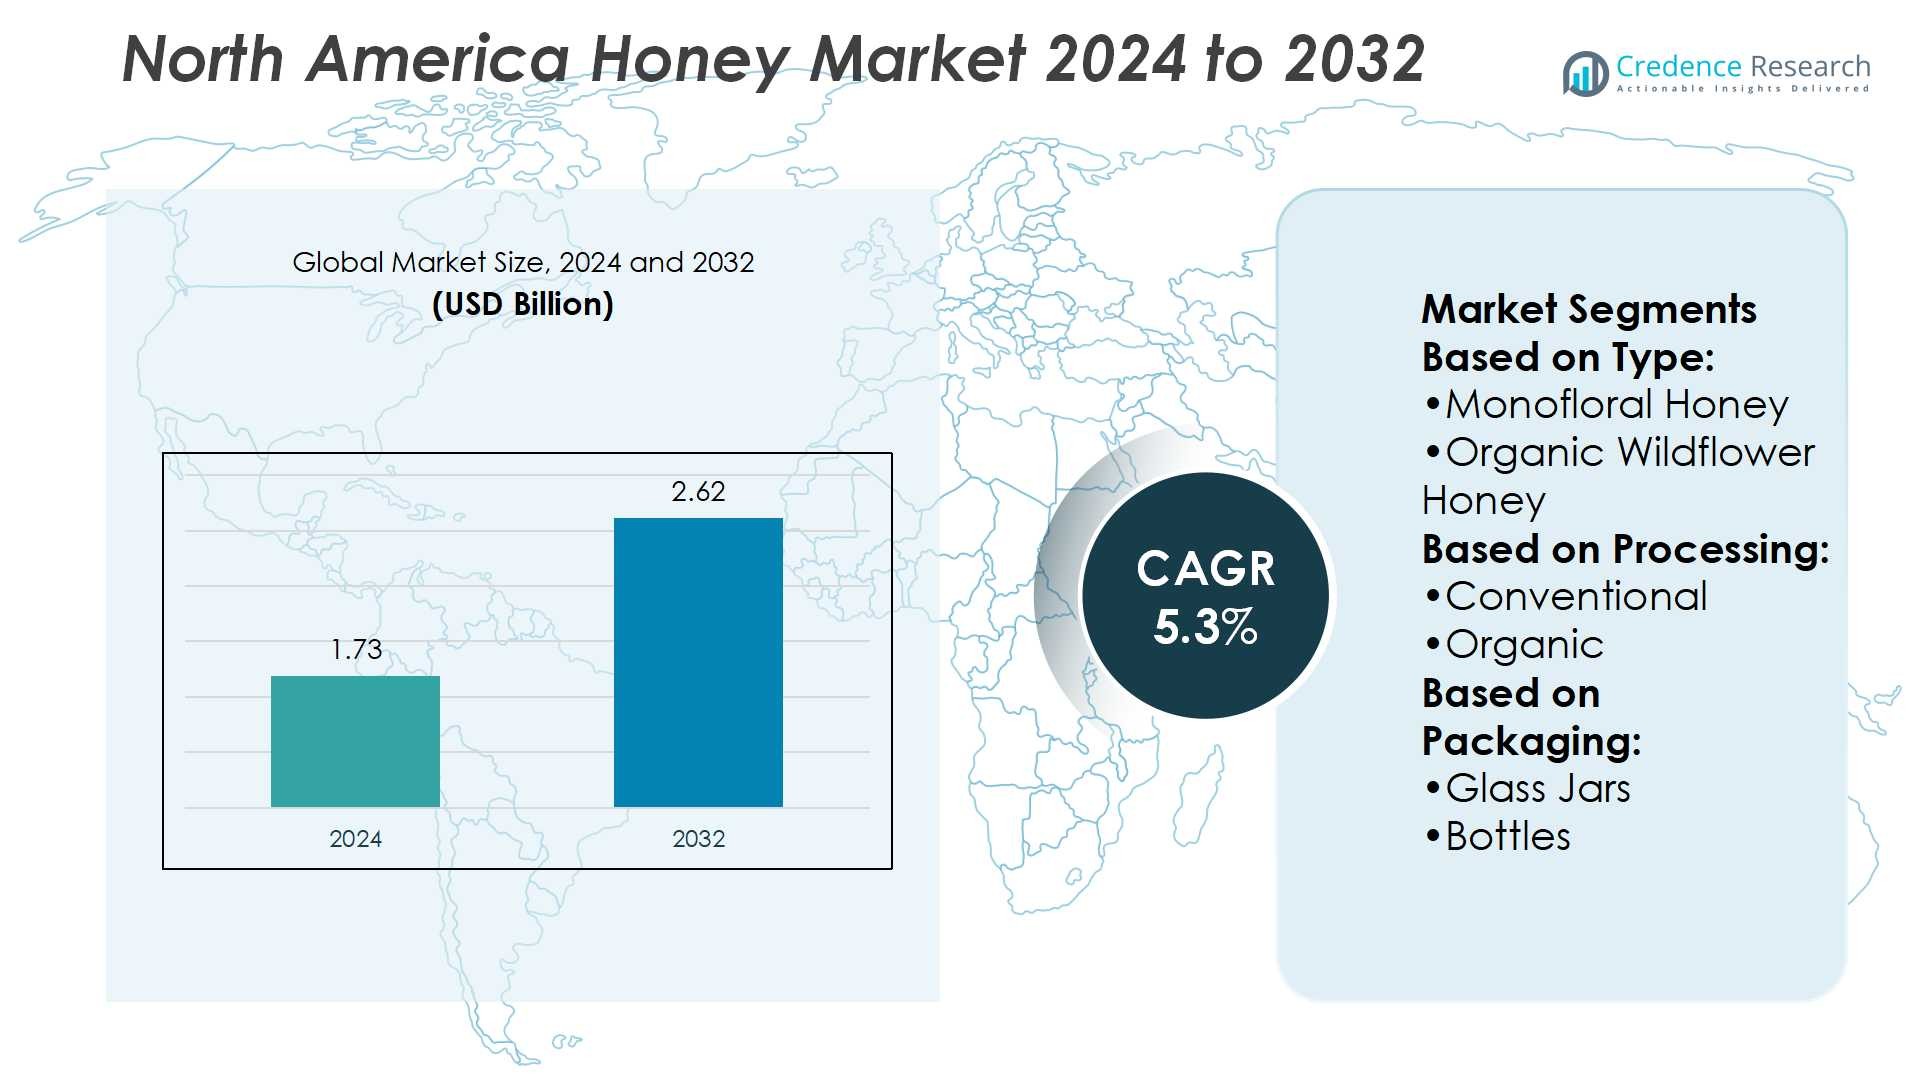
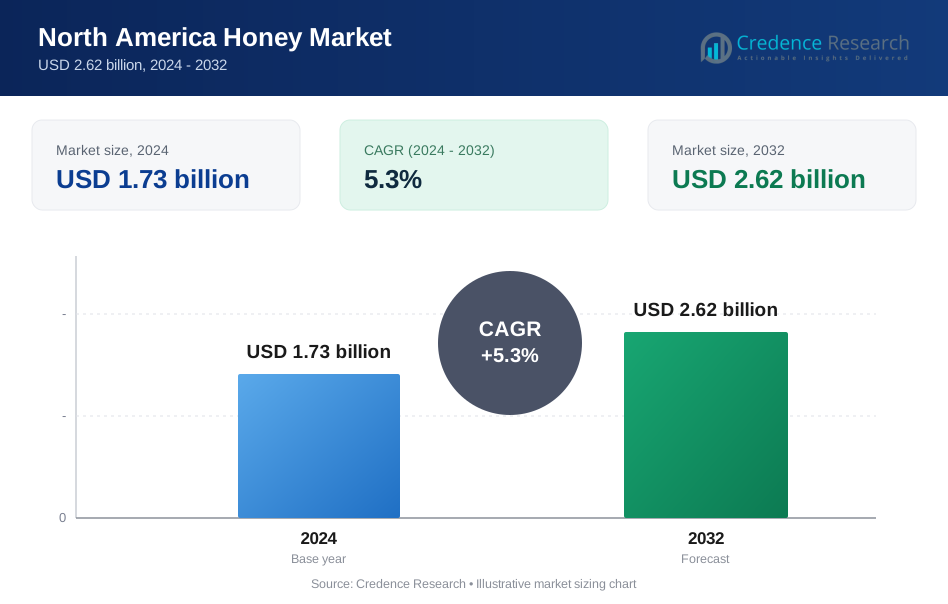
North America Honey Market size was valued USD 1.73 billion in 2024 and is anticipated to reach USD 2.62 billion by 2032, at a CAGR of 5.3% during the forecast period.
| REPORT ATTRIBUTE | DETAILS |
|---|---|
| Historical Period | 2020-2023 |
| Base Year | 2024 |
| Forecast Period | 2025-2032 |
| North America Honey Market Size 2024 | USD 1.73 Billion |
| North America Honey Market, CAGR | 5.3% |
| North America Honey Market Size 2032 | USD 2.62 Billion |
The North America honey market is shaped by the presence of prominent players such as Dow, Inc., Hanwha Azdel Inc., Lear Corporation, Owens Corning, Magna International, Inc., Momentive Performance Materials, Inc., DuPont de Nemours, Inc., Industrias Cazel, Axiom Group Inc., and Amra Plastic Moulders Inc. These companies strengthen their positions through product innovation, sustainable sourcing practices, and expansion across retail and e-commerce platforms. Among regional markets, the United States leads with a commanding 70% share, supported by large-scale beekeeping operations, strong consumer demand for natural sweeteners, and integration of honey in food, beverages, and healthcare applications.
Market Insights
- The North America honey market was valued at USD 1.73 billion in 2024 and is expected to reach USD 2.62 billion by 2032, growing at a CAGR of 5.3%.
- Market growth is driven by rising consumer preference for natural sweeteners, expanding use of honey in bakery, beverages, and healthcare, and increasing demand for premium monofloral and organic varieties.
- Key players such as Dow, Inc., Hanwha Azdel Inc., Lear Corporation, Owens Corning, and DuPont de Nemours, Inc. are focusing on innovation, sustainable sourcing, and retail as well as e-commerce expansion to strengthen their market presence.
- Restraints include price volatility from supply fluctuations and risks of adulteration, which impact consumer trust and create challenges for producers to maintain consistent quality and pricing.
- Regionally, the United States dominates with a 70% share, while glass jars lead the packaging segment, reflecting strong consumer preference for premium and eco-friendly formats.
Market Segmentation Analysis:
By Type
In the North America honey market, monofloral honey dominates with the largest market share. Its appeal lies in distinct flavors, higher nutritional value, and premium positioning, attracting health-conscious consumers. Growing awareness of varietal honeys such as clover and manuka drives stronger demand in both retail and specialty channels. Premium pricing, coupled with increasing applications in natural remedies, has further strengthened its leadership. The trend of traceability and authenticity also supports this segment, as consumers prefer transparent sourcing and purity assurance, making monofloral honey the most influential category within the market.
- For instance, Industrias Cazel operates a facility in the Estado de México with a 27,000 square meter land area, integrating advanced molding technology for the production of plastic components for the automotive and home appliance industries.
By Processing
Conventional honey accounts for the dominant share in processing, reflecting its widespread availability and affordable pricing across mass retail channels. This segment benefits from high production volumes, streamlined supply chains, and strong consumer acceptance in everyday food use. While organic honey is gaining ground due to rising demand for chemical-free and eco-friendly products, conventional honey remains the preferred choice for price-sensitive buyers. Its dominance is also supported by food manufacturers who incorporate honey as a natural sweetener in processed foods, beverages, and bakery items, ensuring strong volume consumption and stable growth.
- For instance, Magna’s interior sensing systems secured or began production on 5 OEM programs across North America, Europe, and Asia in the past 18 months. The company’s OptiForm™ one-piece battery enclosure raises usable battery space by up to 10% using a deep-draw stamping process, eliminating welds and fasteners.
By Packaging
Glass jars lead the honey packaging segment in North America, securing the largest market share due to consumer preference for sustainable and premium formats. Glass jars not only preserve honey’s flavor and quality but also align with eco-friendly purchasing trends. They remain the preferred choice in both retail and specialty outlets, where presentation and sustainability influence buyer decisions. Bottles and tubes, however, are gaining momentum among younger demographics seeking portability and convenience. Despite this, the dominance of glass jars is driven by their premium appeal, recyclability, and widespread use in branded product lines across the region.
Key Growth Drivers
Rising Demand for Natural Sweeteners
The shift toward healthier lifestyles is fueling demand for honey as a natural sugar alternative in North America. Consumers are reducing refined sugar intake and adopting natural options in daily diets. Honey’s antioxidant, antimicrobial, and anti-inflammatory properties further strengthen its appeal across diverse age groups. Food and beverage manufacturers are also integrating honey into cereals, snacks, bakery, and beverage formulations to meet clean-label requirements. This growing application base, combined with strong consumer awareness, continues to drive steady growth for honey across both retail and industrial channels.
- For instance, Lear’s ComfortMax Seat engineering integration with General Motors achieved up to 40% faster time-to-sensation for both heating and ventilation, and reduced part count by 50% through its intelligent modular design.
Expansion of Specialty and Premium Segments
Premium honey categories such as monofloral and organic varieties are witnessing robust growth. Consumers are willing to pay higher prices for traceable, authentic, and ethically sourced products. Rising awareness of the unique health benefits associated with floral sources like manuka and clover has supported product diversification. Specialty retailers and online channels are promoting premium packaging formats and limited-edition products, further enhancing visibility. The premiumization trend strengthens margins for producers while expanding choices for consumers, making this a key growth driver in the North American honey market.
- For instance, DuPont launched more than 30 new product offerings in one year that deliver both performance and sustainability advantages across sectors like advanced computing, vehicle electrification, medical devices, building materials, and water purification.
Sustainability and Eco-Friendly Packaging
Sustainability has become a major purchase influencer in the honey market. Increasing preference for recyclable and eco-friendly packaging formats such as glass jars supports brand loyalty and regulatory compliance. Beekeepers and honey producers are also emphasizing sustainable practices, including ethical beekeeping and biodiversity preservation, to meet consumer expectations. Marketing campaigns highlighting traceability and environmental responsibility have helped brands differentiate in a competitive landscape. With both regulators and consumers prioritizing eco-friendly solutions, sustainability not only boosts demand but also enhances long-term growth prospects for honey producers in the region.
Key Trends & Opportunities
Growth of E-Commerce Channels
E-commerce has emerged as a vital sales channel for honey in North America. Online platforms allow consumers to access a wider variety of honey types, including monofloral, organic, and artisanal variants that may not be available in physical stores. Subscription models and direct-to-consumer sales enhance brand engagement while offering convenience. Small and mid-sized producers are leveraging digital marketing to reach niche audiences. This shift presents significant opportunities for brands to scale quickly, diversify offerings, and establish stronger consumer loyalty through customized online experiences and direct feedback.
- For instance, Continental AG produced 200 million radar sensors to support its safety systems across global automotive platforms, underscoring its ability to scale manufacturing of precise, reliable technology products with high volume.
Innovation in Product Applications
Honey is moving beyond traditional household consumption into innovative applications across foodservice and healthcare. In beverages, honey-infused teas and functional drinks are gaining traction. Skincare and cosmetic brands are incorporating honey’s natural antibacterial and moisturizing properties into formulations. The pharmaceutical sector is exploring honey for wound healing and sore throat relief, further boosting cross-industry demand. This diversification strengthens honey’s position as a multi-functional ingredient, creating opportunities for producers to partner with food, cosmetic, and pharmaceutical companies and expand their market reach across high-growth applications.
Key Challenges
Price Volatility and Supply Constraints
The North American honey market faces challenges from fluctuating supply and price volatility. Factors such as unpredictable weather, colony collapse disorder, and rising feed costs for bees impact production. Imports often balance domestic shortages, but global supply disruptions can elevate costs. Producers struggle to maintain stable pricing without compromising quality, which affects both margins and consumer affordability. Ensuring consistent availability remains a challenge for retailers and food manufacturers, making supply chain resilience a critical focus for sustaining long-term market growth.
Adulteration and Quality Concerns
Adulteration with sugar syrups and low-quality imports continues to threaten the honey market’s credibility. Instances of mislabeling undermine consumer trust and challenge regulatory bodies to enforce stricter quality standards. Premium honey categories, which rely heavily on authenticity, are most vulnerable to reputational risks from adulterated products. Brands must invest in rigorous testing, certification, and transparent labeling to assure buyers of purity. Addressing these concerns is vital for maintaining consumer confidence, protecting market integrity, and supporting sustainable growth in the competitive North American honey market.
Regional Analysis
North America
North America holds a 32% share of the global honey market, making it one of the most prominent regions. The United States leads within the region, driven by large-scale production, high consumption, and integration of honey into food and beverage manufacturing. Rising health awareness, demand for natural sweeteners, and premiumization trends further fuel growth. Canada and Mexico add to regional strength through organic and export-oriented honey. E-commerce platforms also accelerate product reach. Regulatory support for quality standards and sustainability initiatives keeps North America at the forefront of honey market expansion worldwide.
Europe
Europe commands 28% of the global honey market, ranking as the second-largest region. Germany, Spain, and France are key contributors, supported by strong traditions of beekeeping and consumption. European consumers show high preference for organic, local, and sustainably sourced honey, aligning with the region’s strict quality regulations. Imports from Latin America and Asia also play a role in balancing demand. Premium monofloral varieties enjoy strong traction in retail and specialty channels. With consumer emphasis on authenticity, traceability, and eco-friendly packaging, Europe maintains its position as a mature but steadily expanding honey market.
Asia-Pacific
Asia-Pacific accounts for 25% of the global honey market and represents the fastest-growing region. China dominates regional production, contributing significantly to both domestic consumption and exports. Rising disposable incomes and increasing use of honey in food, cosmetics, and traditional medicines drive growth across India, Japan, and Southeast Asia. Consumers in the region are increasingly adopting organic and specialty honey, reflecting a shift toward healthier lifestyles. Expanding retail networks, urbanization, and digital commerce platforms provide further momentum. Asia-Pacific’s robust supply capabilities and evolving consumer preferences position it as a high-potential growth hub in the honey industry.
Latin America
Latin America captures 9% of the global honey market, with Mexico, Argentina, and Brazil serving as primary producers. The region is a major exporter to North America and Europe, leveraging favorable climatic conditions for apiculture. While domestic consumption remains moderate, health awareness and rising demand for natural products are expanding local honey use. Premium and organic honey types are gaining visibility, particularly in urban centers. Government programs supporting sustainable beekeeping enhance production capacity. Latin America’s strength lies in its export-driven strategy, which ensures steady revenue contributions to the global honey market.
Middle East & Africa
The Middle East & Africa region holds 6% of the global honey market, characterized by a growing demand for both traditional and premium honey varieties. Saudi Arabia and the UAE lead in consumption, with honey deeply embedded in cultural and dietary practices. African countries such as Ethiopia and Tanzania contribute significantly to production, supplying both regional and international markets. Rising disposable incomes, urbanization, and awareness of honey’s medicinal benefits fuel growth. Despite limited large-scale infrastructure, the region is witnessing expanding imports and local initiatives in sustainable apiculture, enhancing its role in the global honey landscape.
Market Segmentations:
By Type:
- Monofloral Honey
- Organic Wildflower Honey
By Processing:
- Conventional
- Organic
By Packaging:
- Glass Jars
- Bottles
By Geography
- North America
- U.S.
- Canada
- Mexico
- Europe
- Germany
- France
- U.K.
- Italy
- Spain
- Rest of Europe
- Asia Pacific
- China
- Japan
- India
- South Korea
- South-east Asia
- Rest of Asia Pacific
- Latin America
- Brazil
- Argentina
- Rest of Latin America
- Middle East & Africa
- GCC Countries
- South Africa
- Rest of the Middle East and Africa
Competitive Landscape
The North America honey market features such as Momentive Performance Materials, Inc., Owens Corning, Industrias Cazel, Hanwha Azdel Inc., Magna International, Inc., Amra Plastic Moulders Inc., Lear Corporation, Axiom Group Inc., Dow, Inc., and DuPont de Nemours, Inc. The North America honey market is highly competitive, with a mix of large-scale producers, cooperatives, and smaller artisanal brands. Companies compete by offering diverse product portfolios that include monofloral, organic, and premium honey varieties. Emphasis on sustainable sourcing, eco-friendly packaging, and transparent labeling has become central to building consumer trust. Expansion through online platforms, partnerships with retailers, and product innovations further intensify competition. Imported honey from global suppliers also adds pricing pressure, compelling domestic producers to focus on differentiation through quality and authenticity. This dynamic landscape fosters both consolidation among larger firms and growth opportunities for niche producers.
Key Player Analysis
- Momentive Performance Materials, Inc.
- Owens Corning
- Industrias Cazel
- Hanwha Azdel Inc.
- Magna International, Inc.
- Amra Plastic Moulders Inc.
- Lear Corporation
- Axiom Group Inc.
- Dow, Inc.
- DuPont de Nemours, Inc.
Recent Developments
- In February 2024, Owens Corning, a global frontrunner in the building and construction materials sector, and Masonite International Corporation, a worldwide supplier of interior and exterior doors and door systems, announced a definitive agreement.
- In January 2024, Dabur, one of the leading firms in the Ayurvedic and personal care space, recently invested approximately INR 135 crore in expanding its manufacturing facility in South India. This move is geared toward bolstering the production capacity of its flagship products, including Dabur Honey, Dabur Red Paste, and Odonil air fresheners.
- In January 2024, APIS Honey launched Apis Organic Honey, which is sourced from Kashmir. The products are available in attractive glass bottles. The products are available in different retail channels across India.
- In May 2023, Dow and New Energy Blue announced a long-term supply agreement in North America. Under this agreement, New Energy Blue will produce bio-based ethylene from renewable agricultural residues. Dow plans to buy this bio-based ethylene, which will reduce carbon emissions from plastic production, and use it in recyclable applications across transportation, footwear, and packaging.
Report Coverage
The research report offers an in-depth analysis based on Type, Processing, Packaging and Geography. It details leading market players, providing an overview of their business, product offerings, investments, revenue streams, and key applications. Additionally, the report includes insights into the competitive environment, SWOT analysis, current market trends, as well as the primary drivers and constraints. Furthermore, it discusses various factors that have driven market expansion in recent years. The report also explores market dynamics, regulatory scenarios, and technological advancements that are shaping the industry. It assesses the impact of external factors and global economic changes on market growth. Lastly, it provides strategic recommendations for new entrants and established companies to navigate the complexities of the market.
Future Outlook
- The market will expand steadily as consumers prefer natural sweeteners over refined sugar.
- Demand for organic and monofloral honey will rise with growing health awareness.
- Premium packaging formats like glass jars will strengthen appeal among eco-conscious buyers.
- Online sales channels will continue to drive accessibility and wider product reach.
- Food and beverage manufacturers will increase honey use in clean-label product lines.
- Imports will remain vital to balance domestic supply shortages in the region.
- Traceability and authenticity will become key factors shaping consumer purchasing decisions.
- Sustainability practices in beekeeping will gain greater focus from producers and regulators.
- Specialty and artisanal honey products will grow in popularity among urban consumers.
- Technological advances in processing and testing will improve quality standards and compliance.
Request a Free Sample
Fill in your details and we'll send you a free sample report.
- Sample data tables & charts
- Research methodology
Need a Custom Version of This Report?
Tailor the scope, geography, or segments to your exact requirements.
- Custom geography or segment scope
- Direct access to our analyst team
Frequently Asked Questions
What is the current market size for North America Honey Market, and what is its projected size in 2032?
At what Compound Annual Growth Rate is the North America Honey Market projected to grow between 2025 and 2032?
Which North America Honey Market segment held the largest share in 2024?
What are the primary factors fueling the growth of the North America Honey Market?
Who are the leading companies in the North America Honey Market?
Which region commanded the largest share of the North America Honey Market in 2024?
Table of Content
Chapter 1. Report Introduction
- 1.1 Report Description & Purpose
- 1.1.1 Report Title & Market Definition
- 1.1.2 Unique Selling Propositions (USP) & Key Differentiators
- 1.1.3 Value Proposition for Stakeholders
- 1.2 Research Objectives
- 1.2.1 Market Sizing Objectives (Volume & Revenue)
- 1.2.2 Segmentation Objectives
- 1.2.3 Competitive Intelligence Objectives
- 1.2.4 Forecast & Scenario Objectives
- 1.3 Report Scope
- 1.3.1 North America Honey Scope – Types & Subtypes Covered
- 1.3.2 Geographic Scope – Regions & Countries Covered
- 1.3.3 Historical Period, Base Year & Forecast Period (2024; forecast to 2032)
- 1.3.4 Inclusions & Exclusions
- 1.4 HS Code & Classification Framework
- 1.5 Currency, Units & Pricing Basis
- 1.6 Target Stakeholders
- 1.7 Limitations & Assumptions
Chapter 2. Executive Summary
- 2.1 Global North America Honey Market Snapshot
- 2.1.1 Market Size – Historical (2024) & Forecast (2024-2032) (2024: USD 1.73 billion → 2032: USD 2.62 billion)
- 2.1.2 Volume & Revenue – Global Totals
- 2.1.3 Key Market Highlights – Top Five Facts
- 2.2 North America Honey Market Segmentation Snapshot
- 2.2.1 Market Split by Region – 2024 vs. 2032
- 2.3 Competitive Snapshot
- 2.3.1 Top 10 Players by Revenue Share – 2024
- 2.3.2 Top 10 Players by Volume Share – 2024
- 2.3.3 Recent Strategic Developments (18-Month Summary)
- 2.4 Key Investment Highlights & Strategic Conclusions
Chapter 3. North America Honey Market Dynamics & Industry Analysis
- 3.1 Market Overview & Context
- 3.1.1 North America Honey Market Position in the Broader Automotive Value Chain
- 3.1.2 OEM vs. Replacement Market Dynamics
- 3.1.3 Market Maturity & Development Stage by Region
- 3.2 North America Honey Market Drivers
- 3.3 North America Honey Market Restraints & Challenges
- 3.4 North America Honey Market Opportunities
- 3.5 Porter's Five Forces Analysis
- 3.5.1 Threat of New Entrants
- 3.5.2 Bargaining Power of Suppliers
- 3.5.3 Bargaining Power of Buyers
- 3.5.4 Threat of Substitutes
- 3.5.5 Competitive Rivalry – Intensity Assessment
- 3.6 North America Honey Value Chain Analysis
- 3.6.1 Upstream – Raw Material/Input Suppliers
- 3.6.1.1 Raw Material/Input 1
- 3.6.1.2 Raw Material/Input 2
- 3.6.1.3 Raw Material/Input 3
- 3.6.2 Midstream – Production/Manufacturing/Service Delivery
- 3.6.2.1 Production/Process Overview
- 3.6.2.2 Key Facility Locations & Capacity by Manufacturer
- 3.6.3 Downstream – Distribution & End Consumer
- 3.6.3.1 Primary Channel – B2B/OEM
- 3.6.3.2 Secondary Channels – Dealer, Retail, Online, Direct
- 3.6.4 Value Chain Profitability Analysis
- 3.6.1 Upstream – Raw Material/Input Suppliers
- 3.7 PESTEL Analysis
- 3.7.1 Political Factors
- 3.7.2 Economic Factors
- 3.7.3 Social Factors
- 3.7.4 Technological Factors
- 3.7.5 Environmental Factors
- 3.7.6 Legal Factors
- 3.8 North America Honey Supply Chain Analysis
- 3.8.1 Raw Material/Input Supply Risk Assessment
- 3.8.2 Manufacturing Concentration Risk (Geographic Exposure)
- 3.8.3 Trade Disruption Impact Analysis
- 3.9 Regulatory & Policy Landscape
Note: The regulatory and policy landscape section covers regulations based on their applicability to the market, North America Honey category, geography, and scope of the study. Only regulatory frameworks with a material impact on operations, compliance, trade, sustainability, or market access are analyzed in detail.
Chapter 4. Key Investment Pockets & Opportunity Analysis
- 4.1 North America Honey Market Attractiveness Analysis
- 4.1.1 By Region – Investment Attractiveness Matrix (Volume × CAGR)
- 4.2 Absolute Revenue Growth Opportunity
- 4.2.1 By Region – Absolute USD Growth Through 2032
- 4.3 Incremental Volume Opportunity
- 4.3.1 By Region – Incremental Volume Through 2032
- 4.3.2 Segment – Incremental Volume
- 4.4 Emerging Submarket Opportunity Deep Dive (Subject to Applicability)
- 4.5 Emerging Market Opportunity Scorecards
- 4.5.1 United States
- 4.5.2 Europe
- 4.5.3 Asia
- 4.5.4 Middle East & Africa
Note: Emerging Market Opportunity Scorecards will be included based on relevance and strategic importance. Regions listed are indicative and may vary depending on data availability and market dynamics.
Chapter 5. North America Honey Import-Export Analysis & Trade Flows
- 5.1 Global Trade Overview
- 5.1.1 Global Export Value by Country (2024)
- 5.1.2 Global Export Volume by Country (2024)
- 5.1.3 Global Import Value by Country (2024)
- 5.1.4 Global Import Volume by Country (2024)
- 5.1.5 Net Trade Balance by Country (2024)
- 5.2 Export Analysis – Segment
- 5.2.1 Type 1 (HS Code)
- 5.2.2 Type 2 (HS Code)
- 5.2.3 Type 3 (HS Code)
- 5.2.4 Type 4 (HS Code)
- 5.2.5 Type 5 (HS Code)
- 5.3 Import Analysis – Segment
- 5.3.1 Type 1 (HS Code)
- 5.3.2 Type 2 (HS Code)
- 5.3.3 Type 3 (HS Code)
- 5.3.4 Type 4 (HS Code)
- 5.3.5 Type 5 (HS Code)
- 5.4 Average Unit Trade Prices
- 5.4.1 Average Export Price – Segment & Country
- 5.4.2 Average Import Price – Segment & Source Country
- 5.4.3 Price Trends (2024)
- 5.5 Key Trade Route Analysis
- 5.5.1 Trade Route 1
- 5.5.2 Trade Route 2
- 5.5.3 Trade Route 3
- 5.5.4 Trade Route 4
- 5.5.5 Trade Route 5
- 5.6 Trade Policy Impact Assessment
- 5.6.1 US Anti-Dumping & Section 301 Tariffs
- 5.6.2 EU Customs Union Impact
- 5.6.3 Major Free Trade Agreements
- 5.6.4 USMCA Rules of Origin
Note: Trade policy analysis will be included only where relevant to the North America Honey market.
Chapter 6. Competitive Landscape & Company Benchmarking
- 6.1 North America Honey Market Concentration & Structure
- 6.1.1 Herfindahl-Hirschman Index (HHI) – vs. 2024
- 6.1.2 Tier 1, Tier 2 & Tier 3 Market Structure
- 6.1.3 Global, Regional & Local Player Dynamics
- 6.2 North America Honey Market Share Analysis – 2024
- 6.2.1 Global Revenue Share by Company
- 6.2.2 Global Volume Share by Company
- 6.2.3 Regional Revenue Share
- 6.2.4 Market Share Evolution ( vs. 2024)
- 6.2.5 OEM Segment Share by Company
- 6.2.6 Replacement Segment Share by Company
- 6.3 Production/Delivery Capacity & Facility Analysis
- 6.3.1 Global Installed Capacity
- 6.3.2 Capacity Utilization Rates
- 6.3.3 Production/Output Volume
- 6.3.4 Facility Locations & Capacity Map
- 6.3.5 Planned Capacity Additions
- 6.4 North America Honey Competitive Benchmarking Matrix
- 6.4.1 Revenue, Volume, CAGR & Profitability Comparison
- 6.4.2 Channel Revenue Mix
- 6.4.3 Geographic Revenue Exposure
- 6.4.4 R&D Intensity
- 6.4.5 Sustainability Maturity
- 6.5 Strategic Developments in North America Honey (Last 24 Months)
- 6.5.1 Mergers, Acquisitions & Divestments
- 6.5.2 New North America Honey Launches
- 6.5.3 Facility Expansions
- 6.5.4 Strategic Alliances, Joint Ventures & Partnerships
- 6.5.5 Distribution Expansion & Market Entry
- 6.5.6 Sustainability & ESG Initiatives
- 6.6 Competitive Strategy Mapping
- 6.6.1 Leader, Challenger, Follower & Niche Classification
- 6.6.2 Pricing Strategy Comparison
- 6.6.3 Channel Strategy Matrix
Note: Strategic developments are included based on their materiality and the availability of reliable information.
Chapter 7. Global North America Honey Market – By Distribution Channel
- 7.1 Segment Overview
- 7.1.1 Volume & Revenue Split by Channel (2024 & 2032)
- 7.1.2 Channel Mix Evolution (2024-2032)
Chapter 8. Regional Market Analysis – Global Overview
- 8.1 Global Regional Overview
- 8.1.1 Regional Volume Share
- 8.1.2 Regional Revenue Share
- 8.1.3 Regional Volume by Region
- 8.1.4 Regional Revenue by Region
- 8.1.5 Regional Forecast Through 2032
- 8.2 Cross-Regional Segment Analysis
- 8.2.1 By Distribution Channel
- 8.2.2 By Brand/Price Tier
Chapter 9. North America North America Honey Market
- 9.1 United States
- 9.2 Canada
- 9.3 Mexico
Chapter 10. Europe North America Honey Market
- 10.1 Germany
- 10.2 France
- 10.3 Italy
- 10.4 United Kingdom
- 10.5 Spain
- 10.6 Poland
- 10.7 Russia
- 10.8 Netherlands
- 10.9 Belgium
- 10.10 Sweden
- 10.11 Denmark
- 10.12 Norway
- 10.13 Rest of Europe
Chapter 11. Asia Pacific North America Honey Market
- 11.1 China
- 11.2 India
- 11.3 Japan
- 11.4 South Korea
- 11.5 Thailand
- 11.6 Indonesia
- 11.7 Vietnam
- 11.8 Malaysia
- 11.9 Australia
- 11.10 Rest of Asia Pacific
Chapter 12. Latin America North America Honey Market
- 12.1 Brazil
- 12.2 Argentina
- 12.3 Colombia
- 12.4 Chile
- 12.5 Rest of Latin America
Chapter 13. Middle East North America Honey Market
- 13.1 Saudi Arabia
- 13.2 United Arab Emirates
- 13.3 Turkey
- 13.4 Israel
- 13.5 Iran
- 13.6 Rest of the Middle East
Chapter 14. Africa North America Honey Market
- 14.1 South Africa
- 14.2 Egypt
- 14.3 Nigeria
- 14.4 Morocco
- 14.5 Rest of Africa
Chapter 15. North America Honey Company Profiles
- 15.1 [Company 01]
- 15.1.1 Company Overview
- 15.1.2 Key Management Personnel
- 15.1.3 Products & Services Portfolio
- 15.1.4 Financial Performance
- 15.1.5 Key Market Focus & Geographic Presence
- 15.1.6 Recent Developments & Strategic Initiatives
Note: The company profile list is preliminary and may change based on research findings, market developments, data availability, and client requirements.
Chapter 16. Appendices
- Appendix A – List of Abbreviations & Acronyms
- Appendix B – Industry Classification Code Reference – Full Series
- Appendix C – Production & Capacity Data Tables
- Appendix D – End-Use & Demand Base Tables
- Appendix E – Consumption & Replacement Rate Assumptions
- Appendix F – ASP Reference Tables
- Appendix G – Manufacturing & Facility Database
- Appendix H – Import-Export Data Tables
- Appendix I – Regulatory Summary Tables
- Appendix J – Primary Research Participant List (Anonymized)
- Appendix K – Primary Research Questionnaire Framework
- Appendix L – Data Sources & Bibliography
- Appendix M – Market Size Divergence & Source Comparison
Chapter 17. Research Methodology
- 17.1 Research Framework & Philosophy
- 17.2 Secondary Research – Sources, Hierarchy & Data Extraction
- 17.3 Data Modeling – Bottom-Up & Top-Down Market Sizing
- 17.4 Primary Research – Stakeholder Framework, LOI & Sample Sizes
- 17.5 Forecast Methodology – Regression, Scenario & Sensitivity Analysis
- 17.6 Quality Control – Four-Layer Validation Framework
- 17.7 Limitations & Standard Assumptions
- 17.8 Disclaimer
