
Market Overview
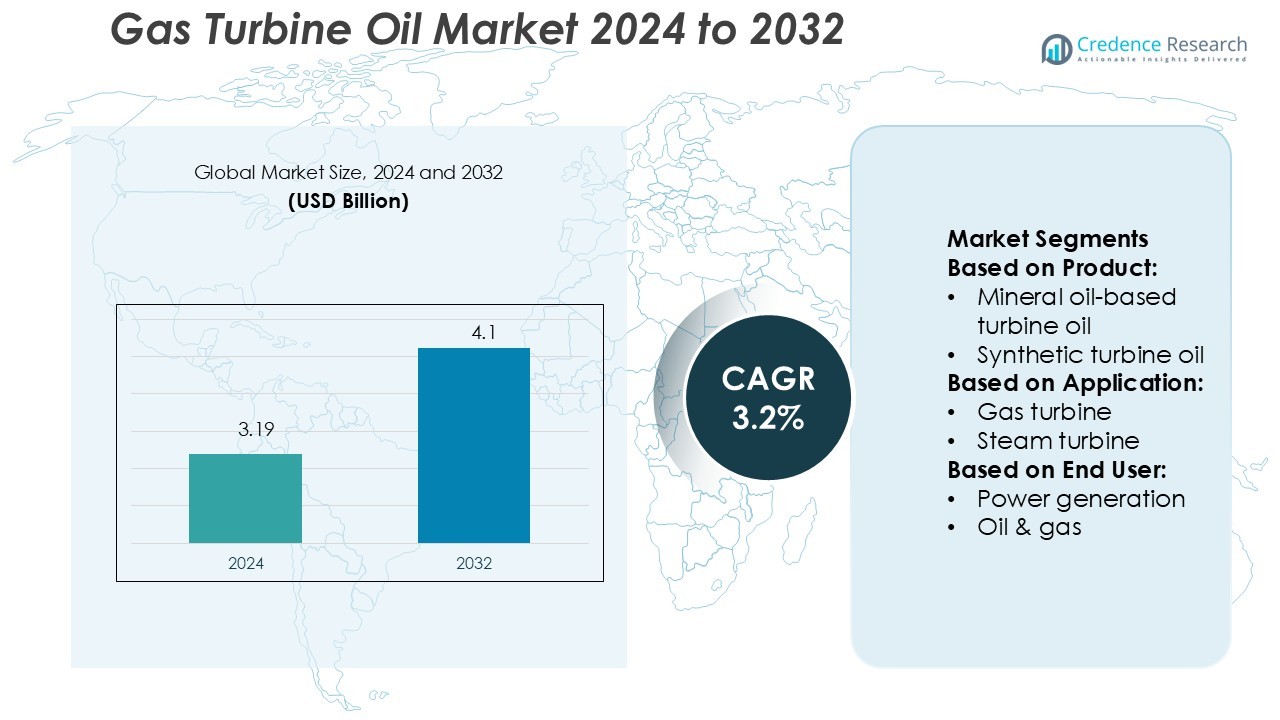
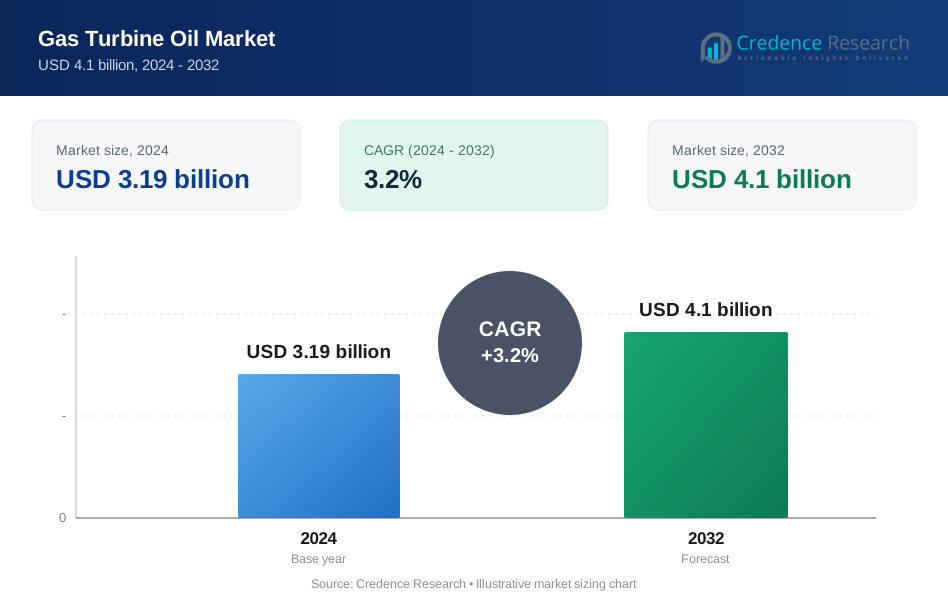
Gas Turbine Oil Market size was valued USD 3.19 billion in 2024 and is anticipated to reach USD 4.1 billion by 2032, at a CAGR of 3.2% during the forecast period.
| REPORT ATTRIBUTE | DETAILS |
|---|---|
| Historical Period | 2020-2023 |
| Base Year | 2024 |
| Forecast Period | 2025-2032 |
| Gas Turbine Oil Market Size 2024 | USD 3.19 Billion |
| Gas Turbine Oil Market, CAGR | 3.2% |
| Gas Turbine Oil Market Size 2032 | USD 4.1 Billion |
The Gas Turbine Oil Market is driven by major players including Chevron U.S.A, Idemitsu, FUCHS, Exxon Mobil Corporation, BP Lubricants, Kluber Lubrication, Indian Oil Corporation, Eastern Petroleum, Lubrizol, and Eastman Chemical Company. These companies focus on advanced turbine oil formulations, enhanced thermal stability, and longer operational lifespans to support power generation and industrial applications. North America leads the global market with a 36.7% share, supported by strong energy infrastructure, high turbine installation rates, and early adoption of synthetic oils. Continuous R&D investments, strict emission regulations, and demand for efficient energy systems strengthen the region’s dominance. Global players are also expanding production and distribution networks to maintain competitiveness in this high-growth market.
Market Insights
- The Gas Turbine Oil Market size was valued at USD 3.19 billion in 2024 and is projected to reach USD 4.1 billion by 2032, at a CAGR of 3.2%.
- Rising power generation capacity and growing demand for efficient turbine performance are driving market growth.
- Synthetic oil segment holds a dominant share due to superior thermal stability and extended operational lifespan.
- North America leads the global market with a 36.7% share, supported by strong energy infrastructure and advanced turbine installations.
- Competitive strategies focus on R&D, emission compliance, and supply chain expansion to strengthen global presence.
Market Segmentation Analysis:
By Product
Synthetic turbine oil dominates the Gas Turbine Oil Market with a significant market share. Its superior thermal stability, oxidation resistance, and longer service life make it the preferred option for modern turbines. Synthetic formulations reduce maintenance frequency and minimize component wear, supporting higher operational efficiency. The segment benefits from rising demand for high-performance lubricants in critical applications such as combined-cycle power plants and industrial turbines. Bio-based turbine oils are growing steadily, driven by environmental regulations and sustainability goals, while mineral oil-based products remain relevant for cost-sensitive operations and legacy systems.
- For instance, Chevron's GST® Oil line is known for its thermal and oxidation robustness. The ISO 32 grade typically reports a kinematic viscosity at 40 °C of 32.0 cSt. While the initial acid number is very low (less than 0.16 mg KOH/g is achievable), a more telling indicator of the oil's long-term stability is its ability to withstand over 17,000 hours in an oxidation stability test before reaching an acid number of 2.0 mg KOH/g.
By Application
Gas turbines hold the largest share in the application segment, supported by widespread use in power generation and industrial operations. The need for consistent lubrication, effective heat dissipation, and deposit control drives demand for advanced turbine oils in this segment. Operators prefer high-performance synthetic oils to enhance efficiency and extend maintenance intervals. Steam and hydro turbines represent stable demand, mainly from utilities and manufacturing sectors. Other applications contribute a smaller share, largely driven by niche installations and backup power systems.
- For instance, Idemitsu’s Daphne Super Turbine Oil MG32 (ISO VG 32) is engineered for high thermal stability, featuring a kinematic viscosity of 32.58 mm²/s at 40 °C and 5.704 mm²/s at 100 °C, ensuring stable film strength during continuous operation.
By End User
Power generation is the leading end-user segment in the Gas Turbine Oil Market, holding the largest market share. Expanding energy infrastructure and rising electricity demand increase the need for efficient turbine operations, driving lubricant consumption. Gas turbine oils support uninterrupted power supply, lower downtime, and improve turbine life cycles. The oil and gas sector follows closely, using these oils for critical equipment in upstream and midstream operations. Aviation and industrial manufacturing also contribute to steady demand, while the marine segment shows moderate growth from offshore operations and vessel propulsion systems.
Key Growth Drivers
Rising Power Generation Capacity
The global increase in power generation capacity is a key growth driver for the gas turbine oil market. Many countries are expanding gas-based power plants to meet rising electricity demand and reduce coal reliance. Gas turbines require high-quality lubricants for better thermal stability and reduced maintenance costs. The growing shift toward combined cycle power plants also boosts demand. Power utilities are investing in modern turbines that operate at higher temperatures, which increases lubricant consumption and replacement rates, supporting steady market growth.
- For instance, FUCHS’s RENOLIN ETERNA turbine oil line (ISO VG 32 grade) achieves a TOST life of > 10,000 hours according to ISO 4263, illustrating its high thermal-oxidative stability under continuous turbine operation.
Expansion of Aviation and Aerospace Sector
The aviation sector’s rapid expansion is driving higher demand for turbine oils. Modern aircraft engines need lubricants with superior oxidation resistance and thermal stability. Airlines are increasing fleet sizes and operational frequency, boosting turbine oil usage. Rising air passenger traffic, particularly in Asia Pacific and the Middle East, supports this demand. Maintenance schedules in commercial aviation require regular oil changes and monitoring, creating consistent product consumption. Aerospace engine manufacturers are also adopting advanced synthetic oils to enhance performance and reduce engine wear.
- For instance, Exxon Mobil’s Mobil Jet Oil 254 is engineered for aircraft-type gas turbine engines and is rated for use down to –62 °C pour point and up to 232 °C bulk oil operating conditions.
Shift Toward Cleaner Energy Sources
The transition toward cleaner energy sources is supporting the adoption of natural gas-fired turbines. Natural gas power plants offer lower emissions and better efficiency compared to coal. This transition creates strong demand for specialized turbine oils designed for high-temperature and low-emission operations. Governments are promoting gas-based energy projects through supportive policies and investments. Power plant operators are adopting high-performance lubricants to maximize turbine life, reduce operational downtime, and improve overall plant efficiency, fueling market expansion.
Key Trends & Opportunities
Increased Use of Synthetic Lubricants
The adoption of synthetic turbine oils is a growing trend in the gas turbine oil market. These lubricants provide superior oxidation resistance, better viscosity stability, and longer service life. Operators prefer synthetic oils to minimize unplanned maintenance and extend turbine operating cycles. The rising complexity of modern turbines drives demand for advanced oil formulations. Suppliers are launching high-performance synthetic products tailored to new turbine designs, creating strong opportunities for product differentiation and long-term contracts.
- For instance, BP’s Turbo Oil 2380-a widely used 5 cSt synthetic turbine lubricant-features a kinematic viscosity of 24.2 mm²/s at 40 °C and 4.97 mm²/s at 100 °C, ensuring stable film strength during high-temperature turbine operations.
Integration of Digital Monitoring Systems
Digitalization is enabling predictive maintenance in gas turbine operations. Advanced sensors and analytics tools track lubricant condition in real time. This helps operators schedule maintenance more efficiently and extend oil change intervals. OEMs and lubricant suppliers are collaborating on smart lubrication solutions that support reliability and cost reduction. The adoption of digital monitoring creates opportunities for service-based models and long-term supply agreements. This trend improves operational efficiency and supports steady product demand.
- For instance, Klüber’s Klüberoil EE 1-46 turbine and generator oil for hydro plants supports bearings across wide temperatures and exhibits excellent oxidation stability and low foaming behaviour.
Growing Investments in Renewable Gas Projects
Rising investments in renewable natural gas and hydrogen-based turbines create new opportunities for lubricant manufacturers. These next-generation turbines require specialized oils that can withstand variable operating conditions. Governments are funding clean energy projects to support decarbonization targets, accelerating turbine installations. Suppliers can capitalize on this shift by developing oils tailored to renewable gas and hybrid turbine systems. This expands product applications and strengthens market presence in emerging clean energy segments.
Key Challenges
Fluctuating Crude Oil Prices
Volatile crude oil prices pose a major challenge for the gas turbine oil market. Price fluctuations impact raw material costs and create uncertainties for manufacturers and end-users. Lubricant suppliers face pressure to maintain stable pricing while managing production expenses. Unstable costs can also delay procurement decisions by power producers and industrial operators. These fluctuations affect profitability and make long-term contract planning more complex, especially in price-sensitive regions.
Stringent Environmental Regulations
Tightening environmental regulations on emissions and oil disposal create compliance challenges for the industry. Operators must use eco-friendly lubricants that meet strict environmental standards. These regulations increase formulation costs and limit the use of certain additives. Companies need to invest in cleaner technologies and sustainable product development to meet compliance requirements. Smaller manufacturers may struggle to adapt, which can impact market competition and overall supply chain dynamics.
Regional Analysis
North America
North America dominates the gas turbine oil market with a 39.4% share in 2024. The region’s leadership is driven by extensive natural gas infrastructure and a strong base of combined cycle power plants. The U.S. plays a central role with continuous investments in grid modernization and cleaner power generation. The presence of large aviation and industrial sectors also contributes to high lubricant consumption. OEM partnerships and advanced synthetic oil adoption further strengthen market expansion. Supportive regulations promoting low-emission energy solutions continue to accelerate regional demand, ensuring steady growth over the forecast period.
Europe
Europe holds a 25.1% market share in the global gas turbine oil market. The region benefits from a well-developed energy network, strong environmental regulations, and early adoption of renewable integration. Countries such as Germany, the U.K., and France are replacing aging coal plants with gas-based power facilities, driving turbine lubricant use. The aviation sector’s recovery post-pandemic also adds to demand. Moreover, ongoing investment in hydrogen-ready gas turbines presents new opportunities for high-performance oils. Strict sustainability goals and advanced maintenance technologies support stable growth across key European markets.
Asia Pacific
Asia Pacific accounts for a 28.6% market share in the gas turbine oil market. Rapid industrialization, urbanization, and rising energy demand fuel strong regional growth. China, India, and Japan are expanding gas-fired power generation to reduce emissions and ensure energy security. The booming aviation sector across major hubs further drives turbine lubricant consumption. Regional governments are investing heavily in LNG infrastructure and efficient turbine technologies. Increasing adoption of synthetic oils and advanced maintenance systems supports long-term market expansion, making Asia Pacific the fastest-growing region during the forecast period.
Latin America
Latin America holds a 2.7% market share in the gas turbine oil market. The region’s demand is supported by expanding gas-based power generation projects in countries like Brazil and Mexico. Aging thermal infrastructure is being upgraded with modern, efficient turbines to improve reliability and reduce emissions. Economic growth and increasing air traffic are also driving lubricant demand in aviation. Although regulatory frameworks are less stringent compared to developed regions, investment in cleaner technologies is growing. Market expansion remains moderate but stable, supported by regional energy diversification strategies.
Middle East & Africa
The Middle East & Africa region represents a 4.2% market share in the global gas turbine oil market. Abundant natural gas reserves and strong investment in power generation support stable demand. Countries such as Saudi Arabia and the UAE are modernizing existing plants with high-efficiency turbines. The aviation sector’s regional expansion, especially in major hubs, contributes to rising lubricant consumption. Strategic government projects focused on cleaner energy and efficient operations further boost growth. Increasing interest in synthetic lubricants and long-life oils enhances equipment performance in extreme climate conditions.
Market Segmentations:
By Product:
- Mineral oil-based turbine oil
- Synthetic turbine oil
By Application:
- Gas turbine
- Steam turbine
By End User:
- Power generation
- Oil & gas
By Geography
- North America
- U.S.
- Canada
- Mexico
- Europe
- Germany
- France
- U.K.
- Italy
- Spain
- Rest of Europe
- Asia Pacific
- China
- Japan
- India
- South Korea
- South-east Asia
- Rest of Asia Pacific
- Latin America
- Brazil
- Argentina
- Rest of Latin America
- Middle East & Africa
- GCC Countries
- South Africa
- Rest of the Middle East and Africa
Competitive Landscape
The Gas Turbine Oil Market is shaped by key players such as Chevron U.S.A, Idemitsu, FUCHS, Exxon Mobil Corporation, BP Lubricants, Kluber Lubrication, Indian Oil Corporation, Eastern Petroleum, Lubrizol, and Eastman Chemical Company. The Gas Turbine Oil Market is becoming more competitive due to rapid technological advancement and rising demand for high-performance lubricants. Companies are focusing on synthetic and bio-based formulations to meet strict emission regulations and support cleaner energy generation. R&D investments aim to improve oxidation resistance, reduce thermal degradation, and extend oil life cycles. Many manufacturers are also adopting digital monitoring systems to enable predictive maintenance and reduce downtime. Expansion into developing power infrastructure markets is creating strong growth potential. Product differentiation, operational efficiency, and regulatory compliance remain key factors shaping competitive strategies.
Key Player Analysis
- Chevron U.S.A
- Idemitsu
- FUCHS
- Exxon Mobil Corporation
- BP Lubricants
- Kluber Lubrication
- Indian Oil Corporation
- Eastern Petroleum
- Lubrizol
- Eastman Chemical Company
Recent Developments
- In October 2025, Siemens Energy announced the expansion of its gas turbine manufacturing operations in Houston, Texas. The new facility aims to enhance the production of advanced, high-efficiency gas turbines tailored for combined cycle and peaking power applications.
- In April 2025, Harbin Electric successfully filled the gas turbine foundation for the Manzanillo Project in Mexico, fulfilling all of the contract’s performance requirements. The project team has subbed civil works out since March of 2023 and has effectively utilized local resources coupled with calibrated the construction plan.
- In June 2024, GE Vernova secured a major order for gas turbines for power plants in Saudi Arabia, along with a 21-year service agreement with ACWA Power’s subsidiary, NOMAC. This long-term service agreement will ensure the efficient operation of the gas turbines, which are capable of delivering up to 3.8 GW of power and integrating carbon capture systems to minimize emissions.
- In January 2024, Baker Hughes set up a new Hydrogen Testing Facility at the site in Florence, Italy, with the goal of determining the functionality of NovaLT industrial turbines with blends of hydrogen at or around 100%. The facility is equipped with a high-pressure test bench which allows for all-out load exercises.
Report Coverage
The research report offers an in-depth analysis based on Product, Application, End-User and Geography. It details leading market players, providing an overview of their business, product offerings, investments, revenue streams, and key applications. Additionally, the report includes insights into the competitive environment, SWOT analysis, current market trends, as well as the primary drivers and constraints. Furthermore, it discusses various factors that have driven market expansion in recent years. The report also explores market dynamics, regulatory scenarios, and technological advancements that are shaping the industry. It assesses the impact of external factors and global economic changes on market growth. Lastly, it provides strategic recommendations for new entrants and established companies to navigate the complexities of the market.
Future Outlook
- Demand for synthetic turbine oils will grow due to better thermal stability.
- Bio-based lubricants will gain traction with stricter environmental regulations.
- Advanced R&D will focus on improving oxidation resistance and oil durability.
- Digital monitoring tools will support predictive maintenance and reduce downtime.
- Power generation modernization will increase turbine oil consumption globally.
- Emerging markets will drive new investments in energy infrastructure.
- Product innovation will enhance turbine performance and operational reliability.
- Regulatory compliance will shape lubricant formulation and production strategies.
- Strategic partnerships will expand global supply chains and distribution networks.
- Focus on energy efficiency will strengthen market competitiveness.
Request a Free Sample
Fill in your details and we'll send you a free sample report.
- Sample data tables & charts
- Research methodology
Need a Custom Version of This Report?
Tailor the scope, geography, or segments to your exact requirements.
- Custom geography or segment scope
- Direct access to our analyst team
Frequently Asked Questions
What is the current market size for the Gas Turbine Oil Market, and what is its projected size in 2032?
At what Compound Annual Growth Rate is the Gas Turbine Oil Market projected to grow between 2025 and 2032?
Which Gas Turbine Oil Market segment held the largest share in 2024?
What are the primary factors fueling the growth of the Gas Turbine Oil Market?
Who are the leading companies in the Gas Turbine Oil Market?
Which region commanded the largest share of the Gas Turbine Oil Market in 2024?
Table of Content
Chapter 1. Report Introduction
- 1.1 Report Description & Purpose
- 1.1.1 Report Title & Market Definition
- 1.1.2 Unique Selling Propositions (USP) & Key Differentiators
- 1.1.3 Value Proposition for Stakeholders
- 1.2 Research Objectives
- 1.2.1 Market Sizing Objectives (Volume & Revenue) (Volume Where Applicable)
- 1.2.2 Segmentation Objectives
- 1.2.3 Competitive Intelligence Objectives
- 1.2.4 Forecast & Scenario Objectives
- 1.3 Report Scope
- 1.3.1 Gas Turbine Oil Scope – Segments & Subsegments Covered
- 1.3.2 Geographic Scope – Regions & Countries Covered
- 1.3.3 Historical Period, Base Year & Forecast Period (2024; forecast to 2032)
- 1.3.4 Inclusions & Exclusions
- 1.4 Industry Classification & Applicable Codes
- 1.5 Currency, Measurement Units & Valuation Basis
- 1.6 Target Stakeholders
- 1.7 Limitations & Assumptions
Chapter 2. Executive Summary
- 2.1 Global Gas Turbine Oil Market Snapshot
- 2.1.1 Market Size – Historical (2024) & Forecast (2024-2032) (2024: USD 3.19 billion → 2032: USD 4.1 billion)
- 2.1.2 Volume & Revenue – Global Totals (Volume Where Applicable)
- 2.1.3 Key Market Highlights – Top Five Facts
- 2.2 Gas Turbine Oil Market Segmentation Snapshot
- 2.2.1 Market Split by Region – 2024 vs. 2032
- 2.3 Competitive Snapshot
- 2.3.1 Top 10 Players by Revenue Share – 2024
- 2.3.2 Top 10 Players by Volume Share – 2024 (Volume Where Applicable)
- 2.3.3 Recent Strategic Developments (18-Month Summary)
- 2.4 Key Investment Highlights & Strategic Conclusions
Chapter 3. Gas Turbine Oil Market Dynamics & Industry Analysis
- 3.1 Market Overview & Context
- 3.1.1 Gas Turbine Oil Market Position in the Broader Industry Value Chain
- 3.1.2 Demand Structure & Purchasing Dynamics
- 3.1.3 Market Maturity & Development Stage by Region
- 3.2 Gas Turbine Oil Market Drivers
- 3.3 Gas Turbine Oil Market Restraints & Challenges
- 3.4 Gas Turbine Oil Market Opportunities
- 3.5 Porter's Five Forces Analysis
- 3.5.1 Threat of New Entrants
- 3.5.2 Bargaining Power of Suppliers
- 3.5.3 Bargaining Power of Buyers
- 3.5.4 Threat of Substitutes
- 3.5.5 Competitive Rivalry – Intensity Assessment
- 3.6 Gas Turbine Oil Value Chain Analysis
- 3.6.1 Upstream – Key Inputs, Resources & Suppliers
- 3.6.1.1 Key Input/Resource 1
- 3.6.1.2 Key Input/Resource 2
- 3.6.1.3 Key Input/Resource 3
- 3.6.2 Midstream – Core Operations & Value Creation
- 3.6.2.1 Operating Model & Process Overview
- 3.6.2.2 Key Operating Locations & Capabilities by Company
- 3.6.3 Downstream – Market Channels & End Users
- 3.6.3.1 Direct Sales & Customer Engagement Channels
- 3.6.3.2 Indirect Sales, Intermediaries & Partner Channels
- 3.6.4 Value Chain Profitability Analysis
- 3.6.1 Upstream – Key Inputs, Resources & Suppliers
- 3.7 PESTEL Analysis
- 3.7.1 Political Factors
- 3.7.2 Economic Factors
- 3.7.3 Social Factors
- 3.7.4 Technological Factors
- 3.7.5 Environmental Factors
- 3.7.6 Legal Factors
- 3.8 Gas Turbine Oil Supply Chain Analysis
- 3.8.1 Critical Input & Resource Availability Risk Assessment
- 3.8.2 Supplier & Operational Concentration Risk (Geographic Exposure)
- 3.8.3 Supply & Service Disruption Impact Analysis
- 3.9 Regulatory & Policy Landscape
Note: The regulatory and policy landscape section covers regulations based on their applicability to the market, Gas Turbine Oil category, geography, and scope of the study. Only regulatory frameworks with a material impact on operations, compliance, trade, sustainability, or market access are analyzed in detail.
Chapter 4. Key Investment Pockets & Opportunity Analysis
- 4.1 Gas Turbine Oil Market Attractiveness Analysis
- 4.1.1 By Region – Investment Attractiveness Matrix (Market Size × CAGR)
- 4.2 Absolute Revenue Growth Opportunity
- 4.2.1 By Region – Absolute Revenue Growth Through 2032
- 4.3 Incremental Demand Opportunity
- 4.3.1 By Region – Incremental Demand Through 2032
- 4.3.2 Segment – Incremental Demand
- 4.4 Emerging Submarket Opportunity Deep Dive (Subject to Applicability)
- 4.5 Priority Market Opportunity Scorecards
- 4.5.1 United States
- 4.5.2 Europe
- 4.5.3 Asia
- 4.5.4 Middle East & Africa
Note: Priority market opportunity scorecards reflect the geographic scope and strategic relevance of the study. Listed markets are indicative and may be adapted to the industry.
Chapter 5. Gas Turbine Oil Cross-Border Trade & Market Access Analysis
- 5.1 International Trade & Cross-Border Activity Overview
- 5.1.1 Global Export Value by Country (2024)
- 5.1.2 Global Export Volume by Country (2024) (Volume Where Applicable)
- 5.1.3 Global Import Value by Country (2024)
- 5.1.4 Global Import Volume by Country (2024) (Volume Where Applicable)
- 5.1.5 Net Trade Balance by Country (2024)
- 5.2 Export Analysis – Segment
- 5.2.1 Category 1 (Applicable Classification Code)
- 5.2.2 Category 2 (Applicable Classification Code)
- 5.2.3 Category 3 (Applicable Classification Code)
- 5.2.4 Category 4 (Applicable Classification Code)
- 5.2.5 Category 5 (Applicable Classification Code)
- 5.3 Import Analysis – Segment
- 5.3.1 Category 1 (Applicable Classification Code)
- 5.3.2 Category 2 (Applicable Classification Code)
- 5.3.3 Category 3 (Applicable Classification Code)
- 5.3.4 Category 4 (Applicable Classification Code)
- 5.3.5 Category 5 (Applicable Classification Code)
- 5.4 Cross-Border Pricing & Transaction Benchmarks
- 5.4.1 Export Pricing – Segment & Country
- 5.4.2 Import Pricing – Segment & Source Country
- 5.4.3 Price Trends (2024)
- 5.5 Key Cross-Border Trade & Delivery Routes
- 5.5.1 Cross-Border Trade/Delivery Route 1
- 5.5.2 Cross-Border Trade/Delivery Route 2
- 5.5.3 Cross-Border Trade/Delivery Route 3
- 5.5.4 Cross-Border Trade/Delivery Route 4
- 5.5.5 Cross-Border Trade/Delivery Route 5
- 5.6 Trade Policy & Market Access Impact Assessment
- 5.6.1 Tariff & Non-Tariff Barriers
- 5.6.2 Regional Trade & Economic Integration Frameworks
- 5.6.3 Bilateral & Multilateral Trade Agreements
- 5.6.4 Cross-Border Operating, Licensing & Localization Requirements
Note: This chapter applies where cross-border trade or delivery is relevant to Gas Turbine Oil. Goods, services, and digital offerings are assessed using applicable classifications and transaction measures. Import-export volumes, trade balances, and route analyses are included only where meaningful to the market.
Chapter 6. Competitive Landscape & Company Benchmarking
- 6.1 Gas Turbine Oil Market Concentration & Structure
- 6.1.1 Herfindahl-Hirschman Index (HHI) – vs. 2024
- 6.1.2 Leading, Mid-Sized & Emerging Player Structure
- 6.1.3 Global, Regional & Local Player Dynamics
- 6.2 Gas Turbine Oil Market Share Analysis – 2024
- 6.2.1 Global Revenue Share by Company
- 6.2.2 Global Volume Share by Company (Volume Where Applicable)
- 6.2.3 Regional Revenue Share
- 6.2.4 Market Share Evolution ( vs. 2024)
- 6.2.5 Company Market Share by Key Segment
- 6.2.6 Company Market Share by Customer Group
- 6.3 Operating Scale, Capacity & Infrastructure Analysis
- 6.3.1 Global Operating Scale & Supply Capacity
- 6.3.2 Resource Utilization & Operating Efficiency
- 6.3.3 Output, Service Delivery & Activity Metrics
- 6.3.4 Operating Footprint & Infrastructure Map
- 6.3.5 Planned Operational & Capacity Expansion
- 6.4 Gas Turbine Oil Competitive Benchmarking Matrix
- 6.4.1 Revenue, Growth, Profitability & Operating Metric Comparison
- 6.4.2 Channel Revenue Mix
- 6.4.3 Geographic Revenue Exposure
- 6.4.4 R&D Intensity
- 6.4.5 Sustainability Maturity
- 6.5 Strategic Developments in Gas Turbine Oil (Last 24 Months)
- 6.5.1 Mergers, Acquisitions & Divestments
- 6.5.2 New Products, Services & Solutions in Gas Turbine Oil
- 6.5.3 Operational & Infrastructure Expansions
- 6.5.4 Strategic Alliances, Joint Ventures & Partnerships
- 6.5.5 Distribution Expansion & Market Entry
- 6.5.6 Sustainability & ESG Initiatives
- 6.6 Competitive Strategy Mapping
- 6.6.1 Leader, Challenger, Follower & Niche Classification
- 6.6.2 Pricing Strategy Comparison
- 6.6.3 Channel Strategy Matrix
Note: Strategic developments are included based on their materiality and the availability of reliable information.
Chapter 7. Global Gas Turbine Oil Market – By Sales & Delivery Channel
- 7.1 Segment Overview
- 7.1.1 Volume & Revenue Split by Channel (2024 & 2032) (Volume Where Applicable)
- 7.1.2 Channel Mix Evolution (2024-2032)
Chapter 8. Regional Market Analysis – Global Overview
- 8.1 Global Regional Overview
- 8.1.1 Regional Volume Share (Volume Where Applicable)
- 8.1.2 Regional Revenue Share
- 8.1.3 Regional Volume by Region (Volume Where Applicable)
- 8.1.4 Regional Revenue by Region
- 8.1.5 Regional Forecast Through 2032
- 8.2 Cross-Regional Segment Analysis
- 8.2.1 By Sales & Delivery Channel
- 8.2.2 By Competitive Positioning & Price Tier
Chapter 9. North America Gas Turbine Oil Market
- 9.1 United States
- 9.2 Canada
- 9.3 Mexico
Chapter 10. Europe Gas Turbine Oil Market
- 10.1 Germany
- 10.2 France
- 10.3 Italy
- 10.4 United Kingdom
- 10.5 Spain
- 10.6 Poland
- 10.7 Russia
- 10.8 Netherlands
- 10.9 Belgium
- 10.10 Sweden
- 10.11 Denmark
- 10.12 Norway
- 10.13 Rest of Europe
Chapter 11. Asia Pacific Gas Turbine Oil Market
- 11.1 China
- 11.2 India
- 11.3 Japan
- 11.4 South Korea
- 11.5 Thailand
- 11.6 Indonesia
- 11.7 Vietnam
- 11.8 Malaysia
- 11.9 Australia
- 11.10 Rest of Asia Pacific
Chapter 12. Latin America Gas Turbine Oil Market
- 12.1 Brazil
- 12.2 Argentina
- 12.3 Colombia
- 12.4 Chile
- 12.5 Rest of Latin America
Chapter 13. Middle East Gas Turbine Oil Market
- 13.1 Saudi Arabia
- 13.2 United Arab Emirates
- 13.3 Turkey
- 13.4 Israel
- 13.5 Iran
- 13.6 Rest of the Middle East
Chapter 14. Africa Gas Turbine Oil Market
- 14.1 South Africa
- 14.2 Egypt
- 14.3 Nigeria
- 14.4 Morocco
- 14.5 Rest of Africa
Chapter 15. Gas Turbine Oil Company Profiles
- 15.1 [Company 01]
- 15.1.1 Company Overview
- 15.1.2 Key Management Personnel
- 15.1.3 Products & Services Portfolio
- 15.1.4 Financial Performance
- 15.1.5 Key Market Focus & Geographic Presence
- 15.1.6 Recent Developments & Strategic Initiatives
Note: The company profile list is preliminary and may change based on research findings, market developments, data availability, and client requirements.
Chapter 16. Appendices
- Appendix A – List of Abbreviations & Acronyms
- Appendix B – Industry Classification Code Reference – Full Series
- Appendix C – Supply, Output & Operating Capacity Data Tables
- Appendix D – End-Use & Demand Base Tables
- Appendix E – Demand, Adoption & Usage Assumptions
- Appendix F – Pricing & Revenue Metric Reference Tables
- Appendix G – Company Operations & Infrastructure Database
- Appendix H – Cross-Border Trade & Activity Data Tables (Where Applicable)
- Appendix I – Regulatory Summary Tables
- Appendix J – Primary Research Participant List (Anonymized)
- Appendix K – Primary Research Questionnaire Framework
- Appendix L – Data Sources & Bibliography
- Appendix M – Market Size Divergence & Source Comparison
Chapter 17. Research Methodology
- 17.1 Research Framework & Philosophy
- 17.2 Secondary Research – Sources, Hierarchy & Data Extraction
- 17.3 Data Modeling – Bottom-Up & Top-Down Market Sizing
- 17.4 Primary Research – Stakeholder Framework, LOI & Sample Sizes
- 17.5 Forecast Methodology – Regression, Scenario & Sensitivity Analysis
- 17.6 Quality Control – Four-Layer Validation Framework
- 17.7 Limitations & Standard Assumptions
- 17.8 Disclaimer
