
Market Overview:
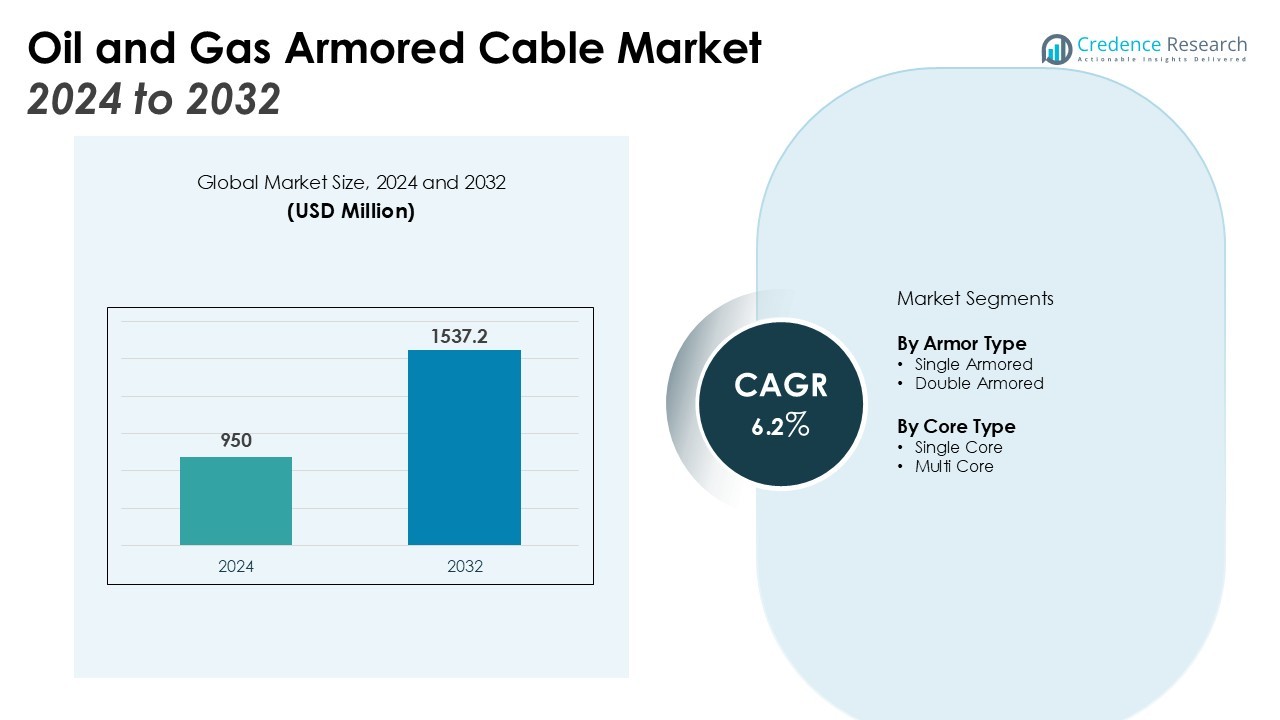
The Oil and Gas Armored Cable Market size was valued at USD 950 million in 2024 and is anticipated to reach USD 1537.2 million by 2032, at a CAGR of 6.2% during the forecast period (2024-2032).
| REPORT ATTRIBUTE | DETAILS |
|---|---|
| Historical Period | 2020-2023 |
| Base Year | 2024 |
| Forecast Period | 2025-2032 |
| Oil and Gas Armored Cable Market Size 2024 | USD 950 Million |
| Oil and Gas Armored Cable Market, CAGR | 6.2% |
| Oil and Gas Armored Cable Market Size 2032 | USD 1537.2 Million |
Key drivers include the expansion of offshore drilling operations and stringent safety regulations that require durable power and communication systems in hazardous environments. Advancements in cable design, such as corrosion-resistant armoring, enhanced thermal capacity, and improved insulation materials, are also boosting adoption. These innovations extend cable lifespan, reduce downtime, and improve performance, aligning with the industry’s focus on efficiency and sustainability.
Regionally, North America dominates due to significant shale and offshore production combined with strong regulatory compliance standards. Asia-Pacific is expected to record the fastest growth, driven by industrialization, urbanization, and growing energy consumption in China, India, Japan, and South Korea. Europe continues to be a key contributor, supported by strict safety norms and investments in energy modernization and offshore exploration. The Middle East also holds substantial potential, supported by vast oil reserves and increasing offshore development projects.
Market Insights:
- The Oil and Gas Armored Cable Market was valued at USD 950 million and is projected to reach USD 1537.2 million by 2032, reflecting a CAGR of 6.2%.
- Offshore exploration and deepwater drilling projects remain a major growth driver, demanding armored cables capable of withstanding extreme subsea conditions.
- Stringent safety regulations continue to fuel adoption of armored cables, as they reduce risks of fire, explosion, and operational failures in hazardous environments.
- Advancements in materials, including corrosion-resistant armoring and improved insulation, enhance cable durability, thermal performance, and energy efficiency.
- North America holds 36% share, supported by shale production, offshore projects, and strong regulatory standards.
- Asia-Pacific accounts for 28% share and emerges as the fastest-growing region, led by rising energy consumption, industrialization, and infrastructure expansion.
- Europe captures 22% share, while the Middle East shows strong potential with vast reserves and offshore development, reinforcing long-term growth opportunities.
Market Drivers:
Expansion of Offshore Exploration and Drilling Activities
The Oil and Gas Armored Cable Market benefits from steady growth in offshore exploration and drilling. Energy companies invest heavily in deepwater and ultra-deepwater projects, demanding robust cabling solutions that withstand extreme pressures and corrosive conditions. Armored cables ensure uninterrupted power and data transmission across rigs and subsea facilities. Their durability and safety compliance make them vital for sustaining operations in complex offshore environments.
- For instance, Chevron's Anchor project in the U.S. Gulf of Mexico employs industry-leading subsea high-pressure technology rated to safely operate at 20,000 psi at reservoir depths reaching 34,000 feet below sea level, marking a breakthrough in deepwater drilling technology.
Rising Emphasis on Safety and Regulatory Compliance
Stringent regulations across oil and gas operations drive the adoption of armored cables. Authorities enforce high safety standards to reduce risks of fire, explosion, or equipment failure. The Oil and Gas Armored Cable Market responds with cables designed to resist mechanical stress, chemical exposure, and temperature extremes. These features protect infrastructure, ensure regulatory compliance, and reduce costly downtime across production facilities.
Advancements in Cable Design and Materials
Ongoing advancements in design enhance the performance of armored cables in the Oil and Gas Armored Cable Market. Innovations include corrosion-resistant materials, improved insulation, and enhanced thermal resistance. These upgrades extend service life, minimize energy losses, and lower maintenance requirements. It supports efficiency goals and ensures reliable performance across both offshore and onshore energy networks.
- For instance, Nexans developed a micro-extrusion process to achieve insulation thickness as low as 15 microns in their medical-grade cables, allowing for compact cable designs without compromising safety and reliability.
Increasing Investments in Infrastructure and Modernization
Growing investments in oil and gas infrastructure modernization stimulate cable demand. Expansions in refining, pipeline construction, and storage facilities require advanced armored cabling solutions. The Oil and Gas Armored Cable Market grows stronger as operators replace outdated systems with modern, resilient alternatives. It strengthens safety, supports higher energy output, and ensures infrastructure reliability in line with global energy security goals.
Market Trends:
Growing Integration of Advanced Materials and Smart Technologies
The Oil and Gas Armored Cable Market is experiencing a shift toward advanced materials and smart features. Manufacturers introduce cables with superior corrosion resistance, higher thermal tolerance, and lightweight yet durable armoring to enhance operational efficiency. Smart technologies, including embedded sensors, allow real-time monitoring of cable health and performance across harsh environments. It reduces unplanned downtime and extends the service life of critical infrastructure. The demand for intelligent cables grows stronger with increasing focus on predictive maintenance. This trend supports safer and more efficient energy operations across both offshore and onshore projects.
- For instance, Prysmian Group’s CCW® Continuously Corrugated Welded armored cables are designed to operate reliably at temperatures up to 90°C, providing robust protection against moisture, gas, and liquids in harsh offshore environments.
Rising Demand Driven by Global Energy Expansion and Infrastructure Modernization
The Oil and Gas Armored Cable Market reflects strong demand linked to global energy expansion and modernization. Large-scale investments in offshore drilling, pipeline networks, and refining capacity require reliable armored cabling systems. It supports high-capacity power transmission, communication, and safety requirements in hazardous areas. Growing emphasis on sustainable and energy-efficient solutions further increases interest in modern cable technologies. Regional growth in Asia-Pacific, supported by industrialization and higher energy consumption, reinforces this trend. Europe and North America continue to advance adoption through stricter safety regulations and robust modernization efforts.
- For instance, Nexans supplied a 43-kilometer long armored piggyback cable system for the Lianzi subsea pipeline project, designed to operate under deepwater conditions effectively.
Market Challenges Analysis:
High Installation Costs and Complex Operational Requirements
The Oil and Gas Armored Cable Market faces challenges from high installation costs and complex deployment requirements. Armored cables require specialized equipment and skilled labor to ensure proper installation in offshore and hazardous environments. It increases project expenses and delays timelines for energy companies operating under tight budgets. Harsh conditions such as deepwater pressure, chemical exposure, and extreme temperatures further complicate operations. These factors make initial adoption difficult for smaller operators with limited resources. The cost factor continues to act as a restraint on widespread adoption despite the cables’ long-term benefits.
Supply Chain Disruptions and Raw Material Volatility
The Oil and Gas Armored Cable Market also struggles with supply chain disruptions and raw material price volatility. Fluctuations in steel, aluminum, and specialty insulation materials directly impact cable production costs. It creates uncertainty for manufacturers and energy operators when planning long-term investments. Global geopolitical tensions and trade restrictions further disrupt sourcing strategies, causing delays in delivery and higher procurement risks. Dependence on consistent supply of quality materials adds another layer of vulnerability. These uncertainties reduce profitability and pose challenges to maintaining steady growth in the industry.
Market Opportunities:
Expansion of Offshore Projects and Renewable Energy Integration
The Oil and Gas Armored Cable Market presents strong opportunities with the global expansion of offshore oil, gas, and renewable projects. Rising investments in deepwater exploration and subsea infrastructure demand highly durable cabling systems capable of withstanding extreme environments. It creates prospects for manufacturers offering advanced corrosion-resistant and high-capacity armored cables. The transition to hybrid offshore platforms that integrate oil, gas, and renewable energy strengthens the need for reliable cabling solutions. Growing emphasis on sustainable operations further drives innovation in materials and design. This opportunity positions armored cables as essential components for the evolving offshore energy sector.
Modernization of Infrastructure and Digitalization of Energy Systems
The Oil and Gas Armored Cable Market also benefits from infrastructure modernization and digital transformation initiatives. Aging refineries, pipelines, and storage facilities require replacement with advanced armored cables to ensure operational safety and efficiency. It supports higher energy output, improved monitoring, and long-term reliability across critical assets. The adoption of digital oilfields and smart grid integration enhances demand for intelligent cable solutions equipped with real-time monitoring features. Expanding industrialization in emerging economies increases requirements for resilient cabling systems. This modernization trend offers manufacturers a long-term growth pathway supported by both regulatory standards and energy security priorities.
Market Segmentation Analysis:
By Armor Type
The Oil and Gas Armored Cable Market by armor type is segmented into single-armored and double-armored variants. Single-armored cables dominate applications where moderate mechanical protection is sufficient, such as onshore and shallow offshore projects. Double-armored cables hold strong demand in deepwater and high-risk environments, offering enhanced resistance to crushing forces, abrasion, and corrosive conditions. It provides reliable performance in subsea installations where operational safety and longevity are critical. The growing complexity of offshore exploration continues to drive demand for double-armored solutions across global markets.
- For instance, Prysmian Group successfully completed sea trial tests for ultra-deep installation of a 500 kV HVDC non-metallic armored cable at a water depth of 2,150 meters, setting an industry record for deepest power cable installation, proving the robust performance of their innovative lightweight synthetic fiber armor technology.
By Core Type
The Oil and Gas Armored Cable Market by core type includes single-core and multi-core designs. Single-core cables are widely used for power transmission in large-scale facilities due to their efficiency in handling high voltage. Multi-core cables deliver versatility by supporting both power and communication functions in compact designs. It improves installation efficiency and reduces space requirements, making them valuable in offshore rigs and refining plants. Rising demand for integrated solutions in hazardous environments supports steady growth for multi-core armored cables. Both core types remain essential, tailored to meet the diverse operational needs of oil and gas infrastructure worldwide.
- For instance, Prysmian Group’s Bostrig™ Type P single-core armored cable supports continuous operation at temperatures up to 125°C and is engineered for durability against abrasion and chemical exposure, extensively used in offshore rigs with operational lifespans exceeding 10 years.
Segmentations:
By Armor Type
- Single Armored
- Double Armored
By Core Type
- Single Core
- Multi Core
By Region
- North America
- U.S.
- Canada
- Mexico
- Europe
- Germany
- France
- U.K.
- Italy
- Spain
- Rest of Europe
- Asia Pacific
- China
- Japan
- India
- South Korea
- South-east Asia
- Rest of Asia Pacific
- Latin America
- Brazil
- Argentina
- Rest of Latin America
- Middle East & Africa
- GCC Countries
- South Africa
- Rest of the Middle East and Africa
Regional Analysis:
Strong Market Presence in North America
North America accounted for 36% share of the Oil and Gas Armored Cable Market. The United States leads regional demand with active investments in Gulf of Mexico projects and expanding pipeline infrastructure. It benefits from strict safety regulations that mandate durable and compliant cabling systems. Canada supports growth through oil sands operations and modernization of refining facilities. Strong capital spending by leading energy companies secures steady adoption of armored cables. The region remains a core market with a focus on safety, efficiency, and regulatory compliance.
Rapid Growth Across Asia-Pacific
Asia-Pacific held 28% share of the Oil and Gas Armored Cable Market. China and India invest heavily in exploration, refining, and transmission projects to meet domestic energy needs. It supports strong demand for armored cabling that can operate reliably in both offshore and onshore facilities. Japan and South Korea contribute with advanced offshore development and high regulatory standards. Regional growth is further supported by government-backed infrastructure projects and energy security goals. Asia-Pacific emerges as a leading growth engine for future market expansion.
Steady Development in Europe and the Middle East
Europe captured 22% share of the Oil and Gas Armored Cable Market. It benefits from advanced regulations that prioritize energy efficiency and reliability in hazardous environments. The North Sea continues to be a key hub for offshore armored cable demand. In the Middle East, vast oil reserves and increasing offshore projects create steady opportunities for armored cable suppliers. Investments in pipeline infrastructure and storage facilities reinforce demand for durable solutions. Together, Europe and the Middle East represent regions with strong long-term growth prospects supported by regulatory and resource-based factors.
Key Player Analysis:
- Havells
- Helukabel
- Anixter
- Finolex
- Furukawa Electric
- AT&T
- Atkore
- Belden
- KEI Industries
- Omni Cables
- LS Cable & System
- Nexans
- Polycab
- Leoni Cables
- NKT
- Okonite
Competitive Analysis:
The Oil and Gas Armored Cable Market is highly competitive with established global and regional players focusing on innovation, safety, and reliability. Leading companies emphasize product advancements such as corrosion-resistant materials, high thermal tolerance, and integrated monitoring features to strengthen their portfolios. It drives strategic collaborations, mergers, and capacity expansions to meet growing demand from offshore and onshore projects. Key players invest in research and development to enhance cable performance while aligning with strict regulatory standards. Competitive intensity remains strong as suppliers target emerging regions with tailored solutions for deepwater drilling, refining, and pipeline infrastructure. The market continues to evolve with players balancing cost efficiency and advanced technology adoption to secure long-term growth.
Recent Developments:
- In May 2025, Alcon received U.S. Food and Drug Administration (FDA) approval for Tryptyr, a new prescription eye drop designed to treat dry eye disease.
- In August 2025, Halma plc acquired Brownline, a Netherlands-based company that specializes in technology for trenchless underground drilling.
Report Coverage:
The research report offers an in-depth analysis based on Armor Type, Core Type and Region. It details leading market players, providing an overview of their business, product offerings, investments, revenue streams, and key applications. Additionally, the report includes insights into the competitive environment, SWOT analysis, current market trends, as well as the primary drivers and constraints. Furthermore, it discusses various factors that have driven market expansion in recent years. The report also explores market dynamics, regulatory scenarios, and technological advancements that are shaping the industry. It assesses the impact of external factors and global economic changes on market growth. Lastly, it provides strategic recommendations for new entrants and established companies to navigate the complexities of the market.
Future Outlook:
- The Oil and Gas Armored Cable Market will witness stronger demand from expanding offshore drilling and deepwater projects.
- It will benefit from rising investments in subsea infrastructure that require durable and high-performance cabling solutions.
- Advancements in materials, including lightweight composites and enhanced insulation, will improve cable lifespan and reliability.
- The market will grow with the adoption of smart cables equipped with sensors for real-time monitoring and predictive maintenance.
- It will gain momentum from stricter safety and regulatory standards mandating robust cable systems in hazardous environments.
- Regional growth in Asia-Pacific will remain significant, supported by industrial expansion and rising energy consumption.
- North America will continue to dominate with shale gas production, offshore projects, and strong compliance requirements.
- Europe and the Middle East will play a vital role through modernization, offshore exploration, and large-scale pipeline projects.
- It will benefit from modernization of refineries and replacement of outdated cabling systems with advanced armored designs.
- Long-term opportunities will emerge from integration with renewable hybrid offshore platforms, creating demand for versatile armored cables.

Request a Free Sample
Fill in your details and we'll send you a free sample report.
- Sample data tables & charts
- Research methodology
Need a Custom Version of This Report?
Tailor the scope, geography, or segments to your exact requirements.
- Custom geography or segment scope
- Direct access to our analyst team
Frequently Asked Questions
What is the current market size for Oil and Gas Armored Cable, and what is its projected size in 2032?
At what Compound Annual Growth Rate is the Oil and Gas Armored Cable market projected to grow between 2024 and 2032?
Which Oil and Gas Armored Cable market segment held the largest share in 2024?
What are the primary factors fueling the growth of the Oil and Gas Armored Cable market?
Who are the leading companies in the Oil and Gas Armored Cable market?
Which region commanded the largest share of the Oil and Gas Armored Cable market in 2024?
Table of Content
Chapter 1. Report Introduction
- 1.1 Report Description & Purpose
- 1.1.1 Report Title & Market Definition
- 1.1.2 Unique Selling Propositions (USP) & Key Differentiators
- 1.1.3 Value Proposition for Stakeholders
- 1.2 Research Objectives
- 1.2.1 Market Sizing Objectives (Volume & Revenue) (Volume Where Applicable)
- 1.2.2 Segmentation Objectives
- 1.2.3 Competitive Intelligence Objectives
- 1.2.4 Forecast & Scenario Objectives
- 1.3 Report Scope
- 1.3.1 Oil and Gas Armored Cable Scope – Segments & Subsegments Covered
- 1.3.2 Geographic Scope – Regions & Countries Covered
- 1.3.3 Historical Period, Base Year & Forecast Period (2024; forecast to 2032)
- 1.3.4 Inclusions & Exclusions
- 1.4 Industry Classification & Applicable Codes
- 1.5 Currency, Measurement Units & Valuation Basis
- 1.6 Target Stakeholders
- 1.7 Limitations & Assumptions
Chapter 2. Executive Summary
- 2.1 Global Oil and Gas Armored Cable Market Snapshot
- 2.1.1 Market Size – Historical (2024) & Forecast (2024-2032) (2024: USD 950 million → 2032: USD 1537.2 million)
- 2.1.2 Volume & Revenue – Global Totals (Volume Where Applicable)
- 2.1.3 Key Market Highlights – Top Five Facts
- 2.2 Oil and Gas Armored Cable Market Segmentation Snapshot
- 2.2.1 Market Split by Region – 2024 vs. 2032
- 2.3 Competitive Snapshot
- 2.3.1 Top 10 Players by Revenue Share – 2024
- 2.3.2 Top 10 Players by Volume Share – 2024 (Volume Where Applicable)
- 2.3.3 Recent Strategic Developments (18-Month Summary)
- 2.4 Key Investment Highlights & Strategic Conclusions
Chapter 3. Oil and Gas Armored Cable Market Dynamics & Industry Analysis
- 3.1 Market Overview & Context
- 3.1.1 Oil and Gas Armored Cable Market Position in the Broader Industry Value Chain
- 3.1.2 Demand Structure & Purchasing Dynamics
- 3.1.3 Market Maturity & Development Stage by Region
- 3.2 Oil and Gas Armored Cable Market Drivers
- 3.3 Oil and Gas Armored Cable Market Restraints & Challenges
- 3.4 Oil and Gas Armored Cable Market Opportunities
- 3.5 Porter's Five Forces Analysis
- 3.5.1 Threat of New Entrants
- 3.5.2 Bargaining Power of Suppliers
- 3.5.3 Bargaining Power of Buyers
- 3.5.4 Threat of Substitutes
- 3.5.5 Competitive Rivalry – Intensity Assessment
- 3.6 Oil and Gas Armored Cable Value Chain Analysis
- 3.6.1 Upstream – Key Inputs, Resources & Suppliers
- 3.6.1.1 Key Input/Resource 1
- 3.6.1.2 Key Input/Resource 2
- 3.6.1.3 Key Input/Resource 3
- 3.6.2 Midstream – Core Operations & Value Creation
- 3.6.2.1 Operating Model & Process Overview
- 3.6.2.2 Key Operating Locations & Capabilities by Company
- 3.6.3 Downstream – Market Channels & End Users
- 3.6.3.1 Direct Sales & Customer Engagement Channels
- 3.6.3.2 Indirect Sales, Intermediaries & Partner Channels
- 3.6.4 Value Chain Profitability Analysis
- 3.6.1 Upstream – Key Inputs, Resources & Suppliers
- 3.7 PESTEL Analysis
- 3.7.1 Political Factors
- 3.7.2 Economic Factors
- 3.7.3 Social Factors
- 3.7.4 Technological Factors
- 3.7.5 Environmental Factors
- 3.7.6 Legal Factors
- 3.8 Oil and Gas Armored Cable Supply Chain Analysis
- 3.8.1 Critical Input & Resource Availability Risk Assessment
- 3.8.2 Supplier & Operational Concentration Risk (Geographic Exposure)
- 3.8.3 Supply & Service Disruption Impact Analysis
- 3.9 Regulatory & Policy Landscape
Note: The regulatory and policy landscape section covers regulations based on their applicability to the market, Oil and Gas Armored Cable category, geography, and scope of the study. Only regulatory frameworks with a material impact on operations, compliance, trade, sustainability, or market access are analyzed in detail.
Chapter 4. Key Investment Pockets & Opportunity Analysis
- 4.1 Oil and Gas Armored Cable Market Attractiveness Analysis
- 4.1.1 By Region – Investment Attractiveness Matrix (Market Size × CAGR)
- 4.2 Absolute Revenue Growth Opportunity
- 4.2.1 By Region – Absolute Revenue Growth Through 2032
- 4.3 Incremental Demand Opportunity
- 4.3.1 By Region – Incremental Demand Through 2032
- 4.3.2 Segment – Incremental Demand
- 4.4 Emerging Submarket Opportunity Deep Dive (Subject to Applicability)
- 4.5 Priority Market Opportunity Scorecards
- 4.5.1 United States
- 4.5.2 Europe
- 4.5.3 Asia
- 4.5.4 Middle East & Africa
Note: Priority market opportunity scorecards reflect the geographic scope and strategic relevance of the study. Listed markets are indicative and may be adapted to the industry.
Chapter 5. Oil and Gas Armored Cable Cross-Border Trade & Market Access Analysis
- 5.1 International Trade & Cross-Border Activity Overview
- 5.1.1 Global Export Value by Country (2024)
- 5.1.2 Global Export Volume by Country (2024) (Volume Where Applicable)
- 5.1.3 Global Import Value by Country (2024)
- 5.1.4 Global Import Volume by Country (2024) (Volume Where Applicable)
- 5.1.5 Net Trade Balance by Country (2024)
- 5.2 Export Analysis – Segment
- 5.2.1 Category 1 (Applicable Classification Code)
- 5.2.2 Category 2 (Applicable Classification Code)
- 5.2.3 Category 3 (Applicable Classification Code)
- 5.2.4 Category 4 (Applicable Classification Code)
- 5.2.5 Category 5 (Applicable Classification Code)
- 5.3 Import Analysis – Segment
- 5.3.1 Category 1 (Applicable Classification Code)
- 5.3.2 Category 2 (Applicable Classification Code)
- 5.3.3 Category 3 (Applicable Classification Code)
- 5.3.4 Category 4 (Applicable Classification Code)
- 5.3.5 Category 5 (Applicable Classification Code)
- 5.4 Cross-Border Pricing & Transaction Benchmarks
- 5.4.1 Export Pricing – Segment & Country
- 5.4.2 Import Pricing – Segment & Source Country
- 5.4.3 Price Trends (2024)
- 5.5 Key Cross-Border Trade & Delivery Routes
- 5.5.1 Cross-Border Trade/Delivery Route 1
- 5.5.2 Cross-Border Trade/Delivery Route 2
- 5.5.3 Cross-Border Trade/Delivery Route 3
- 5.5.4 Cross-Border Trade/Delivery Route 4
- 5.5.5 Cross-Border Trade/Delivery Route 5
- 5.6 Trade Policy & Market Access Impact Assessment
- 5.6.1 Tariff & Non-Tariff Barriers
- 5.6.2 Regional Trade & Economic Integration Frameworks
- 5.6.3 Bilateral & Multilateral Trade Agreements
- 5.6.4 Cross-Border Operating, Licensing & Localization Requirements
Note: This chapter applies where cross-border trade or delivery is relevant to Oil and Gas Armored Cable. Goods, services, and digital offerings are assessed using applicable classifications and transaction measures. Import-export volumes, trade balances, and route analyses are included only where meaningful to the market.
Chapter 6. Competitive Landscape & Company Benchmarking
- 6.1 Oil and Gas Armored Cable Market Concentration & Structure
- 6.1.1 Herfindahl-Hirschman Index (HHI) – the historical period vs. 2024
- 6.1.2 Leading, Mid-Sized & Emerging Player Structure
- 6.1.3 Global, Regional & Local Player Dynamics
- 6.2 Oil and Gas Armored Cable Market Share Analysis – 2024
- 6.2.1 Global Revenue Share by Company
- 6.2.2 Global Volume Share by Company (Volume Where Applicable)
- 6.2.3 Regional Revenue Share
- 6.2.4 Market Share Evolution (the historical period vs. 2024)
- 6.2.5 Company Market Share by Key Segment
- 6.2.6 Company Market Share by Customer Group
- 6.3 Operating Scale, Capacity & Infrastructure Analysis
- 6.3.1 Global Operating Scale & Supply Capacity
- 6.3.2 Resource Utilization & Operating Efficiency
- 6.3.3 Output, Service Delivery & Activity Metrics
- 6.3.4 Operating Footprint & Infrastructure Map
- 6.3.5 Planned Operational & Capacity Expansion
- 6.4 Oil and Gas Armored Cable Competitive Benchmarking Matrix
- 6.4.1 Revenue, Growth, Profitability & Operating Metric Comparison
- 6.4.2 Channel Revenue Mix
- 6.4.3 Geographic Revenue Exposure
- 6.4.4 R&D Intensity
- 6.4.5 Sustainability Maturity
- 6.5 Strategic Developments in Oil and Gas Armored Cable (Last 24 Months)
- 6.5.1 Mergers, Acquisitions & Divestments
- 6.5.2 New Products, Services & Solutions in Oil and Gas Armored Cable
- 6.5.3 Operational & Infrastructure Expansions
- 6.5.4 Strategic Alliances, Joint Ventures & Partnerships
- 6.5.5 Distribution Expansion & Market Entry
- 6.5.6 Sustainability & ESG Initiatives
- 6.6 Competitive Strategy Mapping
- 6.6.1 Leader, Challenger, Follower & Niche Classification
- 6.6.2 Pricing Strategy Comparison
- 6.6.3 Channel Strategy Matrix
Note: Strategic developments are included based on their materiality and the availability of reliable information.
Chapter 7. Global Oil and Gas Armored Cable Market – By Sales & Delivery Channel
- 7.1 Segment Overview
- 7.1.1 Volume & Revenue Split by Channel (2024 & 2032) (Volume Where Applicable)
- 7.1.2 Channel Mix Evolution (2024-2032)
Chapter 8. Regional Market Analysis – Global Overview
- 8.1 Global Regional Overview
- 8.1.1 Regional Volume Share (Volume Where Applicable)
- 8.1.2 Regional Revenue Share
- 8.1.3 Regional Volume by Region (Volume Where Applicable)
- 8.1.4 Regional Revenue by Region
- 8.1.5 Regional Forecast Through 2032
- 8.2 Cross-Regional Segment Analysis
- 8.2.1 By Sales & Delivery Channel
- 8.2.2 By Competitive Positioning & Price Tier
Chapter 9. North America Oil and Gas Armored Cable Market
- 9.1 United States
- 9.2 Canada
- 9.3 Mexico
Chapter 10. Europe Oil and Gas Armored Cable Market
- 10.1 Germany
- 10.2 France
- 10.3 Italy
- 10.4 United Kingdom
- 10.5 Spain
- 10.6 Poland
- 10.7 Russia
- 10.8 Netherlands
- 10.9 Belgium
- 10.10 Sweden
- 10.11 Denmark
- 10.12 Norway
- 10.13 Rest of Europe
Chapter 11. Asia Pacific Oil and Gas Armored Cable Market
- 11.1 China
- 11.2 India
- 11.3 Japan
- 11.4 South Korea
- 11.5 Thailand
- 11.6 Indonesia
- 11.7 Vietnam
- 11.8 Malaysia
- 11.9 Australia
- 11.10 Rest of Asia Pacific
Chapter 12. Latin America Oil and Gas Armored Cable Market
- 12.1 Brazil
- 12.2 Argentina
- 12.3 Colombia
- 12.4 Chile
- 12.5 Rest of Latin America
Chapter 13. Middle East Oil and Gas Armored Cable Market
- 13.1 Saudi Arabia
- 13.2 United Arab Emirates
- 13.3 Turkey
- 13.4 Israel
- 13.5 Iran
- 13.6 Rest of the Middle East
Chapter 14. Africa Oil and Gas Armored Cable Market
- 14.1 South Africa
- 14.2 Egypt
- 14.3 Nigeria
- 14.4 Morocco
- 14.5 Rest of Africa
Chapter 15. Oil and Gas Armored Cable Company Profiles
- 15.1 [Company 01]
- 15.1.1 Company Overview
- 15.1.2 Key Management Personnel
- 15.1.3 Products & Services Portfolio
- 15.1.4 Financial Performance
- 15.1.5 Key Market Focus & Geographic Presence
- 15.1.6 Recent Developments & Strategic Initiatives
Note: The company profile list is preliminary and may change based on research findings, market developments, data availability, and client requirements.
Chapter 16. Appendices
- Appendix A – List of Abbreviations & Acronyms
- Appendix B – Industry Classification Code Reference – Full Series
- Appendix C – Supply, Output & Operating Capacity Data Tables
- Appendix D – End-Use & Demand Base Tables
- Appendix E – Demand, Adoption & Usage Assumptions
- Appendix F – Pricing & Revenue Metric Reference Tables
- Appendix G – Company Operations & Infrastructure Database
- Appendix H – Cross-Border Trade & Activity Data Tables (Where Applicable)
- Appendix I – Regulatory Summary Tables
- Appendix J – Primary Research Participant List (Anonymized)
- Appendix K – Primary Research Questionnaire Framework
- Appendix L – Data Sources & Bibliography
- Appendix M – Market Size Divergence & Source Comparison
Chapter 17. Research Methodology
- 17.1 Research Framework & Philosophy
- 17.2 Secondary Research – Sources, Hierarchy & Data Extraction
- 17.3 Data Modeling – Bottom-Up & Top-Down Market Sizing
- 17.4 Primary Research – Stakeholder Framework, LOI & Sample Sizes
- 17.5 Forecast Methodology – Regression, Scenario & Sensitivity Analysis
- 17.6 Quality Control – Four-Layer Validation Framework
- 17.7 Limitations & Standard Assumptions
- 17.8 Disclaimer
