Market Overview
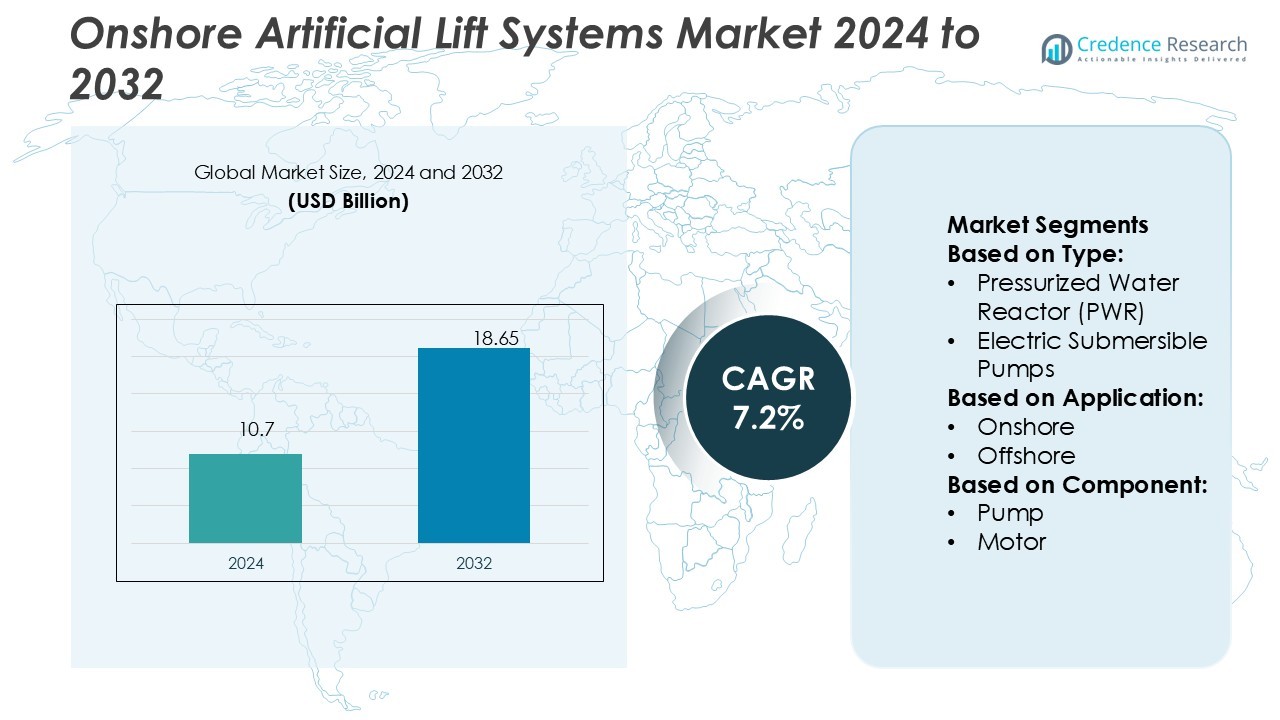
Onshore Artificial Lift Systems Market size was valued USD 10.7 billion in 2024 and is anticipated to reach USD 18.65 billion by 2032, at a CAGR of 7.2% during the forecast period.
| REPORT ATTRIBUTE | DETAILS |
|---|---|
| Historical Period | 2020-2023 |
| Base Year | 2024 |
| Forecast Period | 2025-2032 |
| Onshore Artificial Lift Systems Market Size 2024 | USD 10.7 Billion |
| Onshore Artificial Lift Systems Market, CAGR | 7.2% |
| Onshore Artificial Lift Systems Market Size 2032 | USD 18.65 Billion |
The onshore artificial lift systems market is shaped by leading players such as Canadian Advanced ESP, Halliburton, ELKAM ArtEfficial Lift, JJ Tech, Aker Solutions, Levare, NOV, Alkhorayef Petroleum, General Electric, and BCP Group. These companies compete through advanced pumping technologies, digital integration, and regional service expansions to support efficient oil recovery from mature and unconventional wells. North America leads the global market with a 37% share in 2024, driven by extensive shale production and widespread deployment of electric submersible pumps and progressing cavity pumps. The region’s strong investment in unconventional oilfields and continuous technology adoption reinforces its dominant position in the market.
Market Insights
- The Onshore Artificial Lift Systems Market was valued at USD 10.7 billion in 2024 and is projected to reach USD 18.65 billion by 2032, growing at a CAGR of 7.2% during the forecast period.
- Market growth is driven by rising demand from mature oilfields, expansion of shale production, and increasing adoption of advanced pumping systems like electric submersible pumps and progressing cavity pumps.
- Key trends include integration of digital technologies, automation, and energy-efficient designs, enabling real-time monitoring, reduced downtime, and improved cost efficiency.
- The competitive landscape features Canadian Advanced ESP, Halliburton, ELKAM ArtEfficial Lift, JJ Tech, Aker Solutions, Levare, NOV, Alkhorayef Petroleum, General Electric, and BCP Group, with companies focusing on technological innovation and regional service expansion.
- North America leads with a 37% market share in 2024, supported by strong shale oil production, while pumps account for 42% of the component segment, reinforcing their role as the dominant category.
Market Segmentation Analysis:
By Type
Electric Submersible Pumps (ESPs) dominate the onshore artificial lift systems market, holding a 38% share in 2024. Their strong position is supported by high efficiency in lifting large volumes of fluids from deeper wells. ESPs are widely used in mature oilfields where declining reservoir pressure requires reliable lifting solutions. Gas lift systems follow closely, favored in fields with high gas availability and flexibility for variable production rates. Progressing cavity pumps and jet pumps serve niche applications such as heavy oil recovery, while hydraulic pumping systems and plunger lifts remain in specialized use.
- For instance, Canadian Advanced ESP offers high-capacity ESP systems for demanding oil and gas environments. The company's brochures mention high-volume pumping with ESP systems capable of producing capacities up to 100,000 bfpd and motors up to 1,500 HP, with even higher horsepower available in specific applications like geothermal.
By Application
Onshore applications account for 66% of the market share, making them the leading segment. Growth is fueled by the abundance of mature onshore fields requiring artificial lift solutions to sustain production. Lower development costs and faster project cycles compared to offshore exploration drive higher adoption. Offshore applications, while smaller in share, continue to grow due to increasing investments in deepwater and ultra-deepwater projects. Offshore adoption is particularly rising in regions with declining onshore reserves, where advanced lift systems extend field life and improve recovery rates.
- For instance, Halliburton and AIQ deployed the RoboWell AI-enabled autonomous well control in a gas lift field, cutting gas lift consumption by 30% and reducing well movements by half.
By Component
Pumps lead the component segment with a 42% market share in 2024, as they are the core element driving artificial lift performance. Their dominance is backed by continuous advancements in pump design, durability, and efficiency. Motors follow as the second-largest component, especially in ESP deployments where reliable power drives high-volume production. Cable systems and controllers represent critical supporting components, ensuring operational stability and real-time monitoring. The “Others” category, including seals and sensors, plays a growing role with digital integration, enhancing system automation and predictive maintenance capabilities.
Key Growth Drivers
Rising Demand from Mature Oilfields
Mature oilfields with declining reservoir pressure are the primary growth driver for onshore artificial lift systems. As conventional wells age, natural flow rates decrease, creating a need for efficient lifting solutions to sustain output. Electric submersible pumps and gas lift systems are increasingly deployed to maximize recovery. This trend is particularly strong in North America, the Middle East, and Russia, where a large number of mature fields require secondary production support. Demand for enhanced oil recovery further strengthens market reliance on advanced artificial lift technologies.
- For instance, JJ Tech’s Hydra-Cell T100 pump delivers 100 horsepower, while their Q155 and Q330 versions deliver 155 HP and 330 HP respectively, enabling surface drive pressures up to 5,000 psi.
Technological Advancements in Lift Systems
Continuous innovation in artificial lift technologies drives market growth by improving operational efficiency and reducing downtime. Manufacturers are integrating digital monitoring, predictive analytics, and automation into lift systems to optimize performance. Smart controllers and sensors enable real-time adjustments that lower energy consumption and extend equipment life. The development of high-capacity pumps suited for unconventional wells supports wider adoption. These advancements not only enhance oil recovery rates but also reduce maintenance costs, making artificial lift systems a more attractive investment for operators worldwide.
- For instance, Aker Solutions uses digital twins combining edge computing and advanced analytics, reducing engineering and fabrication man-hours by up to 20% via automation of routine tasks.
Expansion of Shale and Unconventional Oil Production
The growth of shale and unconventional oil production significantly boosts demand for artificial lift systems. Horizontal drilling and hydraulic fracturing techniques create wells with rapid production declines, requiring reliable lift solutions early in their life cycle. Progressing cavity pumps and ESPs are widely used in these settings to maintain output. North America, particularly the U.S., leads this trend with robust shale activities, while similar developments are emerging in Argentina and China. The ongoing push for energy security ensures steady investment in artificial lift technologies for unconventional resources.
Key Trends & Opportunities
Integration of Digital Technologies
Digitalization represents a key trend, with artificial lift systems increasingly equipped with IoT-enabled sensors, cloud connectivity, and predictive analytics. These technologies provide operators with real-time data, enabling proactive maintenance and minimizing failures. Advanced control systems optimize energy usage and improve pump performance, resulting in higher cost-efficiency. The move toward digital oilfields supports this adoption, presenting strong opportunities for service providers offering end-to-end monitoring solutions. As companies focus on reducing operational risks, digital integration creates a major opportunity for market expansion in onshore applications.
- For instance, Levare’s ProLift® software models multiphase flow and designs ESPs using actual fluid properties. The software is used to size pumps and select equipment for wells with vertical depths of up to 4,000 m, supporting optimal production and equipment selection.
Shift Toward Energy-Efficient Solutions
Energy efficiency is becoming a central priority for operators, driving adoption of systems that minimize power usage while maintaining output. ESPs with variable frequency drives and gas lift systems optimized for fluctuating production conditions illustrate this trend. Operators seek to reduce carbon emissions and operating costs, aligning with global sustainability goals. Manufacturers investing in greener technologies and energy-efficient designs position themselves competitively in the evolving market. This focus on efficiency not only enhances profitability but also creates opportunities to capture environmentally conscious investors and clients.
- For instance, NOV’s Novomet division lists variable speed drive units rated for currents of 160 A up to 800 A (0–200 Hz) and efficiencies near 0.97, helping ESP systems adapt to changing downhole conditions.
Growing Investments in Emerging Markets
Emerging markets in Asia-Pacific, Latin America, and Africa offer significant opportunities for artificial lift system providers. Increasing oilfield development and rising domestic energy demand fuel adoption of these systems. Countries such as India and Brazil are expanding exploration and production activities, requiring modern lift solutions to support output growth. Lower-cost operations and government-backed initiatives in these regions further accelerate market penetration. Global players focusing on regional partnerships and localized manufacturing gain access to untapped reserves, strengthening long-term growth prospects in these fast-developing economies.
Key Challenges
High Operational and Maintenance Costs
Artificial lift systems, particularly ESPs, involve high capital and maintenance expenses, which challenge adoption in cost-sensitive markets. Frequent servicing, replacement of components, and energy consumption contribute significantly to operating costs. Smaller operators and projects with marginal profitability often hesitate to invest in advanced systems. Market players must balance efficiency with affordability to ensure widespread adoption. Developing cost-effective technologies and offering flexible service models will be critical to addressing this challenge and sustaining long-term market growth across varied oilfield settings.
Fluctuations in Crude Oil Prices
Volatile crude oil prices remain a significant challenge for the onshore artificial lift systems market. Price declines often lead operators to cut capital expenditure, delaying or reducing investment in lift technologies. This directly impacts system sales and service contracts, creating uncertainty for manufacturers and suppliers. Conversely, price spikes can drive short-term growth but also increase input costs, pressuring margins. The cyclical nature of the oil industry forces companies to adapt with resilient business strategies, diversifying revenue streams and focusing on regions with stable production activity.
Regional Analysis
North America
North America dominates the onshore artificial lift systems market with a 37% share in 2024. The region benefits from extensive shale oil and gas production, particularly in the U.S. Permian Basin, where declining reservoir pressure demands advanced lift solutions. Electric submersible pumps and progressing cavity pumps are widely adopted due to their ability to sustain high production rates in unconventional wells. Canada also contributes significantly, driven by heavy oil fields in Alberta that rely on thermal recovery and artificial lift. Continuous technological innovation and strong investments in shale projects reinforce the region’s leadership in the global market.
Europe
Europe accounts for 18% of the market share, supported by mature onshore fields in Russia, the UK, and Eastern Europe. The region focuses heavily on enhancing recovery rates from aging reservoirs, driving demand for efficient artificial lift systems. Gas lift and hydraulic pumping technologies are widely used due to field characteristics and availability of natural gas. Russia remains the largest contributor, with vast onshore oilfields requiring secondary recovery solutions. Additionally, stringent regulations on energy efficiency and carbon reduction encourage the adoption of optimized pumping systems. Ongoing investments in Eastern Europe strengthen regional growth despite plateauing production in Western Europe.
Asia-Pacific
Asia-Pacific holds a 24% market share, emerging as one of the fastest-growing regions for artificial lift systems. Key contributors include China and India, where rising energy demand and expanding exploration activities fuel adoption. In China, mature onshore fields such as Daqing rely heavily on progressing cavity pumps, while India’s growing oilfield development accelerates demand for ESPs and gas lift systems. Southeast Asia, including Indonesia, also supports growth through increasing recovery projects. Government-backed energy security initiatives and investments in domestic oil production drive regional expansion. The push for advanced technologies further positions Asia-Pacific as a high-potential growth hub.
Latin America
Latin America represents 6% of the global market, led by major oil-producing countries such as Brazil, Mexico, and Argentina. Argentina’s Vaca Muerta shale play is a major driver, requiring extensive artificial lift deployments to support unconventional production. Brazil and Mexico rely on artificial lift systems to sustain output in maturing onshore reservoirs. Progressing cavity pumps and jet pumps are particularly favored for heavy oil applications in Venezuela and Colombia. Regional adoption is supported by government-backed energy reforms and foreign investments in upstream projects. Although smaller in market share, Latin America presents strong long-term opportunities for artificial lift providers.
Middle East & Africa
The Middle East & Africa region commands a 15% share, with significant potential due to vast onshore reserves in Saudi Arabia, Iraq, and the UAE. While many fields still flow naturally, artificial lift systems are increasingly deployed in maturing reservoirs to sustain long-term production. Gas lift systems dominate, leveraging abundant gas resources, while ESPs are gaining traction in heavy oil projects. In Africa, Nigeria and Angola lead with enhanced oil recovery initiatives requiring artificial lift solutions. Regional market growth is supported by continued oilfield investments, energy diversification strategies, and partnerships with global oilfield service providers.
Market Segmentations:
By Type:
- Pressurized Water Reactor (PWR)
- Electric Submersible Pumps
By Application:
- Onshore
- Offshore
By Component:
- Pump
- Motor
By Geography
- North America
- U.S.
- Canada
- Mexico
- Europe
- Germany
- France
- U.K.
- Italy
- Spain
- Rest of Europe
- Asia Pacific
- China
- Japan
- India
- South Korea
- South-east Asia
- Rest of Asia Pacific
- Latin America
- Brazil
- Argentina
- Rest of Latin America
- Middle East & Africa
- GCC Countries
- South Africa
- Rest of the Middle East and Africa
Competitive Landscape
The onshore artificial lift systems market players such as Canadian Advanced ESP, Halliburton, ELKAM ArtEfficial Lift, JJ Tech, Aker Solutions, Levare, NOV, Alkhorayef Petroleum, General Electric, and BCP Group. The onshore artificial lift systems market is highly competitive, driven by continuous innovation, expanding service capabilities, and increasing adoption of advanced technologies. Companies focus on enhancing product efficiency, integrating digital solutions, and developing energy-efficient systems to meet the growing demand for optimized oil recovery. Strategic initiatives such as mergers, acquisitions, and collaborations strengthen market positions and enable access to new regional opportunities. Additionally, providers invest in localized manufacturing and service networks to reduce operational costs and improve responsiveness. The competitive landscape is further shaped by the rising importance of sustainability, automation, and predictive maintenance in oilfield operations.
Key Player Analysis
- Canadian Advanced ESP
- Halliburton
- ELKAM ArtEfficial Lift
- JJ Tech
- Aker Solutions
- Levare
- NOV
- Alkhorayef Petroleum
- General Electric
- BCP Group
Recent Developments
- In July 2025, Schlumberger (SLB), a global multinational oilfield services company received regulatory clearance to close its ChampionX acquisition, creating the largest integrated production-optimization platform.
- In February 2025, Baker Hughes unveiled Hummingbird all-electric cementing units, SureCONTROL Plus interval valves, and all-electric subsea systems targeting lower emissions.
- In May 2024, ABB announced an agreement of acquisition of Siemens’ business of China. According to this agreement, ABB is planning to acquire smart home systems, peripheral home automation products, and wiring accessories, with the Siemens brand under a licensing agreement.
- In May 2024, Schneider Electric partnered with Crux to assist in buying 45X advanced manufacturing production from Silfab Solar, a North American company that develops, designs, and manufactures premium solar PV modules. The collaboration is expected to accelerate the development and expansion of solar energy manufacturing within the U.S.
Report Coverage
The research report offers an in-depth analysis based on Type, Application, Component and Geography. It details leading market players, providing an overview of their business, product offerings, investments, revenue streams, and key applications. Additionally, the report includes insights into the competitive environment, SWOT analysis, current market trends, as well as the primary drivers and constraints. Furthermore, it discusses various factors that have driven market expansion in recent years. The report also explores market dynamics, regulatory scenarios, and technological advancements that are shaping the industry. It assesses the impact of external factors and global economic changes on market growth. Lastly, it provides strategic recommendations for new entrants and established companies to navigate the complexities of the market.
Future Outlook
- The market will expand as mature onshore fields increasingly require artificial lift solutions.
- Adoption of digital technologies will improve monitoring, efficiency, and predictive maintenance in lift systems.
- Energy-efficient solutions will gain priority as operators align with global sustainability targets.
- Shale and unconventional oil development will drive strong demand for ESPs and progressing cavity pumps.
- Emerging markets in Asia-Pacific, Latin America, and Africa will create new growth opportunities.
- Strategic partnerships and collaborations will strengthen regional service capabilities and technology access.
- Advanced automation and AI integration will enhance system reliability and lower downtime.
- Demand for cost-effective systems will increase as smaller operators seek affordable solutions.
- Heavy oil and unconventional reservoirs will accelerate use of progressing cavity and jet pumps.
- Volatile crude oil prices will continue to shape investment decisions in artificial lift systems.

Request a Free Sample
Fill in your details and we'll send you a free sample report.
- Sample data tables & charts
- Research methodology
Market Dynamics
Rising Demand from Mature Oilfields
As conventional onshore oilfields age and reservoir pressure declines, operators increasingly deploy artificial lift systems to sustain and maximize production, especially in regions like North America, the Middle East, and Russia.
Expansion of Shale and Unconventional Oil Production
The rapid growth of shale and unconventional oil extraction, particularly in North America, creates a strong need for artificial lift systems to manage steep production declines and maintain output from horizontal and hydraulically fractured wells.
Technological Advancements in Lift Systems
Continuous innovation, including digital monitoring, automation, and high-capacity pump designs, enhances operational efficiency, reduces downtime, and lowers maintenance costs, making artificial lift systems more attractive for oil producers.
Integration of Digital Technologies
The adoption of IoT-enabled sensors, real-time monitoring, and predictive analytics allows operators to optimize lift performance, reduce failures, and improve cost efficiency, driving further market penetration.
Shift Toward Energy-Efficient Solutions
Operators are prioritizing energy-efficient artificial lift systems, such as ESPs with variable frequency drives and optimized gas lift systems, to reduce power consumption, lower emissions, and align with global sustainability goals.
Need a Custom Version of This Report?
Tailor the scope, geography, or segments to your exact requirements.
- Custom geography or segment scope
- Direct access to our analyst team
Frequently Asked Questions
What is the current market size for Onshore Artificial Lift Systems Market, and what is its projected size in 2032?
At what Compound Annual Growth Rate is the Onshore Artificial Lift Systems Market projected to grow between 2025 and 2032?
Which Onshore Artificial Lift Systems Market segment held the largest share in 2024?
What are the primary factors fueling the growth of the Onshore Artificial Lift Systems Market?
Who are the leading companies in the Onshore Artificial Lift Systems Market?
Which region commanded the largest share of the Onshore Artificial Lift Systems Market in 2024?
Table of Content
Chapter 1 Market Segmentation
- 1.1 Segmentation Framework
- 1.1.1 Product and Service Classification
- 1.1.2 Application and End-Use Classification
- 1.1.3 Technology and Solution Classification
- 1.1.4 Customer and Distribution Channel Classification
- 1.1.5 Geographic Segmentation
- 1.1.6 Market Segment Definitions and Boundaries
- 1.2 By Type
- 1.2.1 Electric Submersible Pumps (ESPs)
- 1.2.2 Gas Lift Systems
- 1.2.3 Progressing Cavity Pumps
- 1.2.4 Jet Pumps
- 1.2.5 Hydraulic Pumping Systems
- 1.2.6 Plunger Lift Systems
- 1.3 By Component
- 1.3.1 Pump
- 1.3.2 Motor
- 1.3.3 Cable Systems
- 1.3.4 Controllers
- 1.3.5 Others (Seals, Sensors)
- 1.4 By Application
- 1.4.1 Onshore
- 1.4.2 Offshore
Chapter 2 Introduction
- 2.1 Report Objectives and Scope
- 2.2 Product Definition and Industry Terminology
- 2.3 Market Inclusions and Exclusions
- 2.4 Research Process
- 2.4.1 Primary Research and Expert Interviews
- 2.4.2 Secondary Research and Source Review
- 2.4.3 Top-Down and Bottom-Up Estimation
- 2.4.4 Data Triangulation and Verification
- 2.5 Market Size Measurement Basis
- 2.5.1 2024: USD 10.7 billion → 2032: USD 18.65 billion
- 2.6 Historical and Forecast Reference Periods
- 2.6.1 Base Year: 2024
- 2.6.2 Forecast Period: 2024-2032
- 2.7 Research Assumptions and Limitations
Chapter 3 Executive Summary
- 3.1 Market Snapshot and Key Findings
- 3.2 Base-Year Market Size, 2024
- 3.3 Forecast Market Size, 2032
- 3.4 Revenue and Volume Growth Outlook
- 3.5 Key Demand and Supply Indicators
- 3.6 Leading Market Segments
- 3.7 Fastest-Growing Market Opportunities
- 3.8 Regional Performance Highlights
- 3.9 Technology and Industry Transformation
- 3.10 Competitive Landscape Summary
- 3.11 Analyst View and Strategic Implications
Chapter 4 Global Onshore Artificial Lift Systems Market Trends and Developments
- 4.1 Historical Industry Development
- 4.2 Recent Market Trends and Developments
- 4.3 Demand and Customer Behavior Trends
- 4.4 Technology and Product Innovation
- 4.5 Artificial Intelligence, Automation and Digitalization
- 4.6 Local Manufacturing and Supply Chain Realignment
- 4.7 Industry Partnerships, Mergers and Acquisitions
- 4.8 Sustainability and Circular Economy Developments
- 4.9 Government and Private Sector Investment Trends
- 4.10 Emerging Business Models and Commercialization
- 4.11 Industry Developments and Announcements
Chapter 5 Global Onshore Artificial Lift Systems Market Production, Supply and Demand Analysis
- 5.1 Demand Trend and Consumption Analysis
- 5.2 Demand Forecast, 2024-2032
- 5.3 Production and Output Trend
- 5.4 Production and Output Forecast, 2024-2032
- 5.5 Installed Capacity and Capacity Utilization
- 5.6 Company-Wise Production Plants and Statistics
- 5.6.1 Installed Production Capacity
- 5.6.2 Actual Production
- 5.6.3 Planned Capacity and Expansion Targets
- 5.7 Supply Chain Structure and Procurement Trends
- 5.8 Supply-Demand Gap and Bottlenecks
- 5.9 Import Dependence and Sourcing Structure
- 5.10 Contract Manufacturing and Outsourcing
- 5.11 Regional Supply and Demand Concentration
Chapter 6 Global Onshore Artificial Lift Systems Market Pricing Analysis
- 6.1 Pricing Structure and Measurement
- 6.2 Historical Pricing Trends
- 6.3 Pricing Outlook, 2024-2032
- 6.4 Average Selling Price and Unit Economics
- 6.5 Pricing by Product and Market Segment
- 6.6 Geographic Pricing Differences
- 6.7 Key Input, Energy, Labor and Logistics Costs
- 6.8 Contract Pricing and Purchasing Models
- 6.9 Pricing Sensitivity and Competitive Positioning
- 6.10 Price, Margin and Profitability Implications
Chapter 7 Global Onshore Artificial Lift Systems Market Dynamics
- 7.1 Market Growth Drivers
- 7.1.1 Demand-Side Drivers
- 7.1.2 Technology and Innovation Drivers
- 7.1.3 Infrastructure and Investment Drivers
- 7.1.4 Regulatory and Policy Drivers
- 7.2 Market Restraints
- 7.2.1 Cost and Affordability Constraints
- 7.2.2 Technology and Adoption Barriers
- 7.2.3 Supply Chain and Operational Constraints
- 7.3 Market Challenges
- 7.3.1 Competitive Pressure and Margin Erosion
- 7.3.2 Skills, Infrastructure and Implementation Gaps
- 7.4 Emerging Market Opportunities
- 7.5 Market Dynamics Impact and Time-Horizon Assessment
Chapter 8 Global Onshore Artificial Lift Systems Value Chain Analysis
- 8.1 Industry Value Chain Overview
- 8.2 Upstream Suppliers and Critical Inputs
- 8.3 Technology and Component Providers
- 8.4 Manufacturing or Service Delivery
- 8.5 Distribution, Channel Partners and Integrators
- 8.6 Downstream Applications and End Users
- 8.7 Value Addition and Profit Pools
- 8.8 Vertical Integration and Outsourcing
- 8.9 Supplier Concentration and Risk
- 8.10 Supply Chain Localization and Resilience
Chapter 9 Global Onshore Artificial Lift Systems Market Regulations and Policies
- 9.1 Relevant Laws, Standards and Compliance Frameworks
- 9.2 Product, Service, Safety and Quality Requirements
- 9.3 Government Policies, Incentives and Subsidies
- 9.4 Imports, Exports and Trade Barriers
- 9.5 Public Procurement and Local Content Requirements
- 9.6 Environmental and Sustainability Compliance
- 9.7 Upcoming Policy Changes and Market Implications
Chapter 10 Global Onshore Artificial Lift Systems Market Hotspots and Opportunities
- 10.1 Market Opportunity Mapping and Growth Hotspots
- 10.2 High-Growth Applications and Customer Groups
- 10.3 Underserved Markets and White-Space Opportunities
- 10.4 Emerging Technology and Product Opportunities
- 10.5 New Capacity and Investment Hotspots
- 10.6 Market Entry and Expansion Opportunities
- 10.7 Distribution and Partnership Opportunities
- 10.8 Near-Term and Long-Term Commercial Potential
- 10.9 Opportunity Attractiveness and Execution Risks
Chapter 11 Global Onshore Artificial Lift Systems Market Outlook, 2024-2032
- 11.1 Market Size and Analysis
- 11.1.1 Revenue (Market Measurement: 2024: USD 10.7 billion → 2032: USD 18.65 billion)
- 11.1.2 Market Volume and Quantity Sold
- 11.1.3 Historical Market Size
- 11.1.4 Base-Year Market Size, 2024
- 11.2 Market Forecast, 2024-2032
- 11.2.1 Revenue Forecast to 2032
- 11.2.2 Volume Forecast to 2032
- 11.2.3 CAGR and Year-on-Year Growth
- 11.2.4 Incremental Revenue Opportunity
- 11.3 Forecast Assumptions and Scenario Analysis
- 11.3.1 Base-Case Forecast
- 11.3.2 Optimistic and Conservative Scenarios
- 11.3.3 Technology, Pricing and Policy Sensitivities
- 11.4 Market Attractiveness and Growth Outlook
Chapter 12 Global Onshore Artificial Lift Systems Market Segmentation and Outlook
- 12.1 Segmentation Summary and Market Shares, 2024
- 12.2 Largest and Fastest-Growing Segments
- 12.3 By Type - Market Size and Forecast, 2024-2032
- 12.3.1 Segment Definition and Scope
- 12.3.2 Historical Market Size
- 12.3.3 Revenue Forecast, 2024-2032
- 12.3.4 Volume Forecast, 2024-2032
- 12.3.5 Base-Year Market Share, 2024
- 12.3.6 Segment CAGR and Growth Drivers
- 12.3.7 Subsegment Market Size and Forecast
- 12.3.7.1 Electric Submersible Pumps (ESPs)
- 12.3.7.2 Gas Lift Systems
- 12.3.7.3 Progressing Cavity Pumps
- 12.3.7.4 Jet Pumps
- 12.3.7.5 Hydraulic Pumping Systems
- 12.3.7.6 Plunger Lift Systems
- 12.3.8 Subsegment Pricing and Adoption Trends
- 12.3.9 Leading Suppliers and Competition
- 12.3.10 Regional Demand and Opportunities
- 12.4 By Component - Market Size and Forecast, 2024-2032
- 12.4.1 Segment Definition and Scope
- 12.4.2 Historical Market Size
- 12.4.3 Revenue Forecast, 2024-2032
- 12.4.4 Volume Forecast, 2024-2032
- 12.4.5 Base-Year Market Share, 2024
- 12.4.6 Segment CAGR and Growth Drivers
- 12.4.7 Subsegment Market Size and Forecast
- 12.4.7.1 Pump
- 12.4.7.2 Motor
- 12.4.7.3 Cable Systems
- 12.4.7.4 Controllers
- 12.4.7.5 Others (Seals, Sensors)
- 12.4.8 Subsegment Pricing and Adoption Trends
- 12.4.9 Leading Suppliers and Competition
- 12.4.10 Regional Demand and Opportunities
- 12.5 By Application - Market Size and Forecast, 2024-2032
- 12.5.1 Segment Definition and Scope
- 12.5.2 Historical Market Size
- 12.5.3 Revenue Forecast, 2024-2032
- 12.5.4 Volume Forecast, 2024-2032
- 12.5.5 Base-Year Market Share, 2024
- 12.5.6 Segment CAGR and Growth Drivers
- 12.5.7 Subsegment Market Size and Forecast
- 12.5.7.1 Onshore
- 12.5.7.2 Offshore
- 12.5.8 Subsegment Pricing and Adoption Trends
- 12.5.9 Leading Suppliers and Competition
- 12.5.10 Regional Demand and Opportunities
- 12.6 Segment Growth Comparison
- 12.7 Segment Attractiveness and Priority Matrix
Chapter 13 Global Onshore Artificial Lift Systems End-Use and Application Market Outlook
- 13.1 End-Use Industry and Customer Demand Structure
- 13.2 Leading Applications and Customer Groups
- 13.3 End-Use Market Size, Share and Forecast
- 13.4 Major End-Use Industry Deep Dives
- 13.4.1 Customer Requirements and Use Cases
- 13.4.2 Demand and Replacement Cycles
- 13.4.3 Technical and Regulatory Considerations
- 13.4.4 Purchasing and Procurement Models
- 13.4.5 Leading Vendors and Distribution Channels
- 13.4.6 Forecast and Commercial Opportunities
- 13.5 Emerging Applications and Cross-Segment Demand
- 13.6 End-Use Industry Investment Priorities
Chapter 14 Global Onshore Artificial Lift Systems Geographic Market Outlook, 2024-2032
- 14.1 Regional Market Size and Share, 2024
- 14.2 Regional Market Forecast, 2024-2032
- 14.3 Regional Pricing, Production and Demand Differences
- 14.4 North America
- 14.4.1 United States
- 14.4.2 Canada
- 14.4.3 Mexico
- 14.5 Europe
- 14.5.1 Germany
- 14.5.2 France
- 14.5.3 Italy
- 14.5.4 United Kingdom
- 14.5.5 Spain
- 14.5.6 Poland
- 14.5.7 Russia
- 14.5.8 Netherlands
- 14.5.9 Belgium
- 14.5.10 Sweden
- 14.5.11 Denmark
- 14.5.12 Norway
- 14.5.13 Rest of Europe
- 14.6 Asia Pacific
- 14.6.1 China
- 14.6.2 India
- 14.6.3 Japan
- 14.6.4 South Korea
- 14.6.5 Thailand
- 14.6.6 Indonesia
- 14.6.7 Vietnam
- 14.6.8 Malaysia
- 14.6.9 Australia
- 14.6.10 Rest of Asia Pacific
- 14.7 Latin America
- 14.7.1 Brazil
- 14.7.2 Argentina
- 14.7.3 Colombia
- 14.7.4 Chile
- 14.7.5 Rest of Latin America
- 14.8 Middle East
- 14.8.1 Saudi Arabia
- 14.8.2 United Arab Emirates
- 14.8.3 Turkey
- 14.8.4 Israel
- 14.8.5 Iran
- 14.8.6 Rest of the Middle East
- 14.9 Africa
- 14.9.1 South Africa
- 14.9.2 Egypt
- 14.9.3 Nigeria
- 14.9.4 Morocco
- 14.9.5 Rest of Africa
- 14.10 Regional Investment, Policy and Supply Chain Differences
- 14.11 Regional Competitive Landscape
- 14.12 Geographic Growth Hotspots
Chapter 15 Global Onshore Artificial Lift Systems Technology, Innovation and Sustainability Outlook
- 15.1 Technology Landscape and Maturity
- 15.2 Product, Process and Service Innovation
- 15.3 AI, Automation and Digital Tools in the Industry
- 15.4 Technology Adoption and Performance Benchmarking
- 15.5 Innovation Pipeline and R&D Investment
- 15.6 Patent and Intellectual Property Trends
- 15.7 Energy Efficiency and Resource Management
- 15.8 Sustainability, Recycling and Circularity
- 15.9 Technology Roadmap, 2024-2032
- 15.10 Risks of Obsolescence and Technology Substitution
Chapter 16 Global Onshore Artificial Lift Systems Market Key Strategic Imperatives
- 16.1 Growth and Market Entry Priorities
- 16.2 High-Return Products and Segments
- 16.3 Pricing, Profitability and Cost Optimization
- 16.4 Technology Investment and Product Differentiation
- 16.5 Supply Chain Localization and Resilience
- 16.6 Distribution and Customer Acquisition
- 16.7 Partnership, Acquisition and Capacity Strategy
- 16.8 Regional Expansion Priorities
- 16.9 Short-, Medium- and Long-Term Actions
Chapter 17 Competition Outlook
- 17.1 Industry Competition Characteristics
- 17.2 Market Structure and Concentration
- 17.3 Market Share and Competitive Positioning, 2024
- 17.4 Company-Wise Revenue and Product Benchmarking
- 17.5 Production and Service Capacity Benchmarking
- 17.6 Technology, Pricing and Differentiation
- 17.7 Regional Footprint and Distribution Strength
- 17.8 Mergers, Acquisitions and Strategic Alliances
- 17.9 New Entrants and Competitive Threats
- 17.10 Porter's Five Forces and Industry Attractiveness
- 17.11 Competitive Outlook, 2024-2032
Chapter 18 Company Profiles
- 18.1 Company Coverage and Selection Criteria
- 18.2 Canadian Advanced ESP
- 18.2.1 Business Description
- 18.2.2 Company Ownership and Geographic Presence
- 18.2.3 Product and Service Portfolio
- 18.2.4 Manufacturing and Operating Footprint
- 18.2.5 Production Capacity and Expansion Plans
- 18.2.6 Financial Performance and Investment
- 18.2.7 Market Share and Competitive Position
- 18.2.8 Technology and Innovation Capabilities
- 18.2.9 Strategic Alliances or Partnerships
- 18.2.10 Recent Developments
- 18.2.11 Growth Strategy and Outlook
- 18.3 Halliburton
- 18.4 ELKAM ArtEfficial Lift
- 18.5 JJ Tech
- 18.6 Aker Solutions
- 18.7 Levare
- 18.8 NOV
- 18.9 Alkhorayef Petroleum
- 18.10 General Electric
- 18.11 BCP Group
- 18.12 Other Relevant Market Participants
Note: Every listed company is profiled on the structure shown under the first company. The company list is preliminary and may change based on research findings, market developments, data availability and client requirements.
Chapter 19 Disclaimer
- 19.1 Research and Forecast Disclaimer
- 19.2 Data Source and Estimation Limitations
Note: The depth of individual sections depends on data availability for this market. Volume, capacity, trade and other unit-based metrics are included where applicable.