
Market Overview
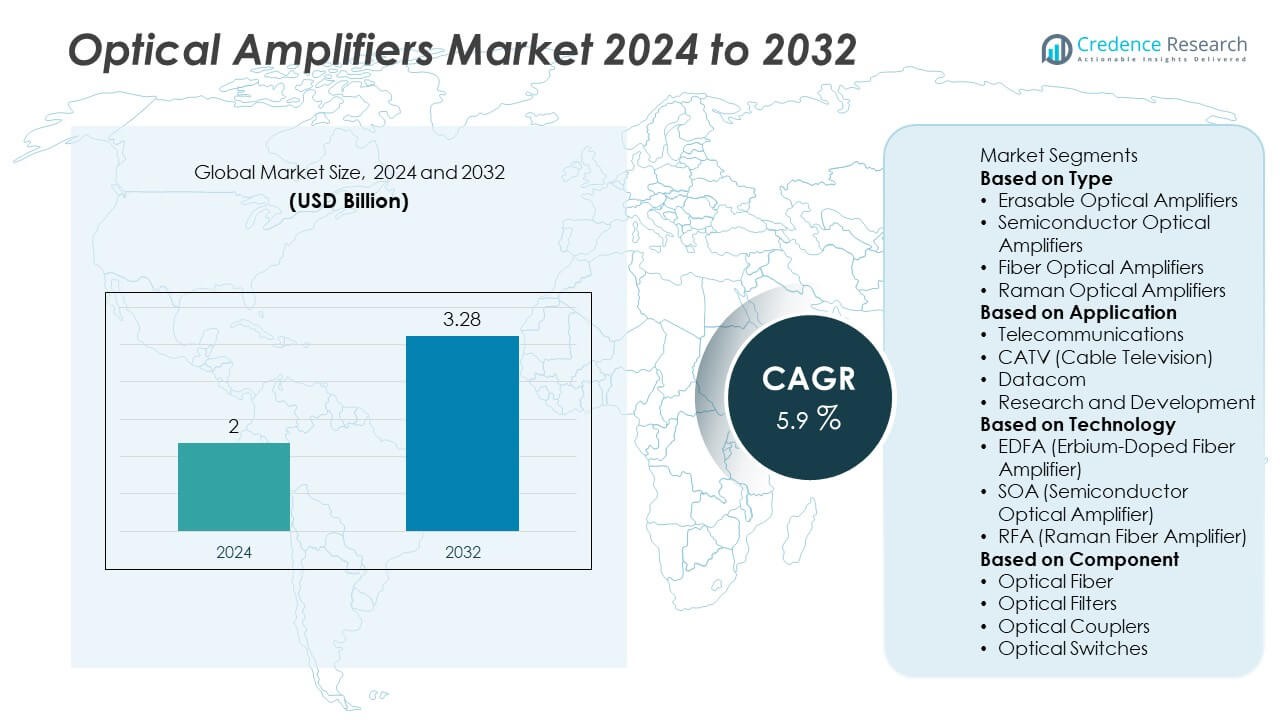
The optical amplifiers market was valued at USD 2 billion in 2024 and is expected to reach USD 3.28 billion by 2032, growing at a CAGR of 5.9% during the forecast period.
| REPORT ATTRIBUTE | DETAILS |
|---|---|
| Historical Period | 2020-2023 |
| Base Year | 2024 |
| Forecast Period | 2025-2032 |
| Optical Amplifiers Market Size 2024 | USD 2 Billion |
| Optical Amplifiers Market, CAGR | 5.9% |
| Optical Amplifiers Market Size 2032 | USD 3.28 Billion |
The optical amplifiers market is driven by top players including Cisco Systems, Nistica, Mellanox Technologies, Fujitsu, Infinera Corporation, Amdocs, ADVA Optical Networking, Huawei Technologies, Nokia Corporation, and Typeset. These companies focus on advancing EDFA, SOA, and Raman amplifier technologies to meet rising demand for high-speed data transmission and reliable network performance. North America leads the market with 34% share, supported by extensive 5G rollouts and strong data center infrastructure, while Asia-Pacific follows closely with 30% share driven by massive fiber deployments in China, India, and Japan. Europe holds 28% share, fueled by digitalization initiatives and submarine cable projects.
Market Insights
- The optical amplifiers market was valued at USD 2 billion in 2024 and is projected to reach USD 3.28 billion by 2032, growing at a CAGR of 5.9% during the forecast period.
- Growth is driven by rising demand for high-speed internet, 5G backhaul, and data center expansion, with fiber optical amplifiers leading the type segment with over 45% share in 2024.
- Key trends include adoption of energy-efficient amplifier modules, deployment of DWDM systems, and integration of compact EDFAs and Raman amplifiers for metro and long-haul networks.
- The market is competitive, with major players such as Cisco Systems, Fujitsu, Huawei Technologies, Nokia Corporation, and Infinera focusing on R&D, network partnerships, and submarine cable projects.
- North America holds 34% share, Asia-Pacific 30%, and Europe 28%, supported by large-scale broadband rollouts and digitalization initiatives, while Latin America and MEA collectively contribute the remaining 8% share.
Market Segmentation Analysis:
By Type
Fiber optical amplifiers dominated the optical amplifiers market in 2024, holding over 45% share. Their widespread adoption in long-haul and metro networks drives demand, as they provide low noise, high gain, and cost-effective signal boosting over long distances. The segment benefits from increasing deployment of high-capacity optical fiber networks and data-intensive applications. Erasable optical amplifiers and semiconductor optical amplifiers serve niche roles in metro and access networks, while Raman optical amplifiers find use in ultra-long-haul and submarine communication links where low noise figures and extended reach are critical.
- For instance, Agiltron’s Erbium-Doped Fiber Amplifier (EDFA) modules available in 2025 provide output power up to 26 dBm across the 1528-1565 nm wavelength range, and feature automatic power control modes that maintain constant output power even with varying input levels.
By Application
Telecommunications led the market with over 50% share in 2024, driven by rapid expansion of high-speed broadband and 5G backhaul networks worldwide. Growing internet penetration and demand for seamless video streaming, cloud services, and IoT connectivity fuel amplifier installations across telecom infrastructure. The CATV segment is expanding steadily with rising digital cable penetration and bandwidth upgrades. Datacom applications gain traction from hyperscale data centers and enterprise networks. Research and development remains a smaller segment, primarily supporting optical system innovations and next-generation photonic technology testing in academic and industrial labs.
- For instance, in early 2025, Huawei introduced a high-power coherent optical networking platform capable of transmitting 1.2 terabits per second over a distance of 240 kilometers, optimizing hyperscale cloud infrastructure connectivity.
By Technology
EDFA (Erbium-Doped Fiber Amplifier) technology accounted for over 55% share in 2024, making it the dominant segment due to its reliability, low noise performance, and suitability for dense wavelength division multiplexing (DWDM) systems. EDFAs are widely used in telecom and CATV systems to amplify multiple wavelengths simultaneously, enabling higher capacity transmission. SOA technology follows with use in compact integrated systems, while Raman fiber amplifiers are increasingly adopted for ultra-long-haul links requiring distributed amplification. Continuous innovation in EDFA modules, including energy-efficient designs, supports the strong position of this technology in core network deployments.
Key Growth Drivers
Rising Demand for High-Speed Internet and 5G Networks
The expansion of high-speed internet and 5G networks is a primary growth driver, contributing to over 40% of new installations in 2024. Telecom operators are rapidly upgrading their backbone infrastructure to support high-bandwidth services like video streaming, cloud computing, and IoT connectivity. Optical amplifiers ensure seamless long-distance signal transmission without regeneration, reducing operational costs. This growing need for low-latency, high-capacity data transfer drives large-scale deployment across urban and rural networks, especially in Asia-Pacific and North America, where broadband penetration and 5G rollouts are accelerating.
- For instance, NTT Corporation developed a multi-core optical amplifier in September 2023 that reduces power consumption by 67% compared to conventional devices. This enables significant efficiency gains by allowing multiple cores to share a single excitation laser, which would benefit capacity expansion in optical communication platforms, such as those supporting dense 5G networks.
Proliferation of Data Centers and Cloud Computing
The growing number of hyperscale data centers fuels optical amplifier demand, holding around 35% share of market revenue growth. Data center operators deploy optical amplifiers to maintain signal integrity across interconnects supporting massive data transfers. Rising adoption of cloud services, edge computing, and AI workloads further boosts traffic on optical networks. Amplifiers such as EDFAs enable high-capacity transmission over dense wavelength division multiplexing (DWDM) links, supporting scalability and reliability. Continuous investment by tech giants in building and upgrading data centers is expected to sustain market growth over the next decade.
- For instance, Infinera’s ICE7 optical engine supports symbol rates up to 148 GBaud and enables 800G-based transmission over 3,000 km spans, and its optical line system can provide usable spectrum up to 12 THz on a single fibre.
Increasing Deployment of WDM and Long-Haul Networks
Deployment of wavelength division multiplexing (WDM) and long-haul optical networks is driving demand, with this segment representing over 30% of total amplifier installations. WDM systems allow multiple data channels to be transmitted simultaneously, requiring optical amplifiers to boost multi-wavelength signals. The trend toward long-haul and submarine communication systems, supported by rising international bandwidth requirements, strengthens demand. Optical amplifiers reduce signal loss over transcontinental distances, improving efficiency. Investments in cross-border fiber projects and submarine cables, particularly in Europe and Asia-Pacific, continue to create opportunities for advanced amplifier technologies.
Key Trends & Opportunities
Adoption of Energy-Efficient Amplifier Designs
Manufacturers are focusing on energy-efficient amplifier modules, helping operators reduce operating costs and carbon footprints. Low-power EDFAs and Raman amplifiers with intelligent gain control optimize energy use while maintaining signal quality. This trend aligns with global sustainability goals and supports telecom companies’ efforts to meet green network targets. Energy efficiency is emerging as a differentiator in procurement decisions, opening opportunities for players offering compact, low-heat, and high-reliability solutions tailored for space-constrained data centers and remote field deployments.
- For instance, Furukawa Electric introduced its Dual Port Raman Pump Laser (DPRP) in March 2025, reducing Raman amplifier power consumption by 32-39% while maintaining high output power performance across the S-, C-, and L-bands for optical communication networks.
Integration of Optical Amplifiers in IoT and Smart Infrastructure
The rising adoption of IoT-enabled smart cities and industrial automation creates new opportunities for optical amplifier suppliers. These projects require robust, low-latency optical networks to connect sensors, devices, and edge computing nodes. Amplifiers play a key role in ensuring uninterrupted data flow across distributed networks. Governments are investing in smart grid, transportation, and surveillance infrastructure, boosting demand for compact and scalable amplification solutions. Market players offering modular designs that support future bandwidth expansion stand to gain from this trend.
- For instance, Thorlabs booster optical amplifiers, such as the BOA1084S and BOA1084P, provide a typical small-signal gain of 20 dB and saturation output powers of 17 dBm across the 1685 nm wavelength band. These devices are housed in compact 14-pin butterfly packages.
Key Challenges
High Initial Investment and Deployment Costs
The high cost of installing optical amplifiers, especially for long-haul and DWDM systems, remains a significant barrier. Capital-intensive network upgrades deter smaller operators and enterprises from adopting advanced amplification solutions. Additional expenses for skilled labor, network integration, and maintenance further raise the total cost of ownership. This cost challenge slows adoption in developing regions where budget constraints limit large-scale network modernization despite rising data demand.
Competition from Alternative Technologies
Alternative transmission technologies, such as all-optical regeneration and advanced modulation schemes, pose a challenge to amplifier adoption. These technologies can extend network reach without multiple amplification stages, reducing reliance on traditional amplifiers. Rapid innovation in silicon photonics and integrated optical systems also creates price pressure by enabling compact, cost-effective solutions. Market players must continue investing in innovation to maintain competitiveness and ensure optical amplifiers remain the preferred choice for high-capacity networks.
Regional Analysis
North America
North America led the optical amplifiers market with 34% share in 2024, driven by strong demand from telecom operators, hyperscale data centers, and early 5G rollouts. The U.S. dominates regional growth with major investments in upgrading backbone networks and expanding rural broadband coverage under federal programs. Canada is witnessing steady growth with increased adoption of fiber-to-the-home and CATV upgrades. Presence of leading players, high R&D spending, and a mature network infrastructure ecosystem support continuous deployment of EDFAs and SOAs. Growing demand for low-latency cloud connectivity and cross-border data traffic further drives regional market expansion.
Europe
Europe accounted for 28% share in 2024, supported by extensive deployment of high-capacity fiber optic networks and government-led digitalization initiatives. Countries like Germany, the U.K., and France are driving adoption through nationwide gigabit broadband projects and data center expansion. The region’s focus on energy-efficient telecom infrastructure and strict network reliability standards encourage use of advanced EDFA and Raman amplifiers. Investments in submarine cable projects connecting Europe to Africa and Asia enhance long-haul transmission requirements. Vendors in the region are also prioritizing compact amplifier solutions that meet sustainability goals, aligning with the European Green Deal targets.
Asia-Pacific
Asia-Pacific held 30% share in 2024, emerging as the fastest-growing regional market due to large-scale fiber network rollouts and rapid internet penetration. China, India, and Japan lead adoption with massive investments in 5G backhaul, data centers, and cross-border connectivity projects. Rising demand for high-speed broadband and OTT streaming services fuels amplifier installations across metro and long-haul networks. Regional vendors are expanding production capacity to meet surging demand and reduce costs. Government initiatives promoting smart city development and digital transformation further boost the use of high-performance EDFA and Raman amplifier technologies across telecom and enterprise applications.
Latin America
Latin America captured 5% share in 2024, with growth driven by expanding broadband coverage and fiber-to-the-home projects in Brazil, Mexico, and Chile. Rising demand for digital services and OTT streaming is pushing network operators to invest in optical amplifier solutions for metro and core networks. Deployment of undersea cable systems connecting the region to North America and Europe is creating additional demand for long-haul amplifiers. However, high capital costs and slower economic growth limit faster adoption. Opportunities exist for low-cost, energy-efficient amplifier solutions that can address rural connectivity challenges and support regional digital inclusion initiatives.
Middle East & Africa
The Middle East & Africa region accounted for 3% share in 2024, with demand concentrated in Gulf countries and South Africa. Investment in hyperscale data centers, smart city projects, and undersea cable infrastructure drives amplifier deployment. The UAE and Saudi Arabia are leading adopters, supporting 5G rollouts and digital economy strategies. Africa is witnessing gradual growth with expanding international bandwidth and government-backed broadband initiatives. Vendors targeting the region focus on compact, cost-effective solutions that meet long-distance transmission needs while withstanding challenging environmental conditions, making it a promising but price-sensitive market for optical amplifier suppliers.
Market Segmentations:
By Type
- Erasable Optical Amplifiers
- Semiconductor Optical Amplifiers
- Fiber Optical Amplifiers
- Raman Optical Amplifiers
By Application
- Telecommunications
- CATV (Cable Television)
- Datacom
- Research and Development
By Technology
- EDFA (Erbium-Doped Fiber Amplifier)
- SOA (Semiconductor Optical Amplifier)
- RFA (Raman Fiber Amplifier)
By Component
- Optical Fiber
- Optical Filters
- Optical Couplers
- Optical Switches
By Geography
- North America
- U.S.
- Canada
- Europe
- Germany
- France
- Italy
- U.K.
- Russia
- Rest of Europe
- Asia-Pacific
- India
- China
- Japan
- Rest of Asia-Pacific
- Latin America
- Brazil
- Mexico
- Rest of Latin America
- Middle East and Africa
- GCC Countries
- South Africa
- Rest of Middle East and Africa
Competitive Landscape
The competitive landscape of the optical amplifiers market features key players such as Cisco Systems, Nistica, Mellanox Technologies, Fujitsu, Infinera Corporation, Amdocs, ADVA Optical Networking, Huawei Technologies, Nokia Corporation, and Typeset. These companies focus on developing advanced EDFA, SOA, and Raman amplifier solutions to address the growing demand for high-speed, high-capacity optical networks. Strategic initiatives include product innovations, network upgrades, and collaborations with telecom operators and data center providers. Many players are investing in energy-efficient designs and compact form factors to support next-generation 5G, IoT, and cloud infrastructure. Partnerships for submarine cable projects, metro network expansion, and DWDM deployments are common strategies to strengthen market share. Continuous R&D investments and competitive pricing strategies are shaping the market, with Asia-Pacific and North America being primary targets for expansion due to rapid network infrastructure growth and increasing bandwidth consumption.
Key Player Analysis
- Cisco Systems
- Nistica
- Mellanox Technologies
- Fujitsu
- Infinera Corporation
- Amdocs
- ADVA Optical Networking
- Huawei Technologies
- Nokia Corporation
- Typeset
Recent Developments
- In May 2025, Nistica introduced a compact semiconductor optical amplifier (SOA) with integrated photonic circuits, achieving 18 dB gain and 3 dB noise figure.
- In April 2025, Chalmers University of Technology, A chip amplifier was demonstrated that gives 10× the data transmission capacity over existing fiber-optic systems, using ultra-broadband amplification.
- In February 2025, Nokia Corporation / Infinera Corporation, The EU approved Nokia’s acquisition of Infinera for about USD 2.3 billion.
- In October 2024, Huawei released an EDFA optical amplifier module (QSFP28-SMF) that supports 400G ZR and ZR+ modules, works over 1535-1555 nm range, with maximum transmit (average) optical power of 17.5 dBm.
Report Coverage
The research report offers an in-depth analysis based on Type, Application, Technology, Component and Geography. It details leading market players, providing an overview of their business, product offerings, investments, revenue streams, and key applications. Additionally, the report includes insights into the competitive environment, SWOT analysis, current market trends, as well as the primary drivers and constraints. Furthermore, it discusses various factors that have driven market expansion in recent years. The report also explores market dynamics, regulatory scenarios, and technological advancements that are shaping the industry. It assesses the impact of external factors and global economic changes on market growth. Lastly, it provides strategic recommendations for new entrants and established companies to navigate the complexities of the market.
Future Outlook
- Demand for optical amplifiers will grow steadily with rising global data traffic and 5G expansion.
- Fiber optical amplifiers will remain the dominant type, driven by long-haul and metro network deployments.
- EDFA technology will continue to lead due to its efficiency and compatibility with DWDM systems.
- Asia-Pacific will see the fastest growth, supported by large-scale fiber rollouts in China and India.
- Energy-efficient and compact amplifier designs will gain preference to meet sustainability goals.
- Data center interconnect applications will create new opportunities for high-performance amplifier solutions.
- Raman amplifiers will gain traction in ultra-long-haul and submarine cable systems.
- Collaboration between telecom operators and equipment vendors will intensify to expand network reach.
- Continuous R&D investment will drive innovations in low-noise, high-gain optical amplification.
- Growing smart city and IoT projects will boost amplifier demand in urban infrastructure networks.

Request a Free Sample
Fill in your details and we'll send you a free sample report.
- Sample data tables & charts
- Research methodology
Market Dynamics
Expansion of High-Speed Internet and 5G Networks
Telecom operators are rapidly upgrading backbone infrastructure to support high-bandwidth services such as video streaming, cloud computing, and IoT connectivity. Optical amplifiers are essential for seamless long-distance signal transmission, reducing the need for signal regeneration and enabling cost-effective network expansion.
Proliferation of Data Centers and Cloud Computing
The surge in hyperscale data centers and cloud service adoption is driving demand for optical amplifiers to maintain signal integrity across high-capacity interconnects. Amplifiers like EDFAs support dense wavelength division multiplexing (DWDM) links, enabling scalable and reliable data transmission for growing cloud and AI workloads.
Deployment of WDM and Long-Haul Networks
Increasing use of wavelength division multiplexing (WDM) and long-haul optical networks requires optical amplifiers to boost multi-wavelength signals over extended distances. This trend is reinforced by rising international bandwidth needs and investments in submarine and cross-border fiber projects.
Adoption of Energy-Efficient Amplifier Designs
Operators are prioritizing energy-efficient amplifier modules to reduce operating costs and carbon footprints. Innovations in low-power EDFAs and Raman amplifiers with intelligent gain control are helping telecom companies meet sustainability goals and optimize network performance.
Integration in IoT and Smart Infrastructure
The growth of IoT-enabled smart cities and industrial automation is creating new opportunities for optical amplifier suppliers. These projects demand robust, low-latency optical networks, where amplifiers ensure uninterrupted data flow across distributed and expanding urban infrastructure.
Need a Custom Version of This Report?
Tailor the scope, geography, or segments to your exact requirements.
- Custom geography or segment scope
- Direct access to our analyst team
Frequently Asked Questions
What is the current market size for Optical Amplifiers market, and what is its projected size in 2032?
At what Compound Annual Growth Rate is the Optical Amplifiers market projected to grow between 2025 and 2032?
Which Optical Amplifiers market segment held the largest share in 2024?
What are the primary factors fueling the growth of the Optical Amplifiers market?
Who are the leading companies in the Optical Amplifiers market?
Which region commanded the largest share of the Optical Amplifiers market in 2024?
Table of Content
Chapter 1 Market Segmentation
- 1.1 Segmentation Framework
- 1.1.1 Product and Service Classification
- 1.1.2 Application and End-Use Classification
- 1.1.3 Technology and Solution Classification
- 1.1.4 Customer and Distribution Channel Classification
- 1.1.5 Geographic Segmentation
- 1.1.6 Market Segment Definitions and Boundaries
- 1.2 By Type
- 1.2.1 Erasable Optical Amplifiers
- 1.2.2 Semiconductor Optical Amplifiers
- 1.2.3 Fiber Optical Amplifiers
- 1.2.4 Raman Optical Amplifiers
- 1.3 By Component
- 1.3.1 Optical Fiber
- 1.3.2 Optical Filters
- 1.3.3 Optical Couplers
- 1.3.4 Optical Switches
- 1.4 By Technology
- 1.4.1 EDFA (Erbium-Doped Fiber Amplifier)
- 1.4.2 SOA (Semiconductor Optical Amplifier)
- 1.4.3 RFA (Raman Fiber Amplifier)
- 1.5 By Application
- 1.5.1 Telecommunications
- 1.5.2 CATV (Cable Television)
- 1.5.3 Datacom
- 1.5.4 Research and Development
Chapter 2 Introduction
- 2.1 Report Objectives and Scope
- 2.2 Product Definition and Industry Terminology
- 2.3 Market Inclusions and Exclusions
- 2.4 Research Process
- 2.4.1 Primary Research and Expert Interviews
- 2.4.2 Secondary Research and Source Review
- 2.4.3 Top-Down and Bottom-Up Estimation
- 2.4.4 Data Triangulation and Verification
- 2.5 Market Size Measurement Basis
- 2.5.1 2024: USD 2 billion → 2032: USD 3.28 billion
- 2.6 Historical and Forecast Reference Periods
- 2.6.1 Base Year: 2024
- 2.6.2 Forecast Period: 2024-2032
- 2.7 Research Assumptions and Limitations
Chapter 3 Executive Summary
- 3.1 Market Snapshot and Key Findings
- 3.2 Base-Year Market Size, 2024
- 3.3 Forecast Market Size, 2032
- 3.4 Revenue and Volume Growth Outlook
- 3.5 Key Demand and Supply Indicators
- 3.6 Leading Market Segments
- 3.7 Fastest-Growing Market Opportunities
- 3.8 Regional Performance Highlights
- 3.9 Technology and Industry Transformation
- 3.10 Competitive Landscape Summary
- 3.11 Analyst View and Strategic Implications
Chapter 4 Global Optical Amplifiers Market Trends and Developments
- 4.1 Historical Industry Development
- 4.2 Recent Market Trends and Developments
- 4.3 Demand and Customer Behavior Trends
- 4.4 Technology and Product Innovation
- 4.5 Artificial Intelligence, Automation and Digitalization
- 4.6 Local Manufacturing and Supply Chain Realignment
- 4.7 Industry Partnerships, Mergers and Acquisitions
- 4.8 Sustainability and Circular Economy Developments
- 4.9 Government and Private Sector Investment Trends
- 4.10 Emerging Business Models and Commercialization
- 4.11 Industry Developments and Announcements
Chapter 5 Global Optical Amplifiers Market Production, Supply and Demand Analysis
- 5.1 Demand Trend and Consumption Analysis
- 5.2 Demand Forecast, 2024-2032
- 5.3 Production and Output Trend
- 5.4 Production and Output Forecast, 2024-2032
- 5.5 Installed Capacity and Capacity Utilization
- 5.6 Company-Wise Production Plants and Statistics
- 5.6.1 Installed Production Capacity
- 5.6.2 Actual Production
- 5.6.3 Planned Capacity and Expansion Targets
- 5.7 Supply Chain Structure and Procurement Trends
- 5.8 Supply-Demand Gap and Bottlenecks
- 5.9 Import Dependence and Sourcing Structure
- 5.10 Contract Manufacturing and Outsourcing
- 5.11 Regional Supply and Demand Concentration
Chapter 6 Global Optical Amplifiers Market Pricing Analysis
- 6.1 Pricing Structure and Measurement
- 6.2 Historical Pricing Trends
- 6.3 Pricing Outlook, 2024-2032
- 6.4 Average Selling Price and Unit Economics
- 6.5 Pricing by Product and Market Segment
- 6.6 Geographic Pricing Differences
- 6.7 Key Input, Energy, Labor and Logistics Costs
- 6.8 Contract Pricing and Purchasing Models
- 6.9 Pricing Sensitivity and Competitive Positioning
- 6.10 Price, Margin and Profitability Implications
Chapter 7 Global Optical Amplifiers Market Dynamics
- 7.1 Market Growth Drivers
- 7.1.1 Demand-Side Drivers
- 7.1.2 Technology and Innovation Drivers
- 7.1.3 Infrastructure and Investment Drivers
- 7.1.4 Regulatory and Policy Drivers
- 7.2 Market Restraints
- 7.2.1 Cost and Affordability Constraints
- 7.2.2 Technology and Adoption Barriers
- 7.2.3 Supply Chain and Operational Constraints
- 7.3 Market Challenges
- 7.3.1 Competitive Pressure and Margin Erosion
- 7.3.2 Skills, Infrastructure and Implementation Gaps
- 7.4 Emerging Market Opportunities
- 7.5 Market Dynamics Impact and Time-Horizon Assessment
Chapter 8 Global Optical Amplifiers Value Chain Analysis
- 8.1 Industry Value Chain Overview
- 8.2 Upstream Suppliers and Critical Inputs
- 8.3 Technology and Component Providers
- 8.4 Manufacturing or Service Delivery
- 8.5 Distribution, Channel Partners and Integrators
- 8.6 Downstream Applications and End Users
- 8.7 Value Addition and Profit Pools
- 8.8 Vertical Integration and Outsourcing
- 8.9 Supplier Concentration and Risk
- 8.10 Supply Chain Localization and Resilience
Chapter 9 Global Optical Amplifiers Market Regulations and Policies
- 9.1 Relevant Laws, Standards and Compliance Frameworks
- 9.2 Product, Service, Safety and Quality Requirements
- 9.3 Government Policies, Incentives and Subsidies
- 9.4 Imports, Exports and Trade Barriers
- 9.5 Public Procurement and Local Content Requirements
- 9.6 Environmental and Sustainability Compliance
- 9.7 Upcoming Policy Changes and Market Implications
Chapter 10 Global Optical Amplifiers Market Hotspots and Opportunities
- 10.1 Market Opportunity Mapping and Growth Hotspots
- 10.2 High-Growth Applications and Customer Groups
- 10.3 Underserved Markets and White-Space Opportunities
- 10.4 Emerging Technology and Product Opportunities
- 10.5 New Capacity and Investment Hotspots
- 10.6 Market Entry and Expansion Opportunities
- 10.7 Distribution and Partnership Opportunities
- 10.8 Near-Term and Long-Term Commercial Potential
- 10.9 Opportunity Attractiveness and Execution Risks
Chapter 11 Global Optical Amplifiers Market Outlook, 2024-2032
- 11.1 Market Size and Analysis
- 11.1.1 Revenue (Market Measurement: 2024: USD 2 billion → 2032: USD 3.28 billion)
- 11.1.2 Market Volume and Quantity Sold
- 11.1.3 Historical Market Size
- 11.1.4 Base-Year Market Size, 2024
- 11.2 Market Forecast, 2024-2032
- 11.2.1 Revenue Forecast to 2032
- 11.2.2 Volume Forecast to 2032
- 11.2.3 CAGR and Year-on-Year Growth
- 11.2.4 Incremental Revenue Opportunity
- 11.3 Forecast Assumptions and Scenario Analysis
- 11.3.1 Base-Case Forecast
- 11.3.2 Optimistic and Conservative Scenarios
- 11.3.3 Technology, Pricing and Policy Sensitivities
- 11.4 Market Attractiveness and Growth Outlook
Chapter 12 Global Optical Amplifiers Market Segmentation and Outlook
- 12.1 Segmentation Summary and Market Shares, 2024
- 12.2 Largest and Fastest-Growing Segments
- 12.3 By Type - Market Size and Forecast, 2024-2032
- 12.3.1 Segment Definition and Scope
- 12.3.2 Historical Market Size
- 12.3.3 Revenue Forecast, 2024-2032
- 12.3.4 Volume Forecast, 2024-2032
- 12.3.5 Base-Year Market Share, 2024
- 12.3.6 Segment CAGR and Growth Drivers
- 12.3.7 Subsegment Market Size and Forecast
- 12.3.7.1 Erasable Optical Amplifiers
- 12.3.7.2 Semiconductor Optical Amplifiers
- 12.3.7.3 Fiber Optical Amplifiers
- 12.3.7.4 Raman Optical Amplifiers
- 12.3.8 Subsegment Pricing and Adoption Trends
- 12.3.9 Leading Suppliers and Competition
- 12.3.10 Regional Demand and Opportunities
- 12.4 By Component - Market Size and Forecast, 2024-2032
- 12.4.1 Segment Definition and Scope
- 12.4.2 Historical Market Size
- 12.4.3 Revenue Forecast, 2024-2032
- 12.4.4 Volume Forecast, 2024-2032
- 12.4.5 Base-Year Market Share, 2024
- 12.4.6 Segment CAGR and Growth Drivers
- 12.4.7 Subsegment Market Size and Forecast
- 12.4.7.1 Optical Fiber
- 12.4.7.2 Optical Filters
- 12.4.7.3 Optical Couplers
- 12.4.7.4 Optical Switches
- 12.4.8 Subsegment Pricing and Adoption Trends
- 12.4.9 Leading Suppliers and Competition
- 12.4.10 Regional Demand and Opportunities
- 12.5 By Technology - Market Size and Forecast, 2024-2032
- 12.5.1 Segment Definition and Scope
- 12.5.2 Historical Market Size
- 12.5.3 Revenue Forecast, 2024-2032
- 12.5.4 Volume Forecast, 2024-2032
- 12.5.5 Base-Year Market Share, 2024
- 12.5.6 Segment CAGR and Growth Drivers
- 12.5.7 Subsegment Market Size and Forecast
- 12.5.7.1 EDFA (Erbium-Doped Fiber Amplifier)
- 12.5.7.2 SOA (Semiconductor Optical Amplifier)
- 12.5.7.3 RFA (Raman Fiber Amplifier)
- 12.5.8 Subsegment Pricing and Adoption Trends
- 12.5.9 Leading Suppliers and Competition
- 12.5.10 Regional Demand and Opportunities
- 12.6 By Application - Market Size and Forecast, 2024-2032
- 12.6.1 Segment Definition and Scope
- 12.6.2 Historical Market Size
- 12.6.3 Revenue Forecast, 2024-2032
- 12.6.4 Volume Forecast, 2024-2032
- 12.6.5 Base-Year Market Share, 2024
- 12.6.6 Segment CAGR and Growth Drivers
- 12.6.7 Subsegment Market Size and Forecast
- 12.6.7.1 Telecommunications
- 12.6.7.2 CATV (Cable Television)
- 12.6.7.3 Datacom
- 12.6.7.4 Research and Development
- 12.6.8 Subsegment Pricing and Adoption Trends
- 12.6.9 Leading Suppliers and Competition
- 12.6.10 Regional Demand and Opportunities
- 12.7 Segment Growth Comparison
- 12.8 Segment Attractiveness and Priority Matrix
Chapter 13 Global Optical Amplifiers End-Use and Application Market Outlook
- 13.1 End-Use Industry and Customer Demand Structure
- 13.2 Leading Applications and Customer Groups
- 13.3 End-Use Market Size, Share and Forecast
- 13.4 Major End-Use Industry Deep Dives
- 13.4.1 Customer Requirements and Use Cases
- 13.4.2 Demand and Replacement Cycles
- 13.4.3 Technical and Regulatory Considerations
- 13.4.4 Purchasing and Procurement Models
- 13.4.5 Leading Vendors and Distribution Channels
- 13.4.6 Forecast and Commercial Opportunities
- 13.5 Emerging Applications and Cross-Segment Demand
- 13.6 End-Use Industry Investment Priorities
Chapter 14 Global Optical Amplifiers Geographic Market Outlook, 2024-2032
- 14.1 Regional Market Size and Share, 2024
- 14.2 Regional Market Forecast, 2024-2032
- 14.3 Regional Pricing, Production and Demand Differences
- 14.4 North America
- 14.4.1 United States
- 14.4.2 Canada
- 14.4.3 Mexico
- 14.5 Europe
- 14.5.1 Germany
- 14.5.2 France
- 14.5.3 Italy
- 14.5.4 United Kingdom
- 14.5.5 Spain
- 14.5.6 Poland
- 14.5.7 Russia
- 14.5.8 Netherlands
- 14.5.9 Belgium
- 14.5.10 Sweden
- 14.5.11 Denmark
- 14.5.12 Norway
- 14.5.13 Rest of Europe
- 14.6 Asia Pacific
- 14.6.1 China
- 14.6.2 India
- 14.6.3 Japan
- 14.6.4 South Korea
- 14.6.5 Thailand
- 14.6.6 Indonesia
- 14.6.7 Vietnam
- 14.6.8 Malaysia
- 14.6.9 Australia
- 14.6.10 Rest of Asia Pacific
- 14.7 Latin America
- 14.7.1 Brazil
- 14.7.2 Argentina
- 14.7.3 Colombia
- 14.7.4 Chile
- 14.7.5 Rest of Latin America
- 14.8 Middle East
- 14.8.1 Saudi Arabia
- 14.8.2 United Arab Emirates
- 14.8.3 Turkey
- 14.8.4 Israel
- 14.8.5 Iran
- 14.8.6 Rest of the Middle East
- 14.9 Africa
- 14.9.1 South Africa
- 14.9.2 Egypt
- 14.9.3 Nigeria
- 14.9.4 Morocco
- 14.9.5 Rest of Africa
- 14.10 Regional Investment, Policy and Supply Chain Differences
- 14.11 Regional Competitive Landscape
- 14.12 Geographic Growth Hotspots
Chapter 15 Global Optical Amplifiers Technology, Innovation and Sustainability Outlook
- 15.1 Technology Landscape and Maturity
- 15.2 Product, Process and Service Innovation
- 15.3 AI, Automation and Digital Tools in the Industry
- 15.4 Technology Adoption and Performance Benchmarking
- 15.5 Innovation Pipeline and R&D Investment
- 15.6 Patent and Intellectual Property Trends
- 15.7 Energy Efficiency and Resource Management
- 15.8 Sustainability, Recycling and Circularity
- 15.9 Technology Roadmap, 2024-2032
- 15.10 Risks of Obsolescence and Technology Substitution
Chapter 16 Global Optical Amplifiers Market Key Strategic Imperatives
- 16.1 Growth and Market Entry Priorities
- 16.2 High-Return Products and Segments
- 16.3 Pricing, Profitability and Cost Optimization
- 16.4 Technology Investment and Product Differentiation
- 16.5 Supply Chain Localization and Resilience
- 16.6 Distribution and Customer Acquisition
- 16.7 Partnership, Acquisition and Capacity Strategy
- 16.8 Regional Expansion Priorities
- 16.9 Short-, Medium- and Long-Term Actions
Chapter 17 Competition Outlook
- 17.1 Industry Competition Characteristics
- 17.2 Market Structure and Concentration
- 17.3 Market Share and Competitive Positioning, 2024
- 17.4 Company-Wise Revenue and Product Benchmarking
- 17.5 Production and Service Capacity Benchmarking
- 17.6 Technology, Pricing and Differentiation
- 17.7 Regional Footprint and Distribution Strength
- 17.8 Mergers, Acquisitions and Strategic Alliances
- 17.9 New Entrants and Competitive Threats
- 17.10 Porter's Five Forces and Industry Attractiveness
- 17.11 Competitive Outlook, 2024-2032
Chapter 18 Company Profiles
- 18.1 Company Coverage and Selection Criteria
- 18.2 Cisco Systems
- 18.2.1 Business Description
- 18.2.2 Company Ownership and Geographic Presence
- 18.2.3 Product and Service Portfolio
- 18.2.4 Manufacturing and Operating Footprint
- 18.2.5 Production Capacity and Expansion Plans
- 18.2.6 Financial Performance and Investment
- 18.2.7 Market Share and Competitive Position
- 18.2.8 Technology and Innovation Capabilities
- 18.2.9 Strategic Alliances or Partnerships
- 18.2.10 Recent Developments
- 18.2.11 Growth Strategy and Outlook
- 18.3 Nistica
- 18.4 Mellanox Technologies
- 18.5 Fujitsu
- 18.6 Infinera Corporation
- 18.7 ADVA Optical Networking
- 18.8 Huawei Technologies
- 18.9 Nokia Corporation
- 18.10 Amdocs
- 18.11 Typeset
- 18.12 Other Relevant Market Participants
Note: Every listed company is profiled on the structure shown under the first company. The company list is preliminary and may change based on research findings, market developments, data availability and client requirements.
Chapter 19 Disclaimer
- 19.1 Research and Forecast Disclaimer
- 19.2 Data Source and Estimation Limitations
Note: The depth of individual sections depends on data availability for this market. Volume, capacity, trade and other unit-based metrics are included where applicable.

