
Market Overview:
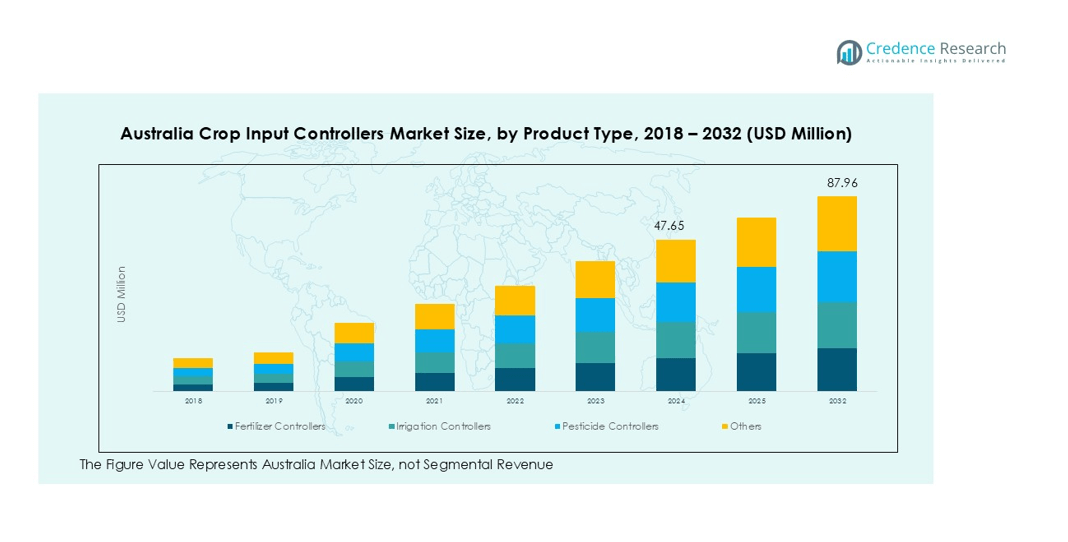
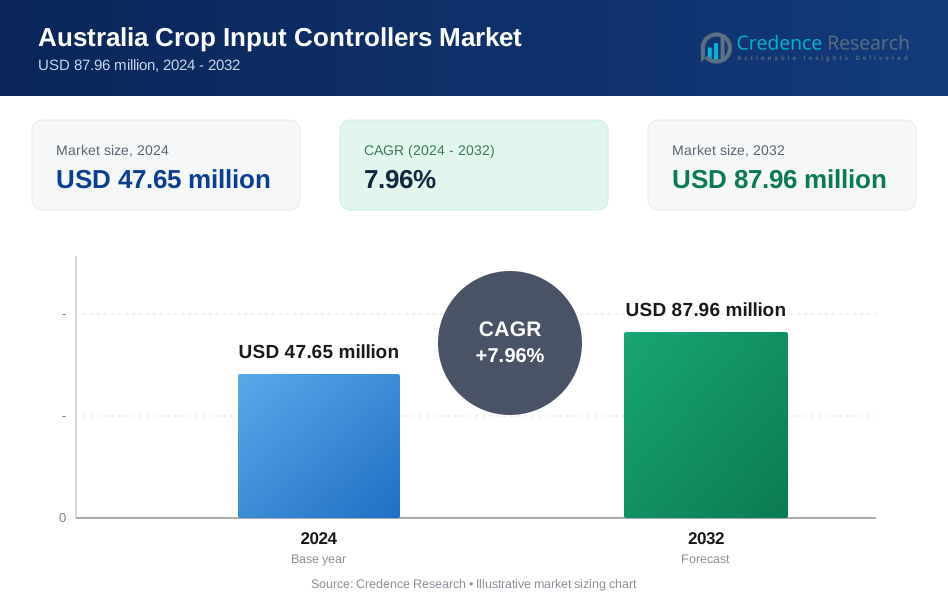
The Australia Crop Input Controllers size was valued at USD 35.42 million in 2018 to USD 47.65 million in 2024 and is anticipated to reach USD 87.96 million by 2032, at a CAGR of 7.96% during the forecast period.
| REPORT ATTRIBUTE | DETAILS |
|---|---|
| Historical Period | 2020-2023 |
| Base Year | 2024 |
| Forecast Period | 2025-2032 |
| Australia Crop Input Controllers Market Size 2024 | USD 47.65 million |
| Australia Crop Input Controllers Market, CAGR | 7.96% |
| Australia Crop Input Controllers Market Size 2032 | USD 87.96 million |
Key drivers for the Australian market include the growing focus on efficient fertilizer and pesticide use, driven by sustainability concerns and stricter environmental regulations. Adoption of GPS-guided equipment, variable rate technologies, and real-time monitoring solutions is helping farmers improve yields while reducing resource wastage. National initiatives encouraging water conservation, especially in drought-affected regions, further boost the use of input controllers. The need to maintain soil health and manage rising operational expenses also contributes to market expansion.
Regionally, New South Wales and Victoria lead the adoption due to their concentration of large-scale mechanized farms. Queensland and Western Australia show strong uptake in cereal production and broadacre cropping. South Australia is advancing in viticulture and horticulture applications. This regional distribution highlights the diverse farming practices in Australia and the essential role of crop input controllers in driving agricultural efficiency and sustainability.
Market Insights:
- The Australia Crop Input Controllers market was valued at USD 35.42 million in 2018, reached USD 47.65 million in 2024, and is projected to attain USD 87.96 million by 2032 at a CAGR of 7.96%.
- Rising focus on efficient fertilizer and pesticide use under strict environmental regulations is driving strong adoption of input controllers across farming regions.
- GPS-guided equipment, variable rate technologies, and real-time monitoring solutions are enhancing yields while minimizing resource wastage and operational costs.
- National initiatives on water conservation in drought-affected areas and soil health management are reinforcing the use of precision tools.
- New South Wales and Victoria hold 42% share of the market, supported by mechanized farming and strong agricultural infrastructure.
- Queensland and Western Australia account for 36% share, led by large-scale cereal and broadacre cropping with rising export demand.
- South Australia and Tasmania represent 22% share, with strong adoption in vineyards, orchards, and horticulture where precision input control improves quality and sustainability.
Market Drivers:
Growing Need for Precision Agriculture to Optimize Resource Utilization
The Australia Crop Input Controllers market is driven by the rising need for precision farming to maximize yields while minimizing resource use. Farmers face increasing pressure to reduce fertilizer and pesticide application without compromising crop quality. Input controllers enable targeted application, helping minimize wastage and optimize soil health. This approach aligns with sustainability goals and supports long-term productivity gains across diverse cropping systems.
- For instance, Hunter Precision Agriculture's autonomous Ag Spray Drone can cover 150 acres per hour, ensuring highly efficient and targeted application of inputs.
Rising Input Costs Encouraging Efficient Farm Management
Escalating prices of fertilizers, pesticides, and irrigation water have made efficient resource management essential. The Australia Crop Input Controllers market benefits from tools that allow accurate input allocation, reducing unnecessary expenses for farmers. By providing real-time data, controllers help in making cost-effective decisions that improve profitability. It empowers producers to achieve better returns even in volatile commodity markets.
Government Policies Promoting Sustainable Agricultural Practices
National and state-level policies promoting sustainable farming directly encourage adoption of advanced input management systems. The Australia Crop Input Controllers market gains support from initiatives focusing on water conservation and soil preservation. Compliance with stricter environmental regulations increases reliance on precision tools. It strengthens the role of input controllers in meeting both regulatory standards and productivity goals.
Technological Advancements Driving Adoption Across Farming Regions
Continuous innovation in agricultural technology is expanding the functionality and reliability of input controllers. The Australia Crop Input Controllers market benefits from integration with GPS systems, soil sensors, and variable rate technologies. Farmers in mechanized farming regions are increasingly adopting these systems to manage diverse crop needs. It fosters a shift toward data-driven agriculture, enhancing decision-making and operational efficiency across Australia’s key farming zones.
- For instance, tractor guidance systems from companies like Trimble are capable of achieving pass-to-pass accuracy of just 2 centimeters, which minimizes overlap during field operations.
Market Trends:
Integration of Smart Technologies and Data-Driven Solutions in Farming
The Australia Crop Input Controllers market is witnessing a strong trend toward integration with advanced technologies such as GPS guidance, IoT sensors, and variable rate systems. Farmers are increasingly adopting connected devices that provide real-time data on soil conditions, weather patterns, and crop requirements. It supports precise input management, reduces wastage, and enhances sustainability. Technology providers are focusing on user-friendly designs that simplify adoption even for medium-scale farms. This trend highlights the movement toward digital agriculture, where data-driven tools guide critical decisions. It strengthens efficiency while addressing challenges of rising costs and environmental concerns.
- For instance, Trimble’s GFX-1260 display enables farmers to manage up to 255 individual implement sections which provides an extremely high level of precision for input application.
Shift Toward Sustainable Farming and Regulatory Compliance
The Australia Crop Input Controllers market is shaped by a growing emphasis on sustainability and compliance with environmental standards. Farmers are under pressure to optimize fertilizer and pesticide use while protecting soil and water resources. It drives demand for input controllers that ensure accurate application aligned with best practices. Rising awareness about climate change and government-backed initiatives further reinforce this shift. Input controllers are increasingly viewed as essential tools to meet regulatory demands and achieve long-term ecological balance. This trend positions precision farming technologies as central to the modernization of Australia’s agricultural sector.
- For instance, John Deere’s See & Spray Ultimate system utilizes 36 cameras on its boom to differentiate between crops and weeds which allows for a targeted spray application that significantly reduces overall herbicide volume.
Market Challenges Analysis:
High Initial Investment and Limited Access for Small Farmers
The Australia Crop Input Controllers market faces a major challenge in the form of high upfront costs. Many small and medium-scale farmers struggle to invest in advanced precision farming systems due to budget constraints. It creates a divide where large farms adopt controllers more easily while smaller operators rely on traditional methods. Limited financial incentives and slower return on investment reduce willingness to adopt. This challenge restricts broader penetration of the technology in regions dominated by fragmented landholdings.
Complexity of Technology Adoption and Skill Gaps in Rural Areas
The Australia Crop Input Controllers market also encounters barriers linked to the complexity of technology adoption. Farmers in rural and remote areas often face difficulties in operating advanced systems without proper training. It creates reliance on external support services, which increases operational costs and reduces efficiency. Limited access to skilled technicians further slows adoption in underserved regions. Resistance to change among traditional farming communities compounds this issue. Overcoming skill gaps remains essential to achieve widespread adoption across the agricultural landscape.
Market Opportunities:
Expansion of Digital Agriculture and Smart Farming Solutions
The Australia Crop Input Controllers market has strong opportunities through the expansion of digital agriculture. Growing demand for data-driven decision-making encourages integration with IoT platforms, cloud-based tools, and GPS technologies. It enables real-time monitoring of soil, crop, and weather conditions, improving resource allocation. Companies introducing scalable, affordable solutions for mid-sized farms can expand market reach. Rising acceptance of smart farming practices ensures greater reliance on controllers to drive efficiency. This creates long-term potential for technology providers to strengthen adoption across diverse farming zones.
Government Support and Rising Focus on Sustainability
The Australia Crop Input Controllers market benefits from policies that encourage sustainable farming and resource conservation. Incentives for precision agriculture adoption create favorable conditions for manufacturers and suppliers. It aligns with regulatory goals of reducing chemical overuse and promoting water efficiency. Farmers gain opportunities to meet compliance requirements while improving productivity. Increasing focus on climate-resilient agriculture further enhances the need for input controllers. This opportunity positions the market as a key enabler of environmentally responsible and profitable farming in Australia.
Market Segmentation Analysis:
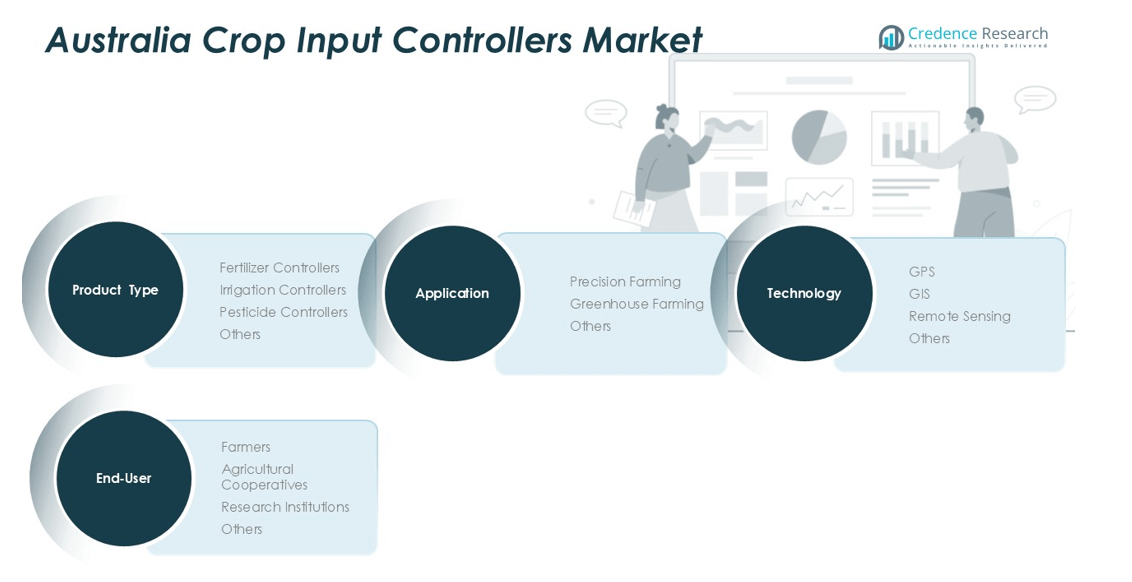
By Product Type
The Australia Crop Input Controllers market is segmented into fertilizer controllers, irrigation controllers, pesticide controllers, and others. Fertilizer controllers hold the largest share, driven by the country emphasis on nutrient management and soil health. Irrigation controllers follow, supported by water conservation initiatives in drought-prone regions. Pesticide controllers are gaining traction as stricter regulations push farmers toward accurate application systems. It highlights the demand for sustainable input management across crop types.
- For instance, Rubicon Water has implemented its automated irrigation technology in Northern Victoria, the system uses over 15,000 interconnected solar-powered gates to control water flow, which conserves more than 430 million cubic meters of water each year.
By Application
The Australia Crop Input Controllers market is divided into precision farming, greenhouse farming, and others. Precision farming dominates due to widespread adoption in mechanized agriculture, where efficiency and yield optimization are critical. Greenhouse farming contributes a smaller but growing share, supported by demand for controlled environments in horticulture. Other applications include specialty crops where accurate input distribution is vital. It underscores the role of controllers in enhancing productivity across diverse farming systems.
- For instance, Sundrop Farms operates a greenhouse facility in South Australia that produces over 15,000 tonnes of truss tomatoes annually using solar power.
By Technology
The Australia Crop Input Controllers market by technology includes GPS, GIS, remote sensing, and others. GPS-based systems lead adoption due to their integration with mechanized equipment and ease of operation. GIS and remote sensing are expanding with their ability to provide advanced mapping and crop monitoring. Other technologies, including IoT-linked solutions, are emerging to strengthen decision-making for farmers. It positions technological integration as a core driver of efficiency and sustainability in agriculture.
Segmentations:
By Product Type- Fertilizer Controllers
- Irrigation Controllers
- Pesticide Controllers
- Others
- Precision Farming
- Greenhouse Farming
- Others
- GPS
- GIS
- Remote Sensing
- Others
- Farmers
- Agricultural Cooperatives
- Research Institutions
- Others
Regional Analysis:
New South Wales and Victoria Leading Adoption Through Large-Scale Mechanized Farming
New South Wales and Victoria together hold 42% share of the Australia Crop Input Controllers market. Their dominance is driven by extensive mechanized farming operations across grains, oilseeds, and mixed crops. Farmers actively invest in precision technologies to manage rising input costs and improve efficiency. It supports large farms in optimizing fertilizer and water usage across vast areas. Strong infrastructure and access to advanced agricultural services further accelerate adoption in these regions.
Queensland and Western Australia Expanding Use in Broadacre Cropping
Queensland and Western Australia collectively account for 36% share of the Australia Crop Input Controllers market. Growth is supported by large-scale cereal and broadacre farming that requires efficient resource allocation. These states prioritize input controllers to manage variable soil conditions and optimize input distribution. It ensures higher yields and supports sustainability in grain-dominant regions. Strong demand for export-quality crops further drives integration of advanced farming technologies.
South Australia and Tasmania Driving Growth in Horticulture and Viticulture
South Australia and Tasmania represent 22% share of the Australia Crop Input Controllers market. These regions focus heavily on vineyards, orchards, and horticultural farms where precision management is vital. Input controllers help farmers achieve consistent quality while reducing resource wastage. It supports producers in aligning with sustainability and water efficiency goals. Rising exports of wine and high-value crops create growth opportunities for advanced input control solutions.
Key Player Analysis:
- John Deere
- Trimble Inc.
- Ag Leader Technology
- Topcon Positioning Systems, Inc.
- Raven Industries, Inc.
- DICKEY-john Corporation
- TeeJet Technologies
- AgJunction Inc.
- CNH Industrial N.V.
- Kubota Corporation
- Yara International ASA
- Valmont Industries, Inc.
- Lindsay Corporation
- AGCO Corporation
Competitive Analysis:
The Australia Crop Input Controllers market features global OEMs and agile specialists. John Deere, CNH, and AGCO compete through ISOBUS-compatible hardware and integrated platforms. Trimble, Topcon, and Ag Leader lead in guidance, variable rate, and analytics. Raven and DICKEY-john strengthen distribution through retrofit kits and dealer partnerships. TeeJet focuses on precision spraying with section control and flow accuracy. Valmont and Lindsay link controllers to pivot irrigation networks and telemetry. Kubota advances compact platforms for mixed and specialty farms. Yara expands nutrient management through sensor-driven dosing and agronomy support. Local distributors anchor service with rapid parts access and field training. The Australia Crop Input Controllers ecosystem rewards open APIs, subscription software, and reliable after-sales support. It favors vendors that reduce downtime, prove input savings, and integrate with existing machinery. Competitive advantage comes from simple setup, strong agronomic insights, and statewide service coverage. Pricing discipline and demonstrable ROI drive customer retention.
Recent Developments:
- In January 2025, John Deere revealed new autonomous technology at the Consumer Electronics Show (CES), including four fully autonomous machines and new retrofit kits to upgrade existing equipment.
- In February 2025, Platform Science completed the acquisition of Trimble's global transportation telematics business units, with Trimble becoming a shareholder and gaining a seat on Platform Science's board.
Report Coverage:
The research report offers an in-depth analysis based on Product Type, Application, Technology and End-User. It details leading market players, providing an overview of their business, product offerings, investments, revenue streams, and key applications. Additionally, the report includes insights into the competitive environment, SWOT analysis, current market trends, as well as the primary drivers and constraints. Furthermore, it discusses various factors that have driven market expansion in recent years. The report also explores market dynamics, regulatory scenarios, and technological advancements that are shaping the industry. It assesses the impact of external factors and global economic changes on market growth. Lastly, it provides strategic recommendations for new entrants and established companies to navigate the complexities of the market.
Future Outlook:
- The Australia Crop Input Controllers market will expand with wider adoption of precision farming practices across mechanized farms.
- Farmers will increase reliance on GPS-enabled and sensor-based systems to achieve better input efficiency.
- Integration with IoT and cloud-based platforms will enhance real-time monitoring and decision-making in diverse crop environments.
- Irrigation controllers will gain stronger demand due to persistent drought conditions and emphasis on water conservation.
- Fertilizer controllers will remain a dominant category, supported by sustainability goals and stricter soil management policies.
- Growing adoption of greenhouse farming will create opportunities for compact and adaptable controller systems.
- Partnerships between technology providers and local cooperatives will strengthen distribution networks and service availability.
- Training programs and skill development initiatives will reduce barriers to adoption in regional and rural areas.
- Vendors offering affordable solutions with scalable features will capture interest from small and mid-sized farms.
- The market will increasingly reward companies that provide data-driven insights, strong after-sales support, and measurable input savings.
Request a Free Sample
Fill in your details and we'll send you a free sample report.
- Sample data tables & charts
- Research methodology
Need a Custom Version of This Report?
Tailor the scope, geography, or segments to your exact requirements.
- Custom geography or segment scope
- Direct access to our analyst team
Frequently Asked Questions
What is the current market size for Australia Crop Input Controllers, and what is its projected size in 2032?
At what Compound Annual Growth Rate is the Australia Crop Input Controllers projected to grow between 2024 and 2032?
Which Australia Crop Input Controllers segment held the largest share in 2024?
What are the primary factors fueling the growth of the Australia Crop Input Controllers?
Which region commanded the largest share of the Australia Crop Input Controllers in 2024?
Table of Content
Chapter 1. Report Introduction
- 1.1 Report Description & Purpose
- 1.1.1 Report Title & Market Definition
- 1.1.2 Unique Selling Propositions (USP) & Key Differentiators
- 1.1.3 Value Proposition for Stakeholders
- 1.2 Research Objectives
- 1.2.1 Market Sizing Objectives (Volume & Revenue)
- 1.2.2 Segmentation Objectives
- 1.2.3 Competitive Intelligence Objectives
- 1.2.4 Forecast & Scenario Objectives
- 1.3 Report Scope
- 1.3.1 Australia Crop Input Controllers Scope – Types & Subtypes Covered
- 1.3.2 Geographic Scope – Regions & Countries Covered
- 1.3.3 Historical Period, Base Year & Forecast Period (2024; forecast to 2032)
- 1.3.4 Inclusions & Exclusions
- 1.4 HS Code & Classification Framework
- 1.5 Currency, Units & Pricing Basis
- 1.6 Target Stakeholders
- 1.7 Limitations & Assumptions
Chapter 2. Executive Summary
- 2.1 Global Australia Crop Input Controllers Market Snapshot
- 2.1.1 Market Size – Historical (2024) & Forecast (2024-2032) (2024: USD 47.65 million → 2032: USD 87.96 million)
- 2.1.2 Volume & Revenue – Global Totals
- 2.1.3 Key Market Highlights – Top Five Facts
- 2.2 Australia Crop Input Controllers Market Segmentation Snapshot
- 2.2.1 Market Split by Region – 2024 vs. 2032
- 2.3 Competitive Snapshot
- 2.3.1 Top 10 Players by Revenue Share – 2024
- 2.3.2 Top 10 Players by Volume Share – 2024
- 2.3.3 Recent Strategic Developments (18-Month Summary)
- 2.4 Key Investment Highlights & Strategic Conclusions
Chapter 3. Australia Crop Input Controllers Market Dynamics & Industry Analysis
- 3.1 Market Overview & Context
- 3.1.1 Australia Crop Input Controllers Market Position in the Broader Automotive Value Chain
- 3.1.2 OEM vs. Replacement Market Dynamics
- 3.1.3 Market Maturity & Development Stage by Region
- 3.2 Australia Crop Input Controllers Market Drivers
- 3.3 Australia Crop Input Controllers Market Restraints & Challenges
- 3.4 Australia Crop Input Controllers Market Opportunities
- 3.5 Porter's Five Forces Analysis
- 3.5.1 Threat of New Entrants
- 3.5.2 Bargaining Power of Suppliers
- 3.5.3 Bargaining Power of Buyers
- 3.5.4 Threat of Substitutes
- 3.5.5 Competitive Rivalry – Intensity Assessment
- 3.6 Australia Crop Input Controllers Value Chain Analysis
- 3.6.1 Upstream – Raw Material/Input Suppliers
- 3.6.1.1 Raw Material/Input 1
- 3.6.1.2 Raw Material/Input 2
- 3.6.1.3 Raw Material/Input 3
- 3.6.2 Midstream – Production/Manufacturing/Service Delivery
- 3.6.2.1 Production/Process Overview
- 3.6.2.2 Key Facility Locations & Capacity by Manufacturer
- 3.6.3 Downstream – Distribution & End Consumer
- 3.6.3.1 Primary Channel – B2B/OEM
- 3.6.3.2 Secondary Channels – Dealer, Retail, Online, Direct
- 3.6.4 Value Chain Profitability Analysis
- 3.6.1 Upstream – Raw Material/Input Suppliers
- 3.7 PESTEL Analysis
- 3.7.1 Political Factors
- 3.7.2 Economic Factors
- 3.7.3 Social Factors
- 3.7.4 Technological Factors
- 3.7.5 Environmental Factors
- 3.7.6 Legal Factors
- 3.8 Australia Crop Input Controllers Supply Chain Analysis
- 3.8.1 Raw Material/Input Supply Risk Assessment
- 3.8.2 Manufacturing Concentration Risk (Geographic Exposure)
- 3.8.3 Trade Disruption Impact Analysis
- 3.9 Regulatory & Policy Landscape
Note: The regulatory and policy landscape section covers regulations based on their applicability to the market, Australia Crop Input Controllers category, geography, and scope of the study. Only regulatory frameworks with a material impact on operations, compliance, trade, sustainability, or market access are analyzed in detail.
Chapter 4. Key Investment Pockets & Opportunity Analysis
- 4.1 Australia Crop Input Controllers Market Attractiveness Analysis
- 4.1.1 By Region – Investment Attractiveness Matrix (Volume × CAGR)
- 4.2 Absolute Revenue Growth Opportunity
- 4.2.1 By Region – Absolute USD Growth Through 2032
- 4.3 Incremental Volume Opportunity
- 4.3.1 By Region – Incremental Volume Through 2032
- 4.3.2 Segment – Incremental Volume
- 4.4 Emerging Submarket Opportunity Deep Dive (Subject to Applicability)
- 4.5 Emerging Market Opportunity Scorecards
- 4.5.1 United States
- 4.5.2 Europe
- 4.5.3 Asia
- 4.5.4 Middle East & Africa
Note: Emerging Market Opportunity Scorecards will be included based on relevance and strategic importance. Regions listed are indicative and may vary depending on data availability and market dynamics.
Chapter 5. Australia Crop Input Controllers Import-Export Analysis & Trade Flows
- 5.1 Global Trade Overview
- 5.1.1 Global Export Value by Country (2024)
- 5.1.2 Global Export Volume by Country (2024)
- 5.1.3 Global Import Value by Country (2024)
- 5.1.4 Global Import Volume by Country (2024)
- 5.1.5 Net Trade Balance by Country (2024)
- 5.2 Export Analysis – Segment
- 5.2.1 Type 1 (HS Code)
- 5.2.2 Type 2 (HS Code)
- 5.2.3 Type 3 (HS Code)
- 5.2.4 Type 4 (HS Code)
- 5.2.5 Type 5 (HS Code)
- 5.3 Import Analysis – Segment
- 5.3.1 Type 1 (HS Code)
- 5.3.2 Type 2 (HS Code)
- 5.3.3 Type 3 (HS Code)
- 5.3.4 Type 4 (HS Code)
- 5.3.5 Type 5 (HS Code)
- 5.4 Average Unit Trade Prices
- 5.4.1 Average Export Price – Segment & Country
- 5.4.2 Average Import Price – Segment & Source Country
- 5.4.3 Price Trends (2024)
- 5.5 Key Trade Route Analysis
- 5.5.1 Trade Route 1
- 5.5.2 Trade Route 2
- 5.5.3 Trade Route 3
- 5.5.4 Trade Route 4
- 5.5.5 Trade Route 5
- 5.6 Trade Policy Impact Assessment
- 5.6.1 US Anti-Dumping & Section 301 Tariffs
- 5.6.2 EU Customs Union Impact
- 5.6.3 Major Free Trade Agreements
- 5.6.4 USMCA Rules of Origin
Note: Trade policy analysis will be included only where relevant to the Australia Crop Input Controllers market.
Chapter 6. Competitive Landscape & Company Benchmarking
- 6.1 Australia Crop Input Controllers Market Concentration & Structure
- 6.1.1 Herfindahl-Hirschman Index (HHI) – vs. 2024
- 6.1.2 Tier 1, Tier 2 & Tier 3 Market Structure
- 6.1.3 Global, Regional & Local Player Dynamics
- 6.2 Australia Crop Input Controllers Market Share Analysis – 2024
- 6.2.1 Global Revenue Share by Company
- 6.2.2 Global Volume Share by Company
- 6.2.3 Regional Revenue Share
- 6.2.4 Market Share Evolution ( vs. 2024)
- 6.2.5 OEM Segment Share by Company
- 6.2.6 Replacement Segment Share by Company
- 6.3 Production/Delivery Capacity & Facility Analysis
- 6.3.1 Global Installed Capacity
- 6.3.2 Capacity Utilization Rates
- 6.3.3 Production/Output Volume
- 6.3.4 Facility Locations & Capacity Map
- 6.3.5 Planned Capacity Additions
- 6.4 Australia Crop Input Controllers Competitive Benchmarking Matrix
- 6.4.1 Revenue, Volume, CAGR & Profitability Comparison
- 6.4.2 Channel Revenue Mix
- 6.4.3 Geographic Revenue Exposure
- 6.4.4 R&D Intensity
- 6.4.5 Sustainability Maturity
- 6.5 Strategic Developments in Australia Crop Input Controllers (Last 24 Months)
- 6.5.1 Mergers, Acquisitions & Divestments
- 6.5.2 New Australia Crop Input Controllers Launches
- 6.5.3 Facility Expansions
- 6.5.4 Strategic Alliances, Joint Ventures & Partnerships
- 6.5.5 Distribution Expansion & Market Entry
- 6.5.6 Sustainability & ESG Initiatives
- 6.6 Competitive Strategy Mapping
- 6.6.1 Leader, Challenger, Follower & Niche Classification
- 6.6.2 Pricing Strategy Comparison
- 6.6.3 Channel Strategy Matrix
Note: Strategic developments are included based on their materiality and the availability of reliable information.
Chapter 7. Global Australia Crop Input Controllers Market – By Distribution Channel
- 7.1 Segment Overview
- 7.1.1 Volume & Revenue Split by Channel (2024 & 2032)
- 7.1.2 Channel Mix Evolution (2024-2032)
Chapter 8. Regional Market Analysis – Global Overview
- 8.1 Global Regional Overview
- 8.1.1 Regional Volume Share
- 8.1.2 Regional Revenue Share
- 8.1.3 Regional Volume by Region
- 8.1.4 Regional Revenue by Region
- 8.1.5 Regional Forecast Through 2032
- 8.2 Cross-Regional Segment Analysis
- 8.2.1 By Distribution Channel
- 8.2.2 By Brand/Price Tier
Chapter 9. North America Australia Crop Input Controllers Market
- 9.1 United States
- 9.2 Canada
- 9.3 Mexico
Chapter 10. Europe Australia Crop Input Controllers Market
- 10.1 Germany
- 10.2 France
- 10.3 Italy
- 10.4 United Kingdom
- 10.5 Spain
- 10.6 Poland
- 10.7 Russia
- 10.8 Netherlands
- 10.9 Belgium
- 10.10 Sweden
- 10.11 Denmark
- 10.12 Norway
- 10.13 Rest of Europe
Chapter 11. Asia Pacific Australia Crop Input Controllers Market
- 11.1 China
- 11.2 India
- 11.3 Japan
- 11.4 South Korea
- 11.5 Thailand
- 11.6 Indonesia
- 11.7 Vietnam
- 11.8 Malaysia
- 11.9 Australia
- 11.10 Rest of Asia Pacific
Chapter 12. Latin America Australia Crop Input Controllers Market
- 12.1 Brazil
- 12.2 Argentina
- 12.3 Colombia
- 12.4 Chile
- 12.5 Rest of Latin America
Chapter 13. Middle East Australia Crop Input Controllers Market
- 13.1 Saudi Arabia
- 13.2 United Arab Emirates
- 13.3 Turkey
- 13.4 Israel
- 13.5 Iran
- 13.6 Rest of the Middle East
Chapter 14. Africa Australia Crop Input Controllers Market
- 14.1 South Africa
- 14.2 Egypt
- 14.3 Nigeria
- 14.4 Morocco
- 14.5 Rest of Africa
Chapter 15. Australia Crop Input Controllers Company Profiles
- 15.1 [Company 01]
- 15.1.1 Company Overview
- 15.1.2 Key Management Personnel
- 15.1.3 Products & Services Portfolio
- 15.1.4 Financial Performance
- 15.1.5 Key Market Focus & Geographic Presence
- 15.1.6 Recent Developments & Strategic Initiatives
Note: The company profile list is preliminary and may change based on research findings, market developments, data availability, and client requirements.
Chapter 16. Appendices
- Appendix A – List of Abbreviations & Acronyms
- Appendix B – Industry Classification Code Reference – Full Series
- Appendix C – Production & Capacity Data Tables
- Appendix D – End-Use & Demand Base Tables
- Appendix E – Consumption & Replacement Rate Assumptions
- Appendix F – ASP Reference Tables
- Appendix G – Manufacturing & Facility Database
- Appendix H – Import-Export Data Tables
- Appendix I – Regulatory Summary Tables
- Appendix J – Primary Research Participant List (Anonymized)
- Appendix K – Primary Research Questionnaire Framework
- Appendix L – Data Sources & Bibliography
- Appendix M – Market Size Divergence & Source Comparison
Chapter 17. Research Methodology
- 17.1 Research Framework & Philosophy
- 17.2 Secondary Research – Sources, Hierarchy & Data Extraction
- 17.3 Data Modeling – Bottom-Up & Top-Down Market Sizing
- 17.4 Primary Research – Stakeholder Framework, LOI & Sample Sizes
- 17.5 Forecast Methodology – Regression, Scenario & Sensitivity Analysis
- 17.6 Quality Control – Four-Layer Validation Framework
- 17.7 Limitations & Standard Assumptions
- 17.8 Disclaimer
