Market Overview
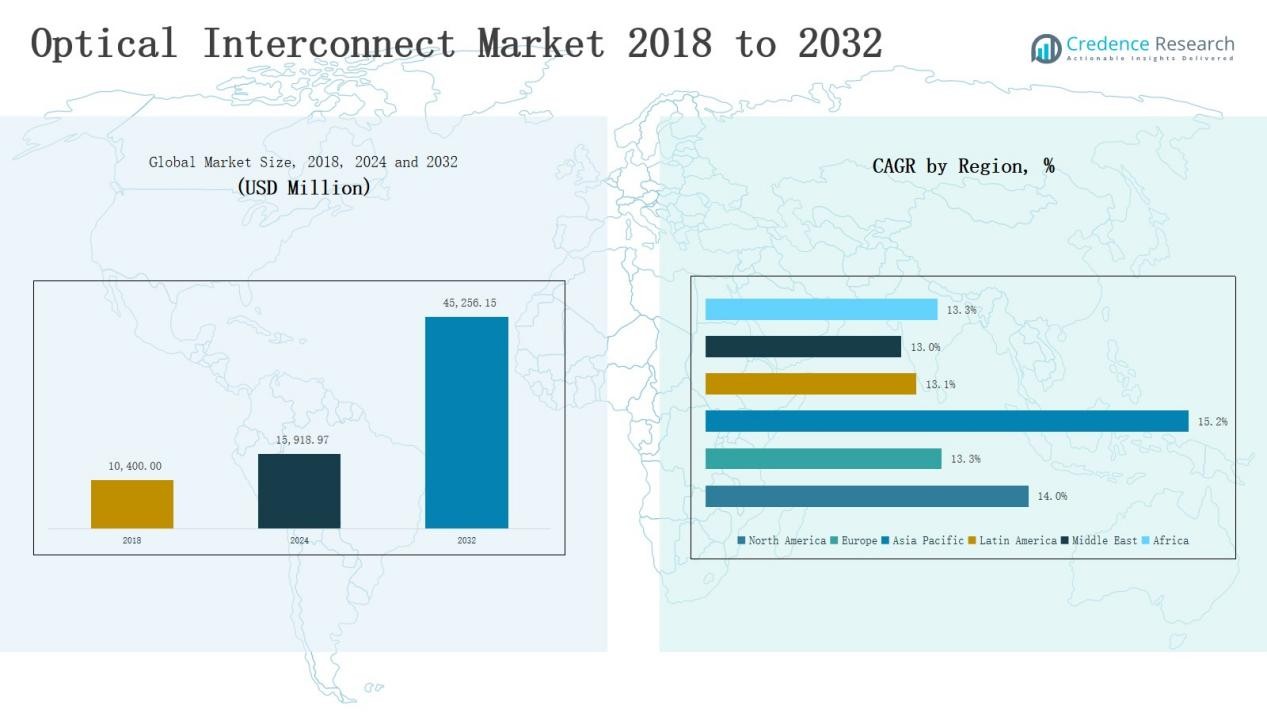
Optical Interconnect Market size was valued at USD 10,400.00 million in 2018 to USD 15,918.97 million in 2024 and is anticipated to reach USD 45,256.15 million by 2032, at a CAGR of 14.04% during the forecast period.
| REPORT ATTRIBUTE |
DETAILS |
| Historical Period |
2020-2023 |
| Base Year |
2024 |
| Forecast Period |
2025-2032 |
| Optical Interconnect Market Size 2024 |
USD 15,918.97 Million |
| Optical Interconnect Market, CAGR |
14.04% |
| Optical Interconnect Market Size 2032 |
USD 45,256.15 Million |
The optical interconnect market is characterized by strong competition among global technology leaders and specialized vendors focusing on innovation, scalability, and energy-efficient solutions. Key players include Amphenol Communications Solutions, Broadcom, Coherent Corp., Fujitsu Limited, InnoLight, Lumentum Operations LLC, Molex, NVIDIA Corporation, Sumitomo Electric Industries, and TE Connectivity, each investing heavily in advanced transceivers, silicon photonics, and photonic integrated circuits to strengthen their positions. Strategic partnerships with cloud providers and telecom operators remain central to their growth strategies. Regionally, North America led the market with a 35% share in 2024, driven by hyperscale data centers, rapid 5G deployments, and early adoption of advanced optical technologies.
Access crucial information at unmatched prices!
Request your sample report today & start making informed decisions powered by Credence Research Inc.!
Download Sample
Market Insights
- The Optical Interconnect Market grew from USD 10,400.00 million in 2018 to USD 15,918.97 million in 2024 and is projected to reach USD 45,256.15 million by 2032.
- Optical transceivers led the product segment with 32% share in 2024, supported by hyperscale data centers and 5G adoption, while cable assemblies and connectors followed with 22% and 18% shares.
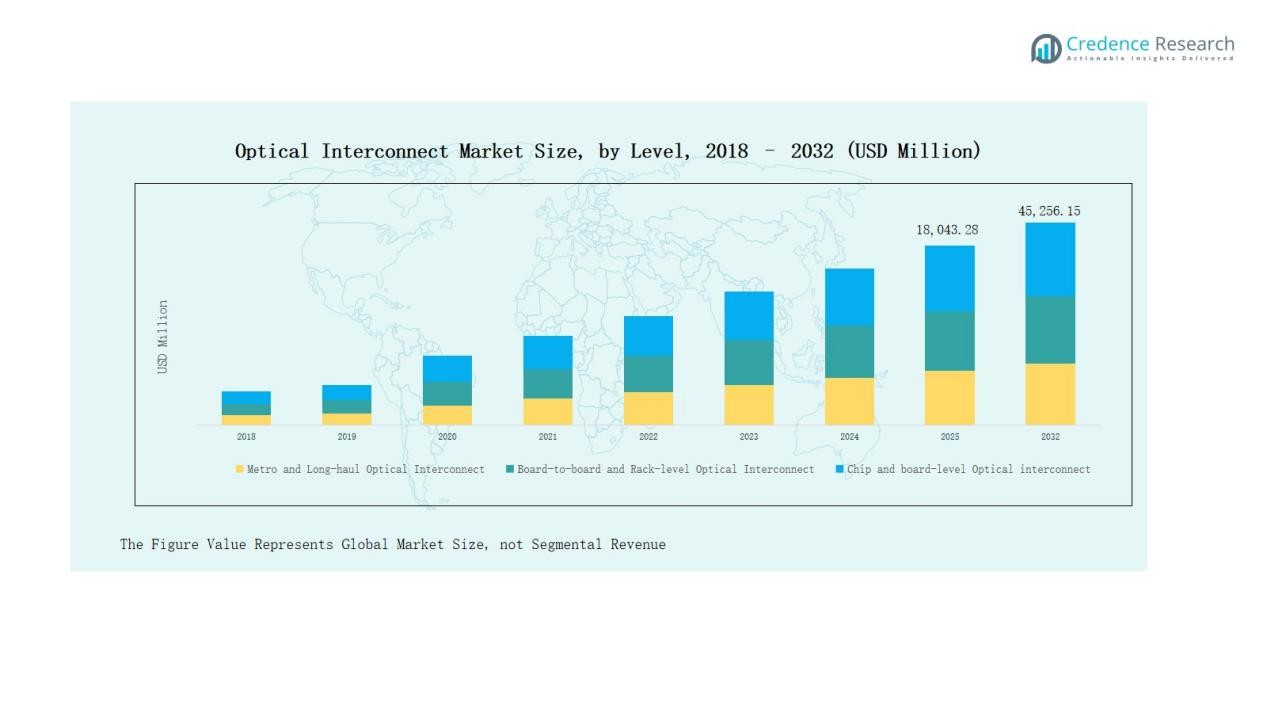
- Metro and long-haul interconnects dominated by level with 45% share in 2024, reflecting global telecom backbone upgrades, while board-to-board and rack-level interconnects held 34%.
- Single-mode fiber led with 63% share in 2024, driven by long-distance performance advantages, while multi-mode fiber maintained 37% share in short-reach enterprise and data center networks.
- North America commanded the largest regional share at 35% in 2024, followed by Asia-Pacific with 28% and Europe with 27%, fueled by data centers and 5G expansion.
Market Segment Insights
By Product
Optical transceivers held the dominant share of 32% in 2024, driven by surging demand for high-speed data transmission in hyperscale data centers and 5G infrastructure. Cable assemblies accounted for 22%, benefiting from their role in large-scale deployments, while connectors represented 18% with strong adoption in enterprise networking. Silicon photonics captured 12% share, boosted by energy-efficient and compact chip-based solutions. Free space optics, fiber, and waveguides, PIC-based interconnects, and optical engines together made up the remaining 16%, reflecting growing innovation in next-generation interconnect technologies.
- For instance, in April 2024, Cisco introduced its 8000 Series Routers with 800G optical transceivers, enabling hyperscale customers to double bandwidth efficiency.
By Level
Metro and long-haul interconnects dominated with 45% market share in 2024, supported by rising global internet traffic and large-scale telecom backbone upgrades. Board-to-board and rack-level interconnects captured 34%, driven by the need for high-bandwidth connections in high-performance computing and cloud infrastructure. Chip and board-level interconnects accounted for 21%, gaining momentum as semiconductor packaging advances push demand for low-latency, high-density interconnect solutions.
- For instance, Intel introduced its Xeon 6 processors with updated rack-level interconnect capabilities for AI and HPC workloads, enabling improved bandwidth utilization in cloud data centers.
By Fiber Mode
Single-mode fiber led the market with 63% share in 2024, owing to its superior performance in long-distance communication and growing use in metro and long-haul networks. Multi-mode fiber held the remaining 37%, maintaining relevance in short-reach data center applications due to lower cost and ease of installation. The continued expansion of hyperscale facilities ensures steady demand for both modes, though single-mode adoption remains stronger because of scalability and higher transmission speeds.
Key Growth Drivers
Rising Demand for High-Speed Data Transmission
The expansion of cloud computing, artificial intelligence, and big data analytics has sharply increased the need for faster and more reliable data transmission. Optical interconnects provide low latency and high bandwidth, making them critical for hyperscale data centers and telecommunication networks. The transition to 5G infrastructure and the adoption of next-generation computing architectures are also accelerating the demand for advanced optical solutions, ensuring sustained growth for transceivers, silicon photonics, and cable assemblies in the market.
- For instance, IIT Madras launched two indigenously developed silicon photonics products at its Center of Excellence, marking a significant milestone for India’s capabilities in photonic chip design and commercial deployment.
Growing Deployment of 5G and Edge Computing
The global rollout of 5G networks and the proliferation of edge computing have created significant opportunities for optical interconnect solutions. These technologies require robust backhaul and fronthaul networks capable of managing massive data traffic with low latency. Optical engines and transceivers enable seamless data transfer across long-haul and metro networks, while chip-to-chip interconnects support compact edge infrastructure. This trend is fueling large-scale investments in telecom infrastructure, boosting demand for high-capacity and energy-efficient optical technologies.
Advancements in Silicon Photonics and PICs
Innovations in silicon photonics and photonic integrated circuits (PICs) are transforming the optical interconnect landscape. These technologies enable miniaturization, lower power consumption, and higher integration density compared to traditional solutions. Their scalability makes them highly suitable for data-intensive applications, including high-performance computing and artificial intelligence workloads. As leading semiconductor and optics companies expand their portfolios in silicon photonics, the market is witnessing rapid adoption, particularly in board-level and chip-level interconnect applications, supporting long-term growth potential.
- For instance, GlobalFoundries announced a partnership with Ansys to advance its Fotonix™ platform, the industry’s first monolithic semiconductor foundry solution to combine RF and silicon photonics on a single chip.
Key Trends & Opportunities
Integration of Optical Interconnects in AI and HPC
Artificial intelligence and high-performance computing applications are increasingly relying on optical interconnects to overcome data bottlenecks. The demand for ultra-fast, low-latency connections is pushing adoption of transceivers, optical engines, and silicon photonics at board and chip levels. This trend presents a strong opportunity for vendors to design high-density, scalable solutions that cater to future AI-driven workloads.
- For instance, Ayar Labs introduced its TeraPHY™ optical I/O chiplets, which deliver 2.048 Tbps bandwidth per direction with 10x lower latency and 8x better power efficiency than conventional electrical I/O, enabling faster AI and HPC workloads.
Expansion of Hyperscale Data Centers
The rapid growth of hyperscale data centers across North America, Europe, and Asia-Pacific is creating a sustained demand for high-bandwidth optical interconnects. Operators are investing heavily in single-mode fiber and long-haul optical solutions to support rising internet traffic and digital services. This expansion presents significant opportunities for suppliers of transceivers, cable assemblies, and PIC-based interconnects tailored for energy-efficient, large-scale infrastructure.
- For instance, Ciena introduced its WaveRouter platform, combining coherent optics with scalable routing, aimed at hyperscale operators deploying high-bandwidth optical interconnects
Key Challenges
High Cost of Deployment
The widespread adoption of optical interconnects is hindered by high initial investment costs, particularly for long-haul and silicon photonics-based systems. The expense of advanced components, installation, and testing limits adoption among small and mid-sized enterprises. This cost barrier restrains market penetration in developing regions.
Complexity in Integration and Standardization
Integrating optical interconnects across diverse platforms poses challenges due to lack of universal standards. Compatibility issues between different vendors and products increase deployment complexity and slow adoption. Standardization efforts remain critical to ensure seamless interoperability, but progress has been slow, hindering global scalability.
Technical Limitations in Short-Reach Applications
While optical interconnects excel in long-distance and high-bandwidth transmission, their cost and complexity make them less viable for short-reach connections compared to copper solutions. This limitation affects adoption in smaller data centers and enterprise networks, where short-distance communication still dominates. Vendors must address this gap with cost-effective, simplified solutions.
Regional Analysis
North America
North America dominated the optical interconnect market with a 35% share in 2024, generating revenue of USD 4,840.86 million. The market is projected to reach USD 13,707.63 million by 2032, advancing at a CAGR of 14.0%. Growth is driven by strong demand from hyperscale data centers, early adoption of 5G networks, and increasing deployment of silicon photonics in the U.S. Canada and Mexico are also experiencing steady growth due to telecom upgrades. Favorable regulatory policies and investments in high-speed communication infrastructure further position North America as a global leader in optical interconnect adoption.
Europe
Europe accounted for 27% of the market in 2024, valued at USD 4,525.33 million, and is forecast to reach USD 12,230.59 million by 2032, expanding at a CAGR of 13.3%. The region benefits from strong demand in Germany, France, and the UK, with emphasis on energy-efficient data centers and high-speed connectivity for enterprise IT. Expansion of 5G services and rising adoption of silicon photonics in telecommunications and automotive industries are key growth drivers. Europe’s focus on sustainable infrastructure and regulatory compliance ensures steady market expansion across both Western and Eastern subregions.
Asia-Pacific
Asia-Pacific held 28% of the market in 2024, with revenue of USD 4,219.25 million, projected to grow to USD 13,084.04 million by 2032 at a CAGR of 15.2%, the fastest globally. Growth is fueled by rapid digitalization, large-scale data center construction, and government-backed telecom investments across China, Japan, South Korea, and India. China leads regional adoption due to extensive long-haul network deployments, while India and Southeast Asia are emerging growth hubs. Strong manufacturing capabilities in optical components, combined with rising AI and cloud computing demand, strengthen the region’s global competitive position.
Latin America
Latin America represented 5% of the global share in 2024, valued at USD 1,144.41 million, and is expected to reach USD 3,048.91 million by 2032, at a CAGR of 13.1%. Brazil and Mexico are leading adopters, driven by expanding telecom infrastructure, broadband penetration, and cloud service investments. The region is gradually shifting toward optical interconnect solutions for enterprise networking and data centers, though adoption remains slower compared to North America and Asia-Pacific. Growing demand for low-latency connections in urban areas presents significant opportunities for cost-effective and scalable interconnect technologies.
Middle East
The Middle East accounted for 3% market share in 2024, generating USD 789.48 million, and is projected to reach USD 2,086.56 million by 2032, growing at a CAGR of 13.0%. GCC countries, Israel, and Turkey are driving regional growth through smart city initiatives, digital transformation projects, and the rollout of 5G networks. High investments in metro and long-haul optical interconnects are boosting adoption, particularly in data center development. However, reliance on imports and high deployment costs remain challenges, though government-backed infrastructure expansion ensures steady growth potential in the coming years.
Africa
Africa captured a 2% share in 2024, with revenue of USD 399.63 million, and is expected to reach USD 1,098.41 million by 2032, advancing at a CAGR of 13.3%. South Africa, Nigeria, and Egypt are key contributors, with rising investments in digital infrastructure and growing internet penetration. While adoption is constrained by high costs and limited local manufacturing, increasing demand for broadband services and the gradual expansion of data centers are supporting market growth. International partnerships and government initiatives to improve connectivity are expected to strengthen the region’s long-term potential.
Market Segmentations:
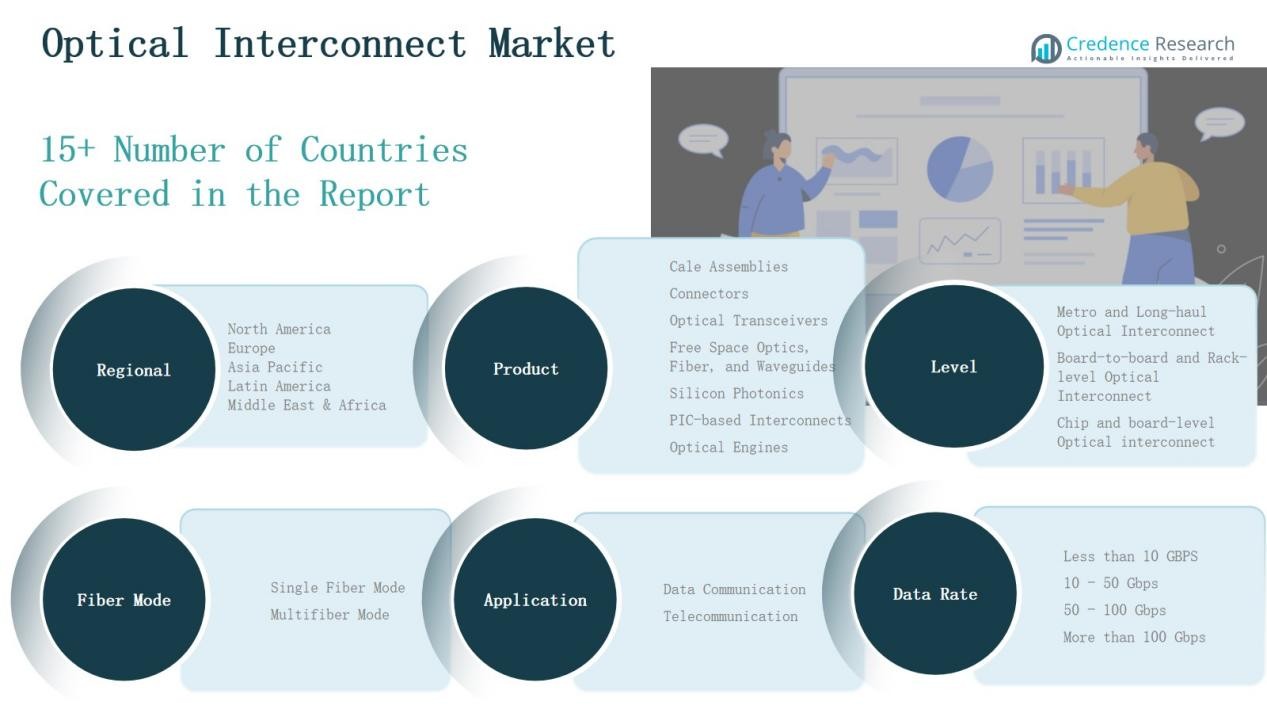
By Product
- Cable Assemblies
- Connectors
- Optical Transceivers
- Free Space Optics, Fiber, and Waveguides
- Silicon Photonics
- PIC-based Interconnects
- Optical Engines
By Level
- Metro and Long-haul Optical Interconnect
- Board-to-board and Rack-level Optical Interconnect
- Chip and Board-level Optical Interconnect
By Fiber Mode
- Single Fiber Mode
- Multi Fiber Mode
By Data Rate
- Less than 10 Gbps
- 10 – 50 Gbps
- 50 – 100 Gbps
- More than 100 Gbps
By Application
- Data Communication
- Telecommunication
By Region
- North America
- Europe
- Asia Pacific
- Latin America
- Middle East
- Africa
Competitive Landscape
The optical interconnect market is highly competitive, with global technology leaders and specialized vendors actively expanding their portfolios to address rising demand for high-speed, low-latency connectivity. Key players such as Amphenol Communications Solutions, Broadcom, Coherent Corp., Fujitsu Limited, InnoLight, Lumentum Operations LLC, Molex, NVIDIA Corporation, Sumitomo Electric Industries, and TE Connectivity dominate through strong product innovations in transceivers, cable assemblies, and silicon photonics. These companies invest heavily in R&D to enhance energy efficiency, integration density, and scalability of interconnect solutions for data centers, telecom, and high-performance computing. Strategic partnerships, acquisitions, and collaborations with cloud providers and telecom operators are central to strengthening market positions. North America and Asia-Pacific remain hotspots for innovation, with vendors focusing on hyperscale data centers and 5G rollouts. Meanwhile, emerging players are targeting niche applications such as chip-to-chip and photonic integrated circuit (PIC) interconnects, intensifying competition in specialized segments.
Shape Your Report to Specific Countries or Regions & Enjoy 30% Off!
Key Players
- Amphenol Communications Solutions
- Broadcom
- Coherent Corp.
- Fujitsu Limited
- InnoLight
- Lumentum Operations LLC
- Molex
- NVIDIA Corporation
- Sumitomo Electric Industries, Ltd.
- TE Connectivity
Recent Developments
- In August 2025, Amphenol agreed to acquire CommScope’s Connectivity & Cable Solutions unit for USD 10.5 billion, strengthening its fiber-optic interconnect and cable assembly portfolio.
- In July 2025, Smiths Interconnect entered a partnership under the EU-Canada security and defence agreement to supply fibre optic transceivers for space and defence applications, including their LightABLE™ and SpaceABLE® product lines.
- In September 2025, SENKO, BizLink, and ficonTEC announced a partnership at SEMICON Taiwan to pioneer advanced optical interconnect manufacturing processes and solutions.
- In June 2025, IonQ completed the acquisition of Lightsynq Technologies, incorporating over 20 patents related to photonic quantum networking for next-generation interconnect systems.
Report Coverage
The research report offers an in-depth analysis based on Product, Level, Fiber Mode, Data rate, Application and Region. It details leading market players, providing an overview of their business, product offerings, investments, revenue streams, and key applications. Additionally, the report includes insights into the competitive environment, SWOT analysis, current market trends, as well as the primary drivers and constraints. Furthermore, it discusses various factors that have driven market expansion in recent years. The report also explores market dynamics, regulatory scenarios, and technological advancements that are shaping the industry. It assesses the impact of external factors and global economic changes on market growth. Lastly, it provides strategic recommendations for new entrants and established companies to navigate the complexities of the market.
Future Outlook
- Demand for optical transceivers will continue rising with growth in hyperscale data centers.
- Silicon photonics adoption will accelerate as industries seek energy-efficient interconnect solutions.
- Metro and long-haul networks will expand with increasing global 5G and broadband penetration.
- AI and high-performance computing will drive the need for chip-to-chip optical interconnects.
- Single-mode fiber will remain dominant due to scalability and long-distance performance advantages.
- Multi-mode fiber will sustain demand in short-reach enterprise and data center environments.
- Board-to-board and rack-level interconnects will gain traction in cloud and enterprise networking.
- Strategic partnerships between optics suppliers and cloud providers will shape competitive dynamics.
- Emerging economies will witness rising adoption as digital infrastructure investments accelerate.
- Continuous innovation in photonic integrated circuits will enhance integration density and reduce costs.


