
Market Overview
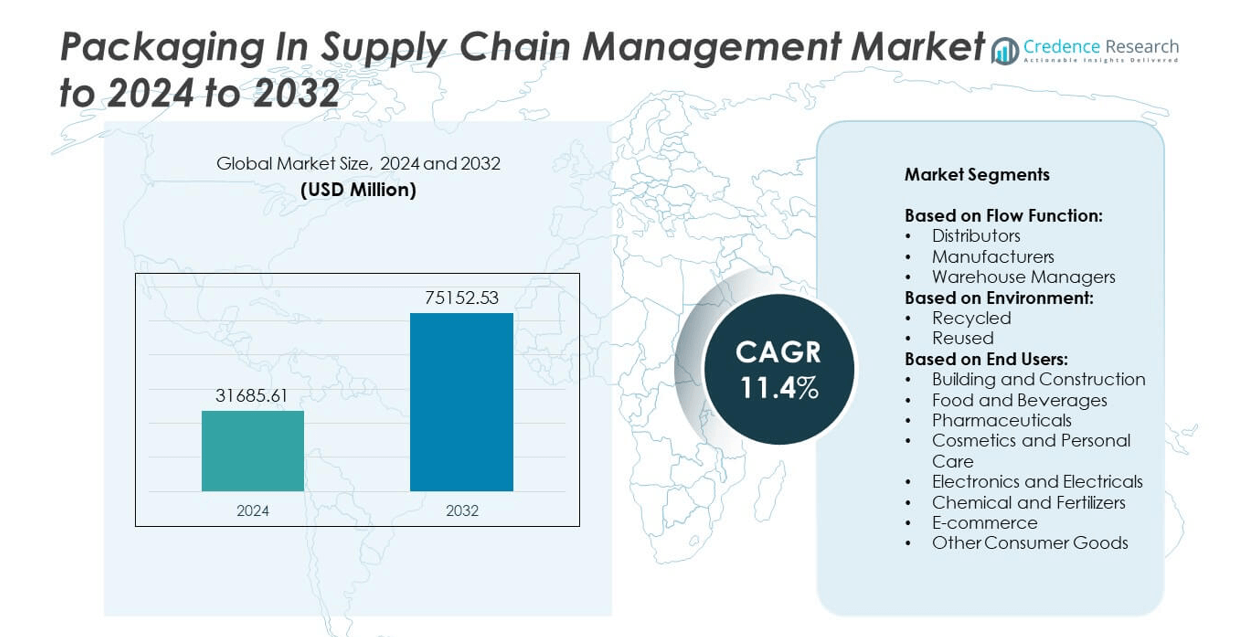
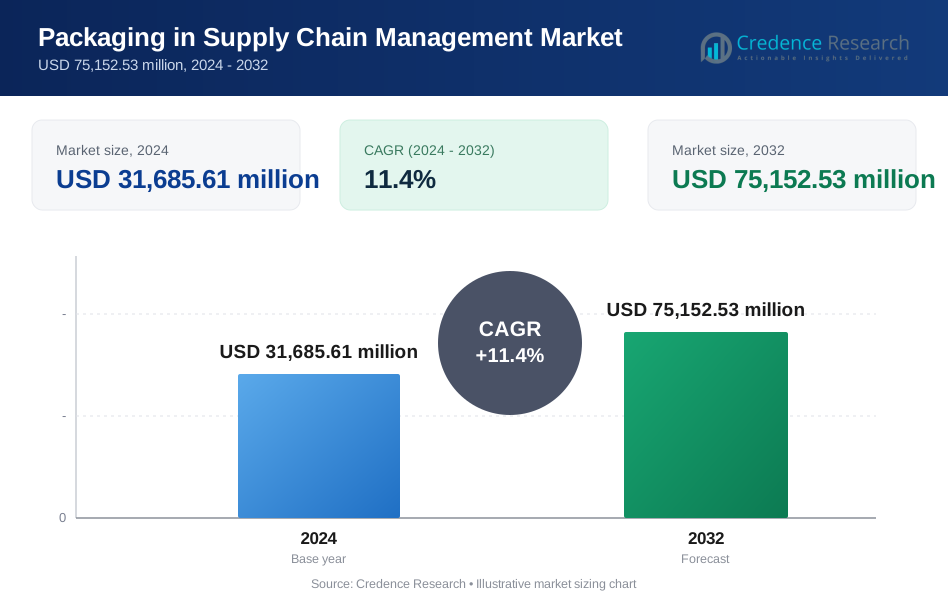
Packaging In Supply Chain Management Market size was valued USD 31,685.61 Million in 2024 and is anticipated to reach USD 75,152.53 Million by 2032, at a CAGR of 11.4% during the forecast period.
| REPORT ATTRIBUTE | DETAILS |
|---|---|
| Historical Period | 2020-2023 |
| Base Year | 2024 |
| Forecast Period | 2025-2032 |
| Packaging in Supply Chain Management Market Size 2024 | USD 31,685.61 Million |
| Packaging in Supply Chain Management Market, CAGR | 11.4% |
| Packaging in Supply Chain Management Market Size 2032 | USD 75,152.53 Million |
The packaging in supply chain management market is driven by key players such as Crown Holdings, Jumbo Bag Corporation, Oracle, Braid Logistics, Boxon USA, Elopak, BLT Flexitank Industrial Co. Ltd., Accenture, BAG Corp., Tetra Laval, Blue Yonder, and Trans Ocean Bulk Logistics. These companies focus on developing sustainable, reusable, and smart packaging solutions to meet rising demand from e-commerce, food, and pharmaceutical sectors. North America leads the global market with over 34% share in 2024, supported by advanced logistics infrastructure and strong adoption of automation. Europe follows with nearly 28% share, driven by strict sustainability regulations and circular economy initiatives.
Market Insights
- The market was valued at USD 31,685.61 million in 2024 and is projected to reach USD 75,152.53 million by 2032, growing at a CAGR of 11.4%.
- Growth is driven by rising e-commerce volumes, sustainability initiatives, and increasing adoption of automation in logistics and packaging operations.
- Smart and connected packaging, along with reusable and returnable packaging systems, are emerging as major trends shaping the market’s future.
- Competition is intense, with players focusing on innovations in lightweight, recyclable materials and investing in digital supply chain solutions to enhance efficiency.
- North America holds over 34% share, followed by Europe at nearly 28% and Asia-Pacific at 25%, while distributors lead the flow function segment with more than 45% share.
Market Segmentation Analysis:
By Flow Function
Distributors led the packaging in supply chain management market with over 45% share in 2024, supported by their critical role in ensuring smooth product movement across regional and global networks. Distributors demand cost-efficient, standardized, and durable packaging to minimize damage and streamline logistics. Growth is driven by rising e-commerce volumes and omnichannel retail models, which require faster turnaround and optimized packaging solutions. Manufacturers follow closely, adopting automated packaging lines to reduce labor costs and boost efficiency, while warehouse managers emphasize stackable and space-saving packaging for inventory management and last-mile delivery operations.
- For instance, in 2024, more than 70% of DHL Supply Chain's packaging operations in North America included some form of automation. The company operates more than 50 packaging sites globally that incorporate various forms of automation, which helps improve throughput and reduce manual handling.
By Environment
Recycled packaging dominated the market with nearly 60% share in 2024, driven by strict sustainability mandates and circular economy initiatives. Industries are rapidly adopting recycled materials to reduce carbon footprint and comply with extended producer responsibility (EPR) regulations. Growing government incentives and consumer preference for eco-friendly packaging further support this trend. Reused packaging is also gaining traction, particularly in closed-loop supply chains and B2B logistics where durable crates, pallets, and containers can be cycled multiple times, reducing cost per trip and waste generation while improving operational efficiency for high-volume manufacturers.
- For instance, CHEP (Brambles) saved an estimated 1.86 million metric tons of CO₂ equivalent emissions, 1.3 million metric tons of waste, and conserved 2.2 million cubic meters of timber (which equates to approximately 2.3 million trees) worldwide in fiscal year 2024 through its share-repair-reuse model.
By End Users
Food and beverages accounted for over 30% of the market share in 2024, driven by stringent hygiene regulations and the need for tamper-evident, sustainable, and temperature-controlled packaging. Rising demand for ready-to-eat meals, online grocery delivery, and export-grade packaging supports segment expansion. Pharmaceuticals represent a fast-growing sub-segment, fueled by global vaccine distribution and demand for serialization and track-and-trace solutions. Cosmetics, electronics, and e-commerce collectively boost demand for lightweight, protective packaging solutions, while chemical and fertilizer industries favor robust packaging for hazardous goods, adhering to international safety and compliance standards.
Market Overview
Rising E-commerce Expansion
Rising e-commerce expansion is the key growth driver for the packaging in supply chain management market, contributing significantly to overall demand. Increasing online retail volumes require durable, lightweight, and cost-efficient packaging to ensure product safety during long-distance transit. Companies are focusing on smart packaging designs that optimize space and reduce shipping costs. Growth is further supported by the expansion of last-mile delivery services, which depend on protective packaging to minimize damage and returns. This trend is particularly strong in Asia-Pacific and North America, where e-commerce penetration continues to rise rapidly across consumer goods sectors.
- For instance, Amcor purchased more than 254,000 metric tons of recycled material for its packaging in fiscal year 2024, which is a total figure that includes the 224,000 metric tons of post-consumer recycled (PCR) plastic.
Sustainability Initiatives and Regulations
Sustainability initiatives and regulations are driving major investments in eco-friendly packaging solutions. Governments and industry bodies are enforcing stricter compliance standards, such as EPR schemes, that encourage the use of recycled and biodegradable materials. Companies are shifting toward circular economy practices, adopting closed-loop packaging systems to reduce waste. This shift not only meets regulatory requirements but also aligns with consumer preferences for sustainable brands, boosting brand image and reducing environmental impact.
- For instance, Sealed Air’s CRYOVAC® brand installed its 4,000th rotary vacuum chamber system in 2025 at Cargill’s facility in Dodge City, Kansas.
Advances in Automation and Digitalization
Advances in automation and digitalization in packaging operations accelerate market growth by improving efficiency and reducing costs. Automated packaging systems, including robotics and AI-driven sorting, allow faster throughput and minimize manual errors. Digital tracking solutions enhance supply chain visibility, enabling better inventory control and just-in-time operations. These innovations reduce downtime and optimize space utilization in warehouses, making them attractive to manufacturers and logistics companies aiming for higher productivity and cost savings.
Key Trends & Opportunities
Adoption of Smart and Connected Packaging
Adoption of smart and connected packaging is a major trend, providing opportunities for better supply chain visibility. Technologies such as RFID tags, QR codes, and IoT sensors are being integrated into packaging to monitor product location, condition, and authenticity. This innovation reduces losses, improves compliance with regulations, and enhances customer trust. The trend is particularly valuable in pharmaceuticals, food, and electronics sectors, where traceability and safety are crucial. Companies are leveraging data collected from connected packaging to optimize logistics and enhance demand forecasting.
- For instance, Gerresheimer expanded its Peachtree City site by around 18,000 m² (≈194,000 sq ft) in 2024, adding cleanroom production space and capacity for assembly lines.
Growth of Reusable and Returnable Packaging Solutions
Growth of reusable and returnable packaging solutions is a key opportunity driven by cost savings and sustainability goals. Industries such as automotive, electronics, and FMCG are adopting durable containers, pallets, and totes that can be reused across multiple supply cycles. This approach significantly lowers per-shipment packaging costs, reduces waste, and supports carbon neutrality targets. Logistics providers are also investing in reverse logistics infrastructure to manage packaging returns efficiently, creating new business models and value-added services for supply chain stakeholders.
- For instance, Amcor conducted 1,827 life cycle assessments in 2024 as part of its sustainability and product design process.
Key Challenges
High Implementation Costs
High implementation costs remain a major challenge, especially for small and medium enterprises. Investments in automated systems, smart packaging technologies, and sustainable materials require significant capital expenditure. These costs can be prohibitive for companies with limited budgets, slowing the adoption of advanced packaging solutions. Additionally, integrating new systems with existing infrastructure often involves complex adjustments, increasing the financial and operational burden during transition phases.
Fluctuating Raw Material Prices
Fluctuating raw material prices pose another challenge for the market. Prices of key packaging materials like paperboard, plastics, and metals often fluctuate due to supply chain disruptions, global trade tensions, and energy costs. This volatility impacts profit margins for packaging manufacturers and logistics providers. Companies are forced to absorb higher input costs or pass them on to customers, which can reduce competitiveness and demand, especially in price-sensitive markets.
Regional Analysis
North America
North America held the largest share of the packaging in supply chain management market with over 34% in 2024. Strong presence of e-commerce giants, advanced logistics infrastructure, and high adoption of automation drive demand. Companies are investing in smart packaging solutions and sustainable materials to meet regulatory requirements and consumer expectations. Growth is further supported by the expansion of retail distribution networks and rising demand for temperature-controlled packaging in food and pharmaceutical sectors. The U.S. leads the region, followed by Canada, benefiting from robust investments in digital supply chain technologies and innovation in reusable packaging systems.
Europe
Europe accounted for nearly 28% of the market share in 2024, supported by strict environmental regulations and early adoption of circular economy practices. Manufacturers and distributors focus on using recyclable and reusable packaging materials to comply with EU sustainability goals. Growing e-commerce penetration in countries like Germany, the U.K., and France is boosting demand for lightweight, cost-efficient packaging. Investment in automation and smart labeling technologies enhances supply chain visibility and efficiency. Rising demand for eco-friendly solutions and government-backed green initiatives continue to shape the regional market, encouraging innovation and adoption of closed-loop packaging systems.
Asia-Pacific
Asia-Pacific captured around 25% of the market share in 2024 and is the fastest-growing region. Rapid industrialization, rising e-commerce activities, and expanding manufacturing sectors in China, India, and Southeast Asia drive market growth. Increasing consumer demand for convenient and sustainable packaging fuels innovation in design and materials. Government initiatives to promote recycling and reduce plastic waste are pushing companies toward eco-friendly solutions. Investments in logistics infrastructure and adoption of automation enhance efficiency across the supply chain. The region benefits from large-scale production capacities, cost advantages, and growing collaborations between packaging providers and major retailers.
Latin America
Latin America represented approximately 8% of the market share in 2024, driven by the growing retail sector and rising e-commerce penetration. Countries such as Brazil and Mexico are witnessing increased investments in packaging infrastructure and logistics modernization. Demand is rising for cost-effective and durable packaging solutions to ensure product safety during long transportation routes. The food and beverage sector remains a major end user, with growing focus on sustainability and recycling programs. Regional growth is supported by improving trade agreements, which boost exports and create demand for standardized, export-compliant packaging materials and systems.
Middle East & Africa
The Middle East & Africa accounted for nearly 5% of the market share in 2024, with steady growth driven by expanding construction, retail, and food sectors. The region is seeing increasing adoption of modern logistics practices and warehouse automation, creating opportunities for efficient packaging solutions. Demand for durable and reusable packaging is growing in export-driven industries, particularly chemicals and fertilizers. Investments in smart city projects and e-commerce development are also contributing to market expansion. However, the market faces challenges such as limited recycling infrastructure, which is slowly improving with government-led sustainability initiatives and private sector participation.
Market Segmentations:
By Flow Function:
- Distributors
- Manufacturers
- Warehouse Managers
By Environment:
- Recycled
- Reused
By End Users:
- Building and Construction
- Food and Beverages
- Pharmaceuticals
- Cosmetics and Personal Care
- Electronics and Electricals
- Chemical and Fertilizers
- E-commerce
- Other Consumer Goods
By Geography:
- North America
- U.S.
- Canada
- Mexico
- Europe
- Germany
- France
- U.K.
- Italy
- Spain
- Rest of Europe
- Asia Pacific
- China
- Japan
- India
- South Korea
- South-east Asia
- Rest of Asia Pacific
- Latin America
- Brazil
- Argentina
- Rest of Latin America
- Middle East & Africa
- GCC Countries
- South Africa
- Rest of the Middle East and Africa
Competitive Landscape
The competitive landscape of the packaging in supply chain management market features leading players such as Crown Holdings, Jumbo Bag Corporation, Oracle, Braid Logistics, Boxon USA, Elopak, BLT Flexitank Industrial Co. Ltd., Accenture, BAG Corp., Tetra Laval, Blue Yonder, and Trans Ocean Bulk Logistics. The market is highly competitive, with companies focusing on innovation, automation, and sustainability to gain an edge. Strategies include developing lightweight, recyclable, and reusable packaging to reduce environmental impact and comply with regulations. Many players are investing in digital technologies like IoT-enabled packaging, track-and-trace solutions, and AI-driven analytics to improve supply chain visibility. Partnerships with logistics providers and e-commerce platforms are increasing to optimize distribution efficiency. Additionally, global players are expanding production capacities and establishing local facilities to serve growing demand in emerging markets. Mergers and acquisitions remain a key approach for strengthening portfolios, while collaborations with technology firms are enhancing automation and smart packaging capabilities.
Key Player Analysis
- Crown Holdings
- Jumbo Bag Corporation
- Oracle
- Braid Logistics
- Boxon USA
- Elopak
- BLT Flexitank Industrial Co. Ltd.
- Accenture
- BAG Corp.
- Tetra Laval
- Blue Yonder
- Trans Ocean Bulk Logistics
Recent Developments
- In 2025, Accenture, global multinational professional services company signed agreement to buy Staufen AG, a management consulting company with headquarters in Germany, together with its affiliates. Specifically, for clients in discrete manufacturing industries including automotive, aerospace and military, industrial goods, and medical equipment, the acquisition will increase Accenture's capacity to promote operational excellence and competitiveness in manufacturing and supply chains.
- In 2025, Oracle rolled out new AI-powered tools for logistics and order management. These tools enhance shipment visibility and refine transportation choices, both of which are directly linked to optimizing packaging for efficiency and cost.
- In 2025, Blue Yonder company delivered its latest warehouse management solution, built on a native cloud platform. This improves efficiency and speed through AI and ML, allowing for quicker and more precise packaging and fulfillment operations with no downtime.
Report Coverage
The research report offers an in-depth analysis based on Flow Function, Environment, End-User and Geography. It details leading market players, providing an overview of their business, product offerings, investments, revenue streams, and key applications. Additionally, the report includes insights into the competitive environment, SWOT analysis, current market trends, as well as the primary drivers and constraints. Furthermore, it discusses various factors that have driven market expansion in recent years. The report also explores market dynamics, regulatory scenarios, and technological advancements that are shaping the industry. It assesses the impact of external factors and global economic changes on market growth. Lastly, it provides strategic recommendations for new entrants and established companies to navigate the complexities of the market.
Future Outlook
- The market will witness strong growth driven by rising e-commerce and global trade.
- Automation and robotics adoption will improve efficiency and reduce operational costs.
- Demand for eco-friendly and recyclable packaging materials will continue to rise.
- Smart packaging with IoT and RFID technology will enhance supply chain visibility.
- Companies will invest in closed-loop and reusable packaging systems for sustainability.
- Emerging markets will see rapid growth due to expanding retail and manufacturing sectors.
- Digital supply chain platforms will gain traction to optimize inventory and logistics.
- Strategic partnerships between packaging and logistics providers will increase.
- Regulatory compliance will push innovation in material development and waste reduction.
- Investment in localized production and distribution hubs will improve responsiveness and reduce lead times.
Request a Free Sample
Fill in your details and we'll send you a free sample report.
- Sample data tables & charts
- Research methodology
Need a Custom Version of This Report?
Tailor the scope, geography, or segments to your exact requirements.
- Custom geography or segment scope
- Direct access to our analyst team
Frequently Asked Questions
What is the current market size for Packaging In Supply Chain Management Market, and what is its projected size in 2032?
At what Compound Annual Growth Rate is the Packaging In Supply Chain Management Market projected to grow between 2025 and 2032?
Which Packaging In Supply Chain Management Market segment held the largest share in 2024?
What are the primary factors fueling the growth of the Packaging In Supply Chain Management Market?
Who are the leading companies in the Packaging In Supply Chain Management Market?
Table of Content
Chapter 1. Report Introduction
- 1.1 Report Description & Purpose
- 1.1.1 Report Title & Market Definition
- 1.1.2 Unique Selling Propositions (USP) & Key Differentiators
- 1.1.3 Value Proposition for Stakeholders
- 1.2 Research Objectives
- 1.2.1 Market Sizing Objectives (Volume & Revenue)
- 1.2.2 Segmentation Objectives
- 1.2.3 Competitive Intelligence Objectives
- 1.2.4 Forecast & Scenario Objectives
- 1.3 Report Scope
- 1.3.1 Packaging in Supply Chain Management Scope – Types & Subtypes Covered
- 1.3.2 Geographic Scope – Regions & Countries Covered
- 1.3.3 Historical Period, Base Year & Forecast Period (2024; forecast to 2032)
- 1.3.4 Inclusions & Exclusions
- 1.4 HS Code & Classification Framework
- 1.5 Currency, Units & Pricing Basis
- 1.6 Target Stakeholders
- 1.7 Limitations & Assumptions
Chapter 2. Executive Summary
- 2.1 Global Packaging in Supply Chain Management Market Snapshot
- 2.1.1 Market Size – Historical (2024) & Forecast (2024-2032) (2024: USD 31,685.61 million → 2032: USD 75,152.53 million)
- 2.1.2 Volume & Revenue – Global Totals
- 2.1.3 Key Market Highlights – Top Five Facts
- 2.2 Packaging in Supply Chain Management Market Segmentation Snapshot
- 2.2.1 Market Split by Region – 2024 vs. 2032
- 2.3 Competitive Snapshot
- 2.3.1 Top 10 Players by Revenue Share – 2024
- 2.3.2 Top 10 Players by Volume Share – 2024
- 2.3.3 Recent Strategic Developments (18-Month Summary)
- 2.4 Key Investment Highlights & Strategic Conclusions
Chapter 3. Packaging in Supply Chain Management Market Dynamics & Industry Analysis
- 3.1 Market Overview & Context
- 3.1.1 Packaging in Supply Chain Management Market Position in the Broader Automotive Value Chain
- 3.1.2 OEM vs. Replacement Market Dynamics
- 3.1.3 Market Maturity & Development Stage by Region
- 3.2 Packaging in Supply Chain Management Market Drivers
- 3.3 Packaging in Supply Chain Management Market Restraints & Challenges
- 3.4 Packaging in Supply Chain Management Market Opportunities
- 3.5 Porter's Five Forces Analysis
- 3.5.1 Threat of New Entrants
- 3.5.2 Bargaining Power of Suppliers
- 3.5.3 Bargaining Power of Buyers
- 3.5.4 Threat of Substitutes
- 3.5.5 Competitive Rivalry – Intensity Assessment
- 3.6 Packaging in Supply Chain Management Value Chain Analysis
- 3.6.1 Upstream – Raw Material/Input Suppliers
- 3.6.1.1 Raw Material/Input 1
- 3.6.1.2 Raw Material/Input 2
- 3.6.1.3 Raw Material/Input 3
- 3.6.2 Midstream – Production/Manufacturing/Service Delivery
- 3.6.2.1 Production/Process Overview
- 3.6.2.2 Key Facility Locations & Capacity by Manufacturer
- 3.6.3 Downstream – Distribution & End Consumer
- 3.6.3.1 Primary Channel – B2B/OEM
- 3.6.3.2 Secondary Channels – Dealer, Retail, Online, Direct
- 3.6.4 Value Chain Profitability Analysis
- 3.6.1 Upstream – Raw Material/Input Suppliers
- 3.7 PESTEL Analysis
- 3.7.1 Political Factors
- 3.7.2 Economic Factors
- 3.7.3 Social Factors
- 3.7.4 Technological Factors
- 3.7.5 Environmental Factors
- 3.7.6 Legal Factors
- 3.8 Packaging in Supply Chain Management Supply Chain Analysis
- 3.8.1 Raw Material/Input Supply Risk Assessment
- 3.8.2 Manufacturing Concentration Risk (Geographic Exposure)
- 3.8.3 Trade Disruption Impact Analysis
- 3.9 Regulatory & Policy Landscape
Note: The regulatory and policy landscape section covers regulations based on their applicability to the market, Packaging in Supply Chain Management category, geography, and scope of the study. Only regulatory frameworks with a material impact on operations, compliance, trade, sustainability, or market access are analyzed in detail.
Chapter 4. Key Investment Pockets & Opportunity Analysis
- 4.1 Packaging in Supply Chain Management Market Attractiveness Analysis
- 4.1.1 By Region – Investment Attractiveness Matrix (Volume × CAGR)
- 4.2 Absolute Revenue Growth Opportunity
- 4.2.1 By Region – Absolute USD Growth Through 2032
- 4.3 Incremental Volume Opportunity
- 4.3.1 By Region – Incremental Volume Through 2032
- 4.3.2 Segment – Incremental Volume
- 4.4 Emerging Submarket Opportunity Deep Dive (Subject to Applicability)
- 4.5 Emerging Market Opportunity Scorecards
- 4.5.1 United States
- 4.5.2 Europe
- 4.5.3 Asia
- 4.5.4 Middle East & Africa
Note: Emerging Market Opportunity Scorecards will be included based on relevance and strategic importance. Regions listed are indicative and may vary depending on data availability and market dynamics.
Chapter 5. Packaging in Supply Chain Management Import-Export Analysis & Trade Flows
- 5.1 Global Trade Overview
- 5.1.1 Global Export Value by Country (2024)
- 5.1.2 Global Export Volume by Country (2024)
- 5.1.3 Global Import Value by Country (2024)
- 5.1.4 Global Import Volume by Country (2024)
- 5.1.5 Net Trade Balance by Country (2024)
- 5.2 Export Analysis – Segment
- 5.2.1 Type 1 (HS Code)
- 5.2.2 Type 2 (HS Code)
- 5.2.3 Type 3 (HS Code)
- 5.2.4 Type 4 (HS Code)
- 5.2.5 Type 5 (HS Code)
- 5.3 Import Analysis – Segment
- 5.3.1 Type 1 (HS Code)
- 5.3.2 Type 2 (HS Code)
- 5.3.3 Type 3 (HS Code)
- 5.3.4 Type 4 (HS Code)
- 5.3.5 Type 5 (HS Code)
- 5.4 Average Unit Trade Prices
- 5.4.1 Average Export Price – Segment & Country
- 5.4.2 Average Import Price – Segment & Source Country
- 5.4.3 Price Trends (2024)
- 5.5 Key Trade Route Analysis
- 5.5.1 Trade Route 1
- 5.5.2 Trade Route 2
- 5.5.3 Trade Route 3
- 5.5.4 Trade Route 4
- 5.5.5 Trade Route 5
- 5.6 Trade Policy Impact Assessment
- 5.6.1 US Anti-Dumping & Section 301 Tariffs
- 5.6.2 EU Customs Union Impact
- 5.6.3 Major Free Trade Agreements
- 5.6.4 USMCA Rules of Origin
Note: Trade policy analysis will be included only where relevant to the Packaging in Supply Chain Management market.
Chapter 6. Competitive Landscape & Company Benchmarking
- 6.1 Packaging in Supply Chain Management Market Concentration & Structure
- 6.1.1 Herfindahl-Hirschman Index (HHI) – vs. 2024
- 6.1.2 Tier 1, Tier 2 & Tier 3 Market Structure
- 6.1.3 Global, Regional & Local Player Dynamics
- 6.2 Packaging in Supply Chain Management Market Share Analysis – 2024
- 6.2.1 Global Revenue Share by Company
- 6.2.2 Global Volume Share by Company
- 6.2.3 Regional Revenue Share
- 6.2.4 Market Share Evolution ( vs. 2024)
- 6.2.5 OEM Segment Share by Company
- 6.2.6 Replacement Segment Share by Company
- 6.3 Production/Delivery Capacity & Facility Analysis
- 6.3.1 Global Installed Capacity
- 6.3.2 Capacity Utilization Rates
- 6.3.3 Production/Output Volume
- 6.3.4 Facility Locations & Capacity Map
- 6.3.5 Planned Capacity Additions
- 6.4 Packaging in Supply Chain Management Competitive Benchmarking Matrix
- 6.4.1 Revenue, Volume, CAGR & Profitability Comparison
- 6.4.2 Channel Revenue Mix
- 6.4.3 Geographic Revenue Exposure
- 6.4.4 R&D Intensity
- 6.4.5 Sustainability Maturity
- 6.5 Strategic Developments in Packaging in Supply Chain Management (Last 24 Months)
- 6.5.1 Mergers, Acquisitions & Divestments
- 6.5.2 New Packaging in Supply Chain Management Launches
- 6.5.3 Facility Expansions
- 6.5.4 Strategic Alliances, Joint Ventures & Partnerships
- 6.5.5 Distribution Expansion & Market Entry
- 6.5.6 Sustainability & ESG Initiatives
- 6.6 Competitive Strategy Mapping
- 6.6.1 Leader, Challenger, Follower & Niche Classification
- 6.6.2 Pricing Strategy Comparison
- 6.6.3 Channel Strategy Matrix
Note: Strategic developments are included based on their materiality and the availability of reliable information.
Chapter 7. Global Packaging in Supply Chain Management Market – By Distribution Channel
- 7.1 Segment Overview
- 7.1.1 Volume & Revenue Split by Channel (2024 & 2032)
- 7.1.2 Channel Mix Evolution (2024-2032)
Chapter 8. Regional Market Analysis – Global Overview
- 8.1 Global Regional Overview
- 8.1.1 Regional Volume Share
- 8.1.2 Regional Revenue Share
- 8.1.3 Regional Volume by Region
- 8.1.4 Regional Revenue by Region
- 8.1.5 Regional Forecast Through 2032
- 8.2 Cross-Regional Segment Analysis
- 8.2.1 By Distribution Channel
- 8.2.2 By Brand/Price Tier
Chapter 9. North America Packaging in Supply Chain Management Market
- 9.1 United States
- 9.2 Canada
- 9.3 Mexico
Chapter 10. Europe Packaging in Supply Chain Management Market
- 10.1 Germany
- 10.2 France
- 10.3 Italy
- 10.4 United Kingdom
- 10.5 Spain
- 10.6 Poland
- 10.7 Russia
- 10.8 Netherlands
- 10.9 Belgium
- 10.10 Sweden
- 10.11 Denmark
- 10.12 Norway
- 10.13 Rest of Europe
Chapter 11. Asia Pacific Packaging in Supply Chain Management Market
- 11.1 China
- 11.2 India
- 11.3 Japan
- 11.4 South Korea
- 11.5 Thailand
- 11.6 Indonesia
- 11.7 Vietnam
- 11.8 Malaysia
- 11.9 Australia
- 11.10 Rest of Asia Pacific
Chapter 12. Latin America Packaging in Supply Chain Management Market
- 12.1 Brazil
- 12.2 Argentina
- 12.3 Colombia
- 12.4 Chile
- 12.5 Rest of Latin America
Chapter 13. Middle East Packaging in Supply Chain Management Market
- 13.1 Saudi Arabia
- 13.2 United Arab Emirates
- 13.3 Turkey
- 13.4 Israel
- 13.5 Iran
- 13.6 Rest of the Middle East
Chapter 14. Africa Packaging in Supply Chain Management Market
- 14.1 South Africa
- 14.2 Egypt
- 14.3 Nigeria
- 14.4 Morocco
- 14.5 Rest of Africa
Chapter 15. Packaging in Supply Chain Management Company Profiles
- 15.1 [Company 01]
- 15.1.1 Company Overview
- 15.1.2 Key Management Personnel
- 15.1.3 Products & Services Portfolio
- 15.1.4 Financial Performance
- 15.1.5 Key Market Focus & Geographic Presence
- 15.1.6 Recent Developments & Strategic Initiatives
Note: The company profile list is preliminary and may change based on research findings, market developments, data availability, and client requirements.
Chapter 16. Appendices
- Appendix A – List of Abbreviations & Acronyms
- Appendix B – Industry Classification Code Reference – Full Series
- Appendix C – Production & Capacity Data Tables
- Appendix D – End-Use & Demand Base Tables
- Appendix E – Consumption & Replacement Rate Assumptions
- Appendix F – ASP Reference Tables
- Appendix G – Manufacturing & Facility Database
- Appendix H – Import-Export Data Tables
- Appendix I – Regulatory Summary Tables
- Appendix J – Primary Research Participant List (Anonymized)
- Appendix K – Primary Research Questionnaire Framework
- Appendix L – Data Sources & Bibliography
- Appendix M – Market Size Divergence & Source Comparison
Chapter 17. Research Methodology
- 17.1 Research Framework & Philosophy
- 17.2 Secondary Research – Sources, Hierarchy & Data Extraction
- 17.3 Data Modeling – Bottom-Up & Top-Down Market Sizing
- 17.4 Primary Research – Stakeholder Framework, LOI & Sample Sizes
- 17.5 Forecast Methodology – Regression, Scenario & Sensitivity Analysis
- 17.6 Quality Control – Four-Layer Validation Framework
- 17.7 Limitations & Standard Assumptions
- 17.8 Disclaimer
