
Market Overview
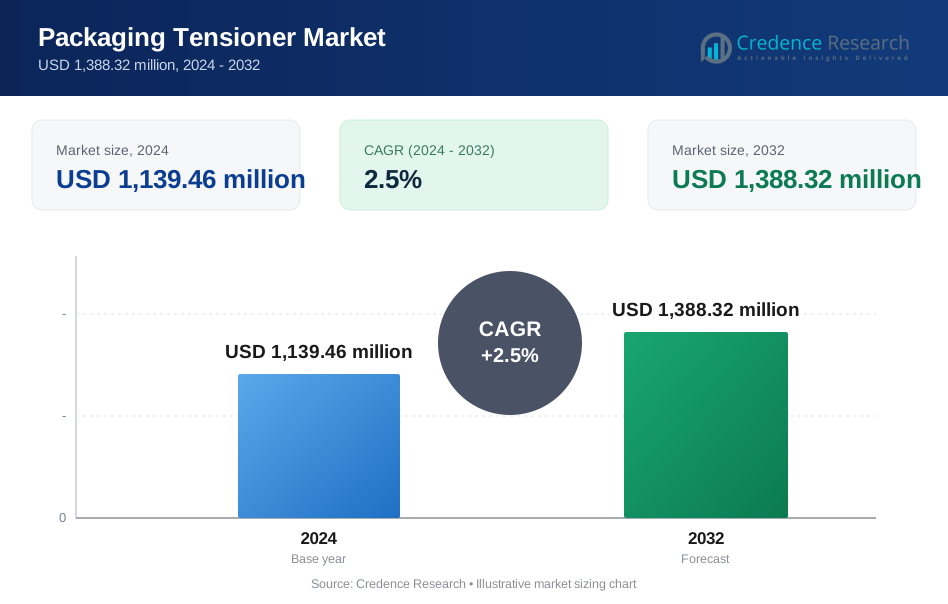
The global Packaging Tensioner market was valued at USD 1,139.46 million in 2024 and is projected to reach USD 1,388.32 million by 2032, growing at a CAGR of 2.5% during the forecast period.
| REPORT ATTRIBUTE | DETAILS |
|---|---|
| Historical Period | 2020-2023 |
| Base Year | 2024 |
| Forecast Period | 2025-2032 |
| Packaging Tensioner Market Size 2024 | USD 1,139.46 Million |
| Packaging Tensioner Market, CAGR | 2.5% |
| Packaging Tensioner Market Size 2032 | USD 1,388.32 Million |
The packaging tensioner market is led by major players such as FROMM Packaging Systems, Dynaric, Inc., North Shore Strapping Inc., Samuel Packaging Systems Group, Transpak Equipment Corp, and Tiger Pack, Inc. who focus on delivering reliable manual and battery-operated tensioners for diverse industries. These companies emphasize ergonomic designs, compatibility with multiple strap materials, and automation-ready features to support high-throughput operations. Asia Pacific led the market with over 35% share in 2024, driven by strong manufacturing output and growing e-commerce. North America accounted for over 30% share, supported by advanced packaging infrastructure and rapid adoption of automated tensioning solutions.
 Market Insights
- The packaging tensioner market was valued at USD 1,139.46 million in 2024 and is projected to reach USD 1,388.32 million by 2032, growing at a CAGR of 2.5% during the forecast period.
- Growth is driven by rising demand from e-commerce, logistics, and food & beverage sectors requiring consistent strapping for safe transit and secure packaging.
- Key trends include growing adoption of battery-operated tensioners for faster operations, ergonomic designs for reduced fatigue, and tools compatible with sustainable strapping materials.
- The market is competitive with FROMM Packaging Systems, Dynaric, Inc., Samuel Packaging Systems Group, Transpak Equipment Corp, and Tiger Pack, Inc. focusing on product innovation and global distribution networks.
- Asia Pacific led with over 35% share, followed by North America with over 30%, driven by high manufacturing output and packaging automation. Food & beverage held over 35% of demand, with pharmaceuticals and chemicals emerging as key growth sectors.
Market Segmentation Analysis:
By Material
Plastic tensioners dominated the market with over 40% share in 2024, driven by their lightweight, cost-effective design and compatibility with polypropylene and polyester strapping. Plastic tensioners are widely used in industries prioritizing portability and ease of handling, such as food & beverages and light manufacturing. Polyester tensioners follow, supported by demand in heavy-duty applications requiring higher tension strength. Metal tensioners retain relevance in industrial packaging for steel strapping, while polypropylene tensioners remain preferred for lower-cost, medium-duty bundling. The trend toward eco-friendly plastic materials is further fueling adoption across e-commerce and logistics sectors.
- For instance, Yang Bey Industrial Co., Ltd. (YBICO) manufactures a manual P330 plastic strapping tensioner that is compatible with 12–19 mm (1/2" to 3/4") PP and PET straps. The tool is engineered with oilless bearings in the handle and base to reduce friction and increase its durability, ensuring reliable performance
By Operation
Manual tensioners accounted for over 55% market share in 2024, supported by their affordability and ease of use in small- and medium-scale operations. They remain popular in warehouses, retail distribution, and light industrial applications where low-volume strapping is required. Battery-operated tensioners are gaining traction due to rising automation, improved speed, and reduced operator fatigue, making them ideal for high-throughput environments. Manufacturers are focusing on ergonomics and lightweight designs to improve operator efficiency. The shift toward automated packaging solutions is expected to gradually increase the adoption of battery-powered tensioners over the forecast period.
- For instance, Sal-Tech Easy Packaging offers battery-operated tensioner models, such as the STEP Kronos H-46, which are designed for robust performance in industrial and logistics applications.
By End-use
The food & beverage segment held the largest share with over 35% of the market in 2024, driven by strict safety standards and high packaging volumes for perishable goods. Pharmaceuticals follow as a key growth sector, relying on precise tensioning for secure transit of medical supplies and equipment. The chemicals industry uses tensioners to ensure secure containment of hazardous materials, while the building & construction sector demands high-strength tensioning for heavy materials and bulk shipments. Growth in online food delivery and global trade is reinforcing demand for reliable tensioning solutions across all major end-use industries.
Key Growth Drivers
Rising Demand from E-commerce and Logistics
The expansion of e-commerce and global logistics is a major driver for the packaging tensioner market. Secure and consistent strapping is crucial for preventing damage during transit and ensuring product integrity. The rise of same-day and express delivery services is pushing companies to adopt reliable manual and battery-operated tensioners. Warehousing and distribution centers are investing in efficient packaging equipment to handle increasing shipment volumes, boosting the demand for tensioners across plastic, polyester, and metal strapping applications.
- For instance, FROMM Packaging Systems introduced its P329S battery-powered tensioner, which delivers up to 4,000 N of adjustable strap tension. The tool was designed for high-duty applications and can be used to secure pallets in a variety of environments.
Growth in Food and Beverage Industry
The food and beverage sector, holding over 35% share, is a key contributor to market growth. High packaging volumes for perishable goods require secure, hygienic, and efficient strapping solutions. The industry is adopting tensioners that are easy to sanitize and compatible with plastic and polyester straps. Increasing demand for packaged food, beverages, and ready-to-eat products is driving continuous investment in packaging equipment, creating steady demand for tensioners in both manual and battery-operated formats.
- For instance, FROMM Packaging Systems rolled out the P331 battery-operated strapping tool, which features durable construction and a brushless motor for less maintenance. Designed for heavy-duty applications, the P331 delivers up to 7,000 N (about 1,575 lbs) of adjustable tension force, with a lithium-ion battery facilitating up to 370 strap cycles per charge for continuous use in busy facilities, including food processing plants.
Adoption of Automated Packaging Solutions
Rising focus on operational efficiency is encouraging manufacturers to adopt battery-operated and semi-automatic tensioners. These tools reduce manual labor, improve strapping consistency, and speed up packaging processes. Battery-operated tensioners are particularly suited for high-volume operations in pharmaceuticals, chemicals, and construction materials. Manufacturers are launching lightweight, ergonomically designed models to reduce operator fatigue and improve workplace safety. This adoption of automated and portable solutions is a key growth driver across industrial and commercial packaging operations.
Key Trends & Opportunities
Shift Toward Lightweight and Ergonomic Designs
Manufacturers are focusing on developing tensioners with improved ergonomics, reduced weight, and better grip to enhance operator comfort. This trend is gaining traction in industries with continuous packaging operations, such as logistics and distribution centers. Lightweight designs reduce fatigue and increase efficiency, while adjustable tension controls offer precision for different strap types. The growing preference for user-friendly tools creates opportunities for manufacturers to expand product portfolios and meet demand from small and medium-sized enterprises.
- For instance, Transpak Equipment Corp. offers the H-46 battery-powered strapping tool, which weighs around 4.3–4.4 kg and provides an ergonomic, mobile strapping solution. Transpak also manufactures larger, semi-automatic pallet strapping machines like the TP-502MV Genesis Verti, which weighs 93 kg and straps pallets vertically for lower packing frequency operations.
Integration with Sustainable Packaging Materials
The shift toward eco-friendly packaging is creating opportunities for tensioners compatible with recyclable and biodegradable strapping materials. Companies are focusing on developing tools that work efficiently with PET and paper-based straps without compromising strength. Sustainability initiatives in food, pharmaceuticals, and retail sectors are encouraging adoption of such solutions. This trend aligns with global packaging waste reduction targets and supports growth for tensioners designed for environmentally responsible packaging systems.
- For instance, the former Dynaric, Inc. was acquired by Greenbridge in 2019 and rebranded under the Greenbridge name in 2021. Greenbridge offers a range of battery-powered tools for use with PET straps, and the transition from virgin materials like PP to recycled PET is a common goal for companies seeking more sustainable packaging.
Key Challenges
High Cost of Battery-Operated Tensioners
Battery-operated tensioners, while efficient, involve higher upfront investment compared to manual models. This cost can be a barrier for small-scale operations with limited budgets, slowing adoption. Replacement of batteries and regular maintenance add to operational expenses. Manufacturers must focus on affordable solutions and leasing options to increase market penetration in cost-sensitive regions.
Maintenance and Durability Issues
Frequent use of tensioners in high-volume applications leads to wear and tear, impacting tool life and performance. Poorly maintained tools can result in inconsistent strap tension, leading to product damage or package failure. Ensuring proper maintenance, availability of spare parts, and operator training remain challenges for end-users. Manufacturers are investing in durable materials and offering after-sales support to address these concerns and improve customer satisfaction.
Regional Analysis
North America
North America held over 30% share of the packaging tensioner market in 2024, driven by strong demand from e-commerce, logistics, and food processing industries. The U.S. leads the region with advanced packaging infrastructure and adoption of automated tensioning solutions in warehouses and distribution centers. Growth is supported by high volumes of packaged goods, expansion of retail distribution networks, and investments in sustainable packaging. Battery-operated tensioners are gaining popularity due to their efficiency and reduced labor needs. The rise in domestic manufacturing and just-in-time supply chain strategies is further strengthening demand for reliable strapping and tensioning solutions.
Europe
Europe accounted for around 25% market share in 2024, led by Germany, France, and the U.K. The region benefits from its strong manufacturing base, high-quality standards, and strict packaging regulations, driving demand for precise and consistent tensioning tools. Growth is fueled by food and beverage exports, pharmaceutical distribution, and construction material packaging. European companies are adopting battery-operated and ergonomic tensioners to improve worker safety and efficiency. Sustainability initiatives, including the use of recyclable strapping materials, are also supporting adoption of modern tensioners compatible with PET and paper straps. Technological upgrades in automated packaging lines continue to boost market growth.
Asia Pacific
Asia Pacific dominated the market with over 35% share in 2024, making it the largest regional market. China, India, Japan, and South Korea are major contributors due to high manufacturing output and growing e-commerce sectors. Rising urbanization and consumer demand for packaged goods are creating strong demand for tensioners across food, chemicals, and construction industries. Cost-effective production and availability of skilled labor make the region a preferred hub for packaging equipment manufacturing. Adoption of battery-operated and semi-automatic tensioners is rising in export-oriented industries, supported by investments in logistics infrastructure and rapid growth in retail and cross-border trade.
Latin America
Latin America held around 5% market share in 2024, supported by demand from Brazil and Mexico, where food processing, beverage bottling, and automotive industries drive growth. The region is gradually modernizing its packaging operations, adopting efficient tensioners for secure cargo handling. Expansion of e-commerce and increased investment in manufacturing facilities are boosting demand for both manual and battery-operated tensioners. Government incentives for industrial development and export promotion are encouraging adoption of reliable strapping solutions. While the market remains price-sensitive, the trend toward mechanized packaging solutions is expected to accelerate adoption in the coming years.
Middle East & Africa
The Middle East & Africa accounted for around 5% share of the packaging tensioner market in 2024. Growth is driven by infrastructure development, rising construction activity, and expansion of food and beverage production, particularly in Gulf countries. Logistics hubs in the UAE and Saudi Arabia are adopting efficient tensioners to support large-scale import and export operations. The pharmaceutical and chemical industries also contribute to demand, requiring secure packaging for regulated goods. Limited local manufacturing capacity means most tools are imported from Asia and Europe, but rising investments in industrial packaging are expected to support market growth.
Market Segmentations:
By Material
- Plastic
- Polyester
- Polypropylene
- Metal
By Operation
- Manual
- Battery-operated
By End-use
- Food & Beverages
- Pharmaceuticals
- Chemicals
- Building & Construction
By Geography
- North America
- U.S.
- Canada
- Mexico
- Europe
- Germany
- France
- U.K.
- Italy
- Spain
- Rest of Europe
- Asia Pacific
- China
- Japan
- India
- South Korea
- South-east Asia
- Rest of Asia Pacific
- Latin America
- Brazil
- Argentina
- Rest of Latin America
- Middle East & Africa
- GCC Countries
- South Africa
- Rest of the Middle East and Africa
Competitive Landscape
The competitive landscape of the packaging tensioner market includes key players such as FROMM Packaging Systems, Dynaric, Inc., North Shore Strapping Inc., Samuel Packaging Systems Group, Transpak Equipment Corp, Tiger Pack, Inc., Venus Hartung Pty Ltd., Wenzhou Zhenda Packing Machine Co., Ltd., Sal-Tech Easy Packaging, and Yang Bey Industrial Co., Ltd. These companies compete by offering a range of manual and battery-operated tensioners designed for different strap materials, including plastic, polyester, and metal. Market players are focusing on product innovation, ergonomic designs, and automation-ready solutions to enhance operator efficiency and reduce packaging time. Strategic moves include geographic expansion, partnerships with distributors, and the development of tensioners compatible with eco-friendly strapping materials. Several players are investing in R&D to improve durability, reduce maintenance requirements, and integrate smart features for tension monitoring. Competition remains intense, with differentiation based on product performance, pricing, and after-sales service support.
Key Player Analysis
- Yang Bey Industrial Co., Ltd.
- FROMM Packaging Systems
- Venus Hartung Pty Ltd.
- Transpak Equipment Corp
- Wenzhou Zhenda Packing Machine Co., Ltd.
- Samuel Packaging Systems Group
- Sal-Tech Easy Packaging
- Tiger Pack, Inc.
- Dynaric, Inc.
- North Shore Strapping Inc.
Recent Developments
- In August 2025, FROMM Packaging Systems announced new plastic strapping tool solutions designed to improve product uptime and workplace safety while meeting sustainability goals.
- In May 2025, Sal-Tech introduced a compact battery-powered packaging tensioner supporting up to 1,300 N tension force and strain rate control, designed for moderate-duty applications in logistics and warehousing with battery life enabling 400+ cycles per charge.
- In October 2024, Transpak Equipment Corp launched the fully-automatic TP-733VTSP pallet strapping machine featuring 2.5-ton compression capacity to boost efficiency in heavy-duty packaging operations.
Report Coverage
The research report offers an in-depth analysis based on Material, Operation, End-use and Geography. It details leading market players, providing an overview of their business, product offerings, investments, revenue streams, and key applications. Additionally, the report includes insights into the competitive environment, SWOT analysis, current market trends, as well as the primary drivers and constraints. Furthermore, it discusses various factors that have driven market expansion in recent years. The report also explores market dynamics, regulatory scenarios, and technological advancements that are shaping the industry. It assesses the impact of external factors and global economic changes on market growth. Lastly, it provides strategic recommendations for new entrants and established companies to navigate the complexities of the market.
Future Outlook
- The market will experience steady growth driven by rising e-commerce and logistics demand.
- Battery-operated tensioners will gain popularity for faster and more efficient packaging operations.
- Manual tensioners will maintain demand in small and medium-scale industries due to cost-effectiveness.
- Adoption of sustainable and recyclable strapping materials will boost demand for compatible tensioners.
- Food and beverage will remain the leading end-use sector with consistent packaging requirements.
- Pharmaceutical and chemical industries will drive growth with strict packaging standards for safe transport.
- Asia Pacific will strengthen its leadership with expanding manufacturing and export activities.
- North America and Europe will invest in automation and ergonomic packaging solutions.
- Manufacturers will focus on lightweight, durable, and low-maintenance designs to improve productivity.
- Integration of smart features like tension monitoring will create opportunities for advanced packaging solutions.
Request a Free Sample
Fill in your details and we'll send you a free sample report.
- Sample data tables & charts
- Research methodology
Need a Custom Version of This Report?
Tailor the scope, geography, or segments to your exact requirements.
- Custom geography or segment scope
- Direct access to our analyst team
Frequently Asked Questions
What is the current market size for Packaging Tensioner market, and what is its projected size in 2032?
At what Compound Annual Growth Rate is the Packaging Tensioner market projected to grow between 2025 and 2032?
Which Packaging Tensioner market segment held the largest share in 2024?
What are the primary factors fueling the growth of the Packaging Tensioner market?
Who are the leading companies in the Packaging Tensioner market?
Which region commanded the largest share of the Packaging Tensioner market in 2024?
Table of Content
Chapter 1. Report Introduction
- 1.1 Report Description & Purpose
- 1.1.1 Report Title & Market Definition
- 1.1.2 Unique Selling Propositions (USP) & Key Differentiators
- 1.1.3 Value Proposition for Stakeholders
- 1.2 Research Objectives
- 1.2.1 Market Sizing Objectives (Volume & Revenue)
- 1.2.2 Segmentation Objectives
- 1.2.3 Competitive Intelligence Objectives
- 1.2.4 Forecast & Scenario Objectives
- 1.3 Report Scope
- 1.3.1 Packaging Tensioner Scope – Types & Subtypes Covered
- 1.3.2 Geographic Scope – Regions & Countries Covered
- 1.3.3 Historical Period, Base Year & Forecast Period (2024; forecast to 2032)
- 1.3.4 Inclusions & Exclusions
- 1.4 HS Code & Classification Framework
- 1.5 Currency, Units & Pricing Basis
- 1.6 Target Stakeholders
- 1.7 Limitations & Assumptions
Chapter 2. Executive Summary
- 2.1 Global Packaging Tensioner Market Snapshot
- 2.1.1 Market Size – Historical (2024) & Forecast (2024-2032) (2024: USD 1,139.46 million → 2032: USD 1,388.32 million)
- 2.1.2 Volume & Revenue – Global Totals
- 2.1.3 Key Market Highlights – Top Five Facts
- 2.2 Packaging Tensioner Market Segmentation Snapshot
- 2.2.1 Market Split by Region – 2024 vs. 2032
- 2.3 Competitive Snapshot
- 2.3.1 Top 10 Players by Revenue Share – 2024
- 2.3.2 Top 10 Players by Volume Share – 2024
- 2.3.3 Recent Strategic Developments (18-Month Summary)
- 2.4 Key Investment Highlights & Strategic Conclusions
Chapter 3. Packaging Tensioner Market Dynamics & Industry Analysis
- 3.1 Market Overview & Context
- 3.1.1 Packaging Tensioner Market Position in the Broader Automotive Value Chain
- 3.1.2 OEM vs. Replacement Market Dynamics
- 3.1.3 Market Maturity & Development Stage by Region
- 3.2 Packaging Tensioner Market Drivers
- 3.3 Packaging Tensioner Market Restraints & Challenges
- 3.4 Packaging Tensioner Market Opportunities
- 3.5 Porter's Five Forces Analysis
- 3.5.1 Threat of New Entrants
- 3.5.2 Bargaining Power of Suppliers
- 3.5.3 Bargaining Power of Buyers
- 3.5.4 Threat of Substitutes
- 3.5.5 Competitive Rivalry – Intensity Assessment
- 3.6 Packaging Tensioner Value Chain Analysis
- 3.6.1 Upstream – Raw Material/Input Suppliers
- 3.6.1.1 Raw Material/Input 1
- 3.6.1.2 Raw Material/Input 2
- 3.6.1.3 Raw Material/Input 3
- 3.6.2 Midstream – Production/Manufacturing/Service Delivery
- 3.6.2.1 Production/Process Overview
- 3.6.2.2 Key Facility Locations & Capacity by Manufacturer
- 3.6.3 Downstream – Distribution & End Consumer
- 3.6.3.1 Primary Channel – B2B/OEM
- 3.6.3.2 Secondary Channels – Dealer, Retail, Online, Direct
- 3.6.4 Value Chain Profitability Analysis
- 3.6.1 Upstream – Raw Material/Input Suppliers
- 3.7 PESTEL Analysis
- 3.7.1 Political Factors
- 3.7.2 Economic Factors
- 3.7.3 Social Factors
- 3.7.4 Technological Factors
- 3.7.5 Environmental Factors
- 3.7.6 Legal Factors
- 3.8 Packaging Tensioner Supply Chain Analysis
- 3.8.1 Raw Material/Input Supply Risk Assessment
- 3.8.2 Manufacturing Concentration Risk (Geographic Exposure)
- 3.8.3 Trade Disruption Impact Analysis
- 3.9 Regulatory & Policy Landscape
Note: The regulatory and policy landscape section covers regulations based on their applicability to the market, Packaging Tensioner category, geography, and scope of the study. Only regulatory frameworks with a material impact on operations, compliance, trade, sustainability, or market access are analyzed in detail.
Chapter 4. Key Investment Pockets & Opportunity Analysis
- 4.1 Packaging Tensioner Market Attractiveness Analysis
- 4.1.1 By Region – Investment Attractiveness Matrix (Volume × CAGR)
- 4.2 Absolute Revenue Growth Opportunity
- 4.2.1 By Region – Absolute USD Growth Through 2032
- 4.3 Incremental Volume Opportunity
- 4.3.1 By Region – Incremental Volume Through 2032
- 4.3.2 Segment – Incremental Volume
- 4.4 Emerging Submarket Opportunity Deep Dive (Subject to Applicability)
- 4.5 Emerging Market Opportunity Scorecards
- 4.5.1 United States
- 4.5.2 Europe
- 4.5.3 Asia
- 4.5.4 Middle East & Africa
Note: Emerging Market Opportunity Scorecards will be included based on relevance and strategic importance. Regions listed are indicative and may vary depending on data availability and market dynamics.
Chapter 5. Packaging Tensioner Import-Export Analysis & Trade Flows
- 5.1 Global Trade Overview
- 5.1.1 Global Export Value by Country (2024)
- 5.1.2 Global Export Volume by Country (2024)
- 5.1.3 Global Import Value by Country (2024)
- 5.1.4 Global Import Volume by Country (2024)
- 5.1.5 Net Trade Balance by Country (2024)
- 5.2 Export Analysis – Segment
- 5.2.1 Type 1 (HS Code)
- 5.2.2 Type 2 (HS Code)
- 5.2.3 Type 3 (HS Code)
- 5.2.4 Type 4 (HS Code)
- 5.2.5 Type 5 (HS Code)
- 5.3 Import Analysis – Segment
- 5.3.1 Type 1 (HS Code)
- 5.3.2 Type 2 (HS Code)
- 5.3.3 Type 3 (HS Code)
- 5.3.4 Type 4 (HS Code)
- 5.3.5 Type 5 (HS Code)
- 5.4 Average Unit Trade Prices
- 5.4.1 Average Export Price – Segment & Country
- 5.4.2 Average Import Price – Segment & Source Country
- 5.4.3 Price Trends (2024)
- 5.5 Key Trade Route Analysis
- 5.5.1 Trade Route 1
- 5.5.2 Trade Route 2
- 5.5.3 Trade Route 3
- 5.5.4 Trade Route 4
- 5.5.5 Trade Route 5
- 5.6 Trade Policy Impact Assessment
- 5.6.1 US Anti-Dumping & Section 301 Tariffs
- 5.6.2 EU Customs Union Impact
- 5.6.3 Major Free Trade Agreements
- 5.6.4 USMCA Rules of Origin
Note: Trade policy analysis will be included only where relevant to the Packaging Tensioner market.
Chapter 6. Competitive Landscape & Company Benchmarking
- 6.1 Packaging Tensioner Market Concentration & Structure
- 6.1.1 Herfindahl-Hirschman Index (HHI) – vs. 2024
- 6.1.2 Tier 1, Tier 2 & Tier 3 Market Structure
- 6.1.3 Global, Regional & Local Player Dynamics
- 6.2 Packaging Tensioner Market Share Analysis – 2024
- 6.2.1 Global Revenue Share by Company
- 6.2.2 Global Volume Share by Company
- 6.2.3 Regional Revenue Share
- 6.2.4 Market Share Evolution ( vs. 2024)
- 6.2.5 OEM Segment Share by Company
- 6.2.6 Replacement Segment Share by Company
- 6.3 Production/Delivery Capacity & Facility Analysis
- 6.3.1 Global Installed Capacity
- 6.3.2 Capacity Utilization Rates
- 6.3.3 Production/Output Volume
- 6.3.4 Facility Locations & Capacity Map
- 6.3.5 Planned Capacity Additions
- 6.4 Packaging Tensioner Competitive Benchmarking Matrix
- 6.4.1 Revenue, Volume, CAGR & Profitability Comparison
- 6.4.2 Channel Revenue Mix
- 6.4.3 Geographic Revenue Exposure
- 6.4.4 R&D Intensity
- 6.4.5 Sustainability Maturity
- 6.5 Strategic Developments in Packaging Tensioner (Last 24 Months)
- 6.5.1 Mergers, Acquisitions & Divestments
- 6.5.2 New Packaging Tensioner Launches
- 6.5.3 Facility Expansions
- 6.5.4 Strategic Alliances, Joint Ventures & Partnerships
- 6.5.5 Distribution Expansion & Market Entry
- 6.5.6 Sustainability & ESG Initiatives
- 6.6 Competitive Strategy Mapping
- 6.6.1 Leader, Challenger, Follower & Niche Classification
- 6.6.2 Pricing Strategy Comparison
- 6.6.3 Channel Strategy Matrix
Note: Strategic developments are included based on their materiality and the availability of reliable information.
Chapter 7. Global Packaging Tensioner Market – By Distribution Channel
- 7.1 Segment Overview
- 7.1.1 Volume & Revenue Split by Channel (2024 & 2032)
- 7.1.2 Channel Mix Evolution (2024-2032)
Chapter 8. Regional Market Analysis – Global Overview
- 8.1 Global Regional Overview
- 8.1.1 Regional Volume Share
- 8.1.2 Regional Revenue Share
- 8.1.3 Regional Volume by Region
- 8.1.4 Regional Revenue by Region
- 8.1.5 Regional Forecast Through 2032
- 8.2 Cross-Regional Segment Analysis
- 8.2.1 By Distribution Channel
- 8.2.2 By Brand/Price Tier
Chapter 9. North America Packaging Tensioner Market
- 9.1 United States
- 9.2 Canada
- 9.3 Mexico
Chapter 10. Europe Packaging Tensioner Market
- 10.1 Germany
- 10.2 France
- 10.3 Italy
- 10.4 United Kingdom
- 10.5 Spain
- 10.6 Poland
- 10.7 Russia
- 10.8 Netherlands
- 10.9 Belgium
- 10.10 Sweden
- 10.11 Denmark
- 10.12 Norway
- 10.13 Rest of Europe
Chapter 11. Asia Pacific Packaging Tensioner Market
- 11.1 China
- 11.2 India
- 11.3 Japan
- 11.4 South Korea
- 11.5 Thailand
- 11.6 Indonesia
- 11.7 Vietnam
- 11.8 Malaysia
- 11.9 Australia
- 11.10 Rest of Asia Pacific
Chapter 12. Latin America Packaging Tensioner Market
- 12.1 Brazil
- 12.2 Argentina
- 12.3 Colombia
- 12.4 Chile
- 12.5 Rest of Latin America
Chapter 13. Middle East Packaging Tensioner Market
- 13.1 Saudi Arabia
- 13.2 United Arab Emirates
- 13.3 Turkey
- 13.4 Israel
- 13.5 Iran
- 13.6 Rest of the Middle East
Chapter 14. Africa Packaging Tensioner Market
- 14.1 South Africa
- 14.2 Egypt
- 14.3 Nigeria
- 14.4 Morocco
- 14.5 Rest of Africa
Chapter 15. Packaging Tensioner Company Profiles
- 15.1 [Company 01]
- 15.1.1 Company Overview
- 15.1.2 Key Management Personnel
- 15.1.3 Products & Services Portfolio
- 15.1.4 Financial Performance
- 15.1.5 Key Market Focus & Geographic Presence
- 15.1.6 Recent Developments & Strategic Initiatives
Note: The company profile list is preliminary and may change based on research findings, market developments, data availability, and client requirements.
Chapter 16. Appendices
- Appendix A – List of Abbreviations & Acronyms
- Appendix B – Industry Classification Code Reference – Full Series
- Appendix C – Production & Capacity Data Tables
- Appendix D – End-Use & Demand Base Tables
- Appendix E – Consumption & Replacement Rate Assumptions
- Appendix F – ASP Reference Tables
- Appendix G – Manufacturing & Facility Database
- Appendix H – Import-Export Data Tables
- Appendix I – Regulatory Summary Tables
- Appendix J – Primary Research Participant List (Anonymized)
- Appendix K – Primary Research Questionnaire Framework
- Appendix L – Data Sources & Bibliography
- Appendix M – Market Size Divergence & Source Comparison
Chapter 17. Research Methodology
- 17.1 Research Framework & Philosophy
- 17.2 Secondary Research – Sources, Hierarchy & Data Extraction
- 17.3 Data Modeling – Bottom-Up & Top-Down Market Sizing
- 17.4 Primary Research – Stakeholder Framework, LOI & Sample Sizes
- 17.5 Forecast Methodology – Regression, Scenario & Sensitivity Analysis
- 17.6 Quality Control – Four-Layer Validation Framework
- 17.7 Limitations & Standard Assumptions
- 17.8 Disclaimer
