Market Overview
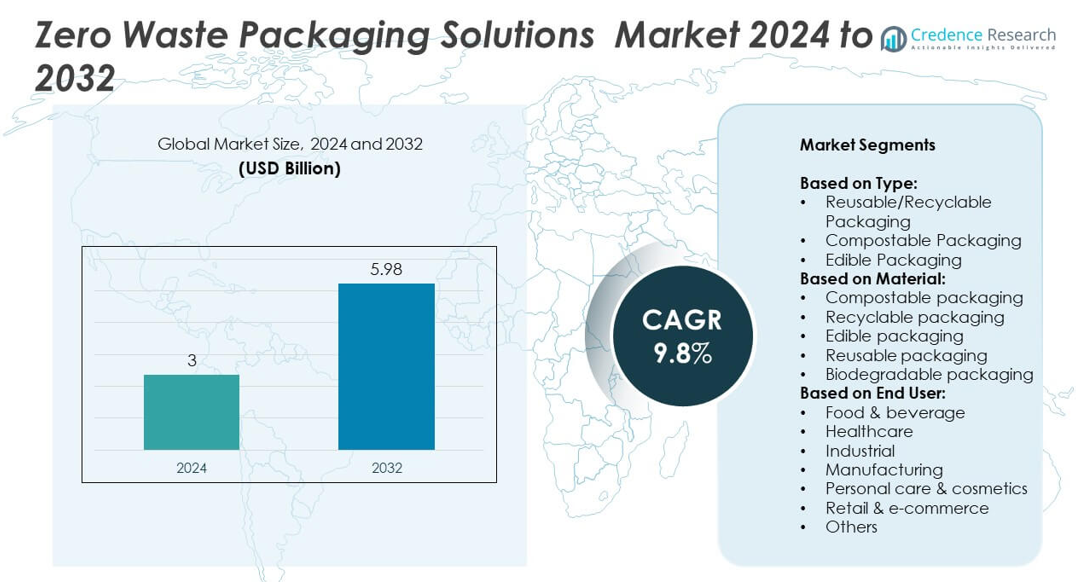
Zero Waste Packaging market size was valued USD 3 Billion in 2024 and is anticipated to reach USD 5.98 Billion by 2032, at a CAGR of 9.8% during the forecast period.
| REPORT ATTRIBUTE |
DETAILS |
| Historical Period |
2020-2023 |
| Base Year |
2024 |
| Forecast Period |
2025-2032 |
| Zero Waste Packaging Market Size 2024 |
USD 3 Billion |
| Zero Waste Packaging Market ,CAGR |
9.8% |
| Zero Waste Packaging Market Size 2032 |
USD 5.98 Billion |
The Zero Waste Packaging Solutions market is shaped by leading players such as Regeno, Avani Eco, Biome Bioplastics Limited, TIPA, World Centric, DS Smith plc, Fibmold, Notpla Limited, and Sulapac Oy. These companies focus on developing recyclable, compostable, and reusable packaging materials to meet global sustainability goals and strict regulatory requirements. They invest in bio-based material innovation and collaborate with FMCG brands to enhance large-scale adoption. North America leads the market with a 36% share in 2024, driven by strong regulations and consumer awareness, followed by Europe at 30%, supported by advanced recycling infrastructure and circular economy initiatives.
Market Insights
- The Zero Waste Packaging Solutions market was valued at USD 3 Billion in 2024 and is projected to reach USD 5.98 Billion by 2032, growing at a CAGR of 9.8%.
- Growth is driven by strict plastic bans, corporate ESG commitments, and demand for recyclable, compostable, and reusable packaging solutions across food, beverage, and e-commerce sectors.
- Key trends include expansion of refillable and returnable packaging models, rising use of bio-based and edible packaging, and growing investment in circular economy infrastructure.
- The market is highly competitive with established players and start-ups focusing on R&D, capacity expansion, and partnerships with retailers and FMCG brands to increase adoption of sustainable materials.
- North America leads with 36% share, followed by Europe at 30% and Asia-Pacific at 22%, while reusable/recyclable packaging remains the dominant segment with over 45% share in 2024.
Access crucial information at unmatched prices!
Request your sample report today & start making informed decisions powered by Credence Research Inc.!
Download Sample
Market Segmentation Analysis:
By Type
The reusable/recyclable packaging segment dominated the Zero Waste Packaging Solutions market in 2024, capturing over 45% of the total share. Its growth is driven by rising global focus on circular economy initiatives and extended producer responsibility (EPR) regulations. Companies across food, retail, and e-commerce are adopting durable and recyclable packaging to reduce plastic waste. The segment benefits from advances in material recovery technologies and return logistics systems, making it cost-effective and scalable. Growing consumer demand for eco-friendly solutions and government bans on single-use plastics are expected to sustain the strong demand for this segment through 2032.
- For instance, in Norway, Infinitum operates a national deposit-recycling system for one-way beverage containers. The most recently reported return rate for these containers, as of 2023, was 92.3%, which included a return rate of 92.5% for aluminum cans and 92.3% for plastic bottles. The Norwegian system is structured with a tax incentive where beverage producers who achieve a 95% return rate are exempt from an environmental tax.
By Material
Recyclable packaging accounted for the largest share, holding around 40% of the material-based segment in 2024. Its dominance is attributed to its compatibility with existing recycling infrastructure and lower cost compared to emerging biodegradable or edible options. Increased corporate commitments to sustainability goals are fueling demand for recyclable solutions across industries. Regulatory pressure from agencies such as the EU and U.S. EPA further promotes adoption. Technological improvements in sorting and reprocessing systems are increasing recovery rates, enhancing the economic viability of recyclable packaging over compostable and edible alternatives.
- For instance, Amazon replaced 95% of its plastic air pillows with recycled paper filler in North America, removing nearly 15 billion plastic air pillows annually.
By End User
The food & beverage sector led the end-user segment, representing nearly 35% of the market share in 2024. This dominance stems from strict regulations on packaging waste, high consumption volume, and consumer preference for sustainable packaging in food products. Quick-service restaurants, beverage producers, and packaged food companies are investing in reusable and compostable formats to meet ESG targets. E-commerce grocery delivery growth is also boosting demand for zero-waste packaging solutions. Strong partnerships between packaging suppliers and food brands are driving innovation, making this segment a key revenue generator throughout the forecast period.
Market Overview
Rising Regulatory Pressure on Single-Use Plastics
Strict government regulations and global bans on single-use plastics are a key growth driver for the zero-waste packaging market. Policies like the EU Single-Use Plastics Directive and extended producer responsibility programs compel manufacturers to adopt recyclable, reusable, and compostable packaging solutions. This regulatory push encourages investment in sustainable materials and circular economy systems. It also drives large-scale corporate commitments to reduce plastic footprints, boosting demand across food, healthcare, and e-commerce industries.
- For instance, in 2024, Amazon avoided using more than 134 million plastic bags in North America by retrofitting its automated packing machines to produce made-to-fit paper bags instead. This was one of several plastic reduction initiatives. In a separate effort, the company also replaced its plastic air pillows with 100% recycled paper filler in North America.
Corporate Sustainability Goals and ESG Commitments
Another major growth driver is the growing adoption of corporate sustainability goals. Leading brands are pledging to achieve 100% recyclable or compostable packaging by 2030. This commitment is creating strong demand for innovative packaging formats that meet recyclability standards and reduce landfill waste. The focus on ESG reporting and consumer preference for eco-friendly packaging is pushing companies to invest in sustainable material technologies and closed-loop packaging solutions, further accelerating market growth.
- For instance, in 2024 Mondelez used 429,400 metric tons of corrugated cardboard and 124,500 metric tons of flexible plastics.
Advances in Material Innovation and Circular Economy Systems
Innovations in bio-based materials, compostable polymers, and reusable designs form a key driver for market expansion. Emerging technologies such as chemical recycling and advanced sorting systems enable higher recovery rates, making circular packaging models more viable. Companies are collaborating with recyclers and technology providers to create scalable systems that support zero-waste initiatives. These developments are reducing production costs over time and encouraging widespread adoption across multiple industries.
Key Trends & Opportunities
Growth of Refillable and Returnable Packaging Models
One of the key trends is the expansion of refillable and returnable packaging models across retail and foodservice sectors. Companies like Loop and major FMCG brands are piloting reusable containers with reverse logistics networks. This trend creates opportunities for packaging suppliers to design durable, lightweight solutions optimized for multiple reuse cycles. Retailers are adopting in-store refill stations, while e-commerce players explore returnable shipping boxes to cut packaging waste and improve customer loyalty.
- For instance, Coca-Cola Hellenic Bottling Company (HBC) reported that as a result of its long-running primary packaging light-weighting program, it saves more than 50,000 metric tons of packaging annually compared to its average packaging weight in 2010. The weight of a 500 ml PET bottle was reduced from 28g in 2010 to 19.9g, while a 2L bottle went from 54g to 42.7g. More recently, the company expects to remove an additional 2,000 metric tons of packaging by 2025 versus its 2024 baseline through continued light-weighting initiatives.
Rising Consumer Demand for Sustainable Packaging
Growing consumer awareness of environmental issues is a key opportunity for market players. Surveys show that a majority of customers prefer brands using eco-friendly and recyclable packaging. This shift allows companies to differentiate themselves through sustainable packaging claims, enhancing brand reputation and market share. The demand also encourages continuous innovation in biodegradable, edible, and compostable materials, creating opportunities for new entrants and partnerships between packaging producers and consumer brands.
- For instance, as of its 2023/24 sustainability report, DS Smith presents approximately 4,000 solutions to its customers each month that incorporate its Circular Design Metrics. The company uses these metrics to help customers assess and improve the circularity of their packaging. By the end of the 2023/24 reporting period, DS Smith had also influenced over 100,000 packaging design decisions through its Circular Design Metrics since their launch.
Key Challenges
High Cost of Sustainable Packaging Solutions
The cost of developing and producing zero-waste packaging remains a major challenge. Bio-based and compostable materials are often more expensive than conventional plastics, which limits adoption, especially among small and medium businesses. Scaling up production and improving recycling infrastructure can help bring costs down. However, until economies of scale are achieved, price sensitivity may slow adoption in cost-competitive sectors like retail and industrial packaging.
Infrastructure Limitations and Recycling Gaps
Another key challenge is the lack of uniform recycling and composting infrastructure. Many regions still lack facilities to process advanced compostable or bio-based materials, leading to contamination and lower recovery rates. This gap reduces the effectiveness of zero-waste initiatives and discourages investments in sustainable packaging. Developing standardized collection systems and educating consumers about proper disposal are essential steps to overcoming this barrier and achieving large-scale adoption.
Regional Analysis
North America
North America held the largest share of the zero waste packaging solutions market with around 36% in 2024. The region benefits from strict regulations on plastic waste, strong consumer awareness, and widespread adoption of sustainable packaging by major brands. The U.S. leads with initiatives from FMCG and e-commerce players driving recyclable and reusable packaging adoption. Canada’s focus on extended producer responsibility programs further strengthens market growth. Rising investments in advanced recycling infrastructure and partnerships between packaging suppliers and retailers are boosting adoption across food, beverage, and healthcare industries, positioning North America as a key growth driver through 2032.
Europe
Europe accounted for nearly 30% of the global market share in 2024, driven by stringent regulatory frameworks like the EU Packaging and Packaging Waste Directive. Countries such as Germany, France, and the UK are leading with national plastic bans and circular economy roadmaps. Strong collaboration between governments and private sectors is fostering development of compostable and recyclable packaging solutions. Consumer demand for eco-friendly products remains high, encouraging retailers and food companies to shift to zero-waste formats. Continuous R&D in biodegradable materials and investment in closed-loop systems support Europe’s strong market position and steady growth outlook.
Asia-Pacific
Asia-Pacific captured about 22% of the market share in 2024, with rapid growth expected through 2032. Countries like China, Japan, and India are implementing strict policies to reduce plastic waste, fueling demand for recyclable and compostable packaging solutions. Expanding e-commerce and food delivery sectors in the region create significant opportunities for sustainable packaging suppliers. Rising consumer awareness and government-led initiatives such as India’s single-use plastic ban are driving adoption. Investments in local recycling infrastructure and innovative bio-based materials are expected to accelerate growth, making Asia-Pacific the fastest-growing region in the forecast period.
Latin America
Latin America accounted for nearly 7% of the global market share in 2024. The region is witnessing growing adoption of eco-friendly packaging driven by regulatory actions in countries like Brazil, Chile, and Mexico. Rising consumer demand for sustainable products and increasing focus from multinational FMCG companies are pushing investment in recyclable and reusable solutions. However, limited recycling infrastructure remains a challenge. Public-private collaborations and new collection programs are helping expand access to compostable packaging options, supporting moderate but steady growth across food, beverage, and retail sectors in the region over the forecast period.
Middle East & Africa
The Middle East & Africa region held a 5% share of the market in 2024, with gradual adoption of zero-waste packaging solutions. The growth is supported by rising sustainability initiatives in the UAE, Saudi Arabia, and South Africa. Expanding retail and e-commerce sectors are increasingly turning to recyclable and reusable packaging formats to meet consumer demand. Government campaigns promoting plastic waste reduction are encouraging businesses to adopt eco-friendly alternatives. Infrastructure gaps and higher costs remain barriers, but increasing foreign investments and partnerships with global packaging firms are expected to support future market expansion.
Market Segmentations:
By Type:
- Reusable/Recyclable Packaging
- Compostable Packaging
- Edible Packaging
By Material:
- Compostable packaging
- Recyclable packaging
- Edible packaging
- Reusable packaging
- Biodegradable packaging
By End User:
- Food & beverage
- Healthcare
- Industrial
- Manufacturing
- Personal care & cosmetics
- Retail & e-commerce
- Others
By Geography:
- North America
- Europe
- Germany
- France
- U.K.
- Italy
- Spain
- Rest of Europe
- Asia Pacific
- China
- Japan
- India
- South Korea
- South-east Asia
- Rest of Asia Pacific
- Latin America
- Brazil
- Argentina
- Rest of Latin America
- Middle East & Africa
- GCC Countries
- South Africa
- Rest of the Middle East and Africa
Competitive Landscape
The competitive landscape of the Zero Waste Packaging Solutions market features leading players such as Regeno, Avani Eco, Biome Bioplastics Limited, TIPA, World Centric, DS Smith plc, Fibmold, Notpla Limited, Loliware Inc., Marigold Health, Hero Packaging, Ecovative LLC, BIOPLA, Sulapac Oy, Kelpi, and Evoware. The market is characterized by strong focus on innovation in compostable, recyclable, and reusable packaging formats to meet rising sustainability demands. Companies are investing heavily in R&D to develop bio-based polymers, edible films, and circular packaging models that comply with strict regulations. Strategic collaborations with retailers and foodservice chains are enhancing product adoption. Several players are expanding production capacity and entering new regional markets to gain a competitive edge. The competition is intensifying with start-ups introducing novel materials and established firms adopting mergers and acquisitions to strengthen their portfolios and widen their global presence, fostering rapid growth of sustainable packaging solutions.
Shape Your Report to Specific Countries or Regions & Enjoy 30% Off!
Key Player Analysis
- Regeno
- Avani Eco
- Biome Bioplastics Limited
- TIPA
- World Centric
- DS Smith plc
- Fibmold
- Notpla Limited
- Loliware Inc.
- Marigold Health
- Hero Packaging
- Ecovative LLC
- BIOPLA
- Sulapac Oy
- Kelpi
- Evoware
Recent Develpments
- In 2024, Kelpi secured £4.3 million in funding to advance its seaweed-based packaging technology.
- In 2024, Marigold Health Foods made collaboration with Sonoco to launch fully recyclable packaging solutions for its range of plant-based products.
- In 2023, Fibmold ,the sustainable packaging startup Fibmold raised $10 million in funding. This capital is intended to accelerate the development and commercialization of its innovative, eco-friendly packaging solutions, indicating progress in creating viable alternatives to traditional packaging
Report Coverage
The research report offers an in-depth analysis based on Type, Material, End-User and Geography. It details leading market players, providing an overview of their business, product offerings, investments, revenue streams, and key applications. Additionally, the report includes insights into the competitive environment, SWOT analysis, current market trends, as well as the primary drivers and constraints. Furthermore, it discusses various factors that have driven market expansion in recent years. The report also explores market dynamics, regulatory scenarios, and technological advancements that are shaping the industry. It assesses the impact of external factors and global economic changes on market growth. Lastly, it provides strategic recommendations for new entrants and established companies to navigate the complexities of the market.
Future Outlook
- The market will grow steadily due to strict global regulations on plastic waste.
- Adoption of reusable and refillable packaging models will increase across retail and e-commerce.
- Demand for compostable and biodegradable materials will rise with consumer preference for eco-friendly options.
- Technological advances in chemical recycling will improve recovery rates and circularity.
- Food and beverage companies will remain the largest adopters of zero-waste packaging solutions.
- Investment in local recycling and composting infrastructure will expand in emerging markets.
- Partnerships between packaging firms and FMCG brands will drive large-scale innovation.
- Edible and bio-based packaging formats will gain traction in niche premium segments.
- Supply chain collaborations will focus on reducing costs and improving scalability of sustainable packaging.
- Asia-Pacific will experience the fastest growth, supported by policy initiatives and rising consumption.


