
Market Overview
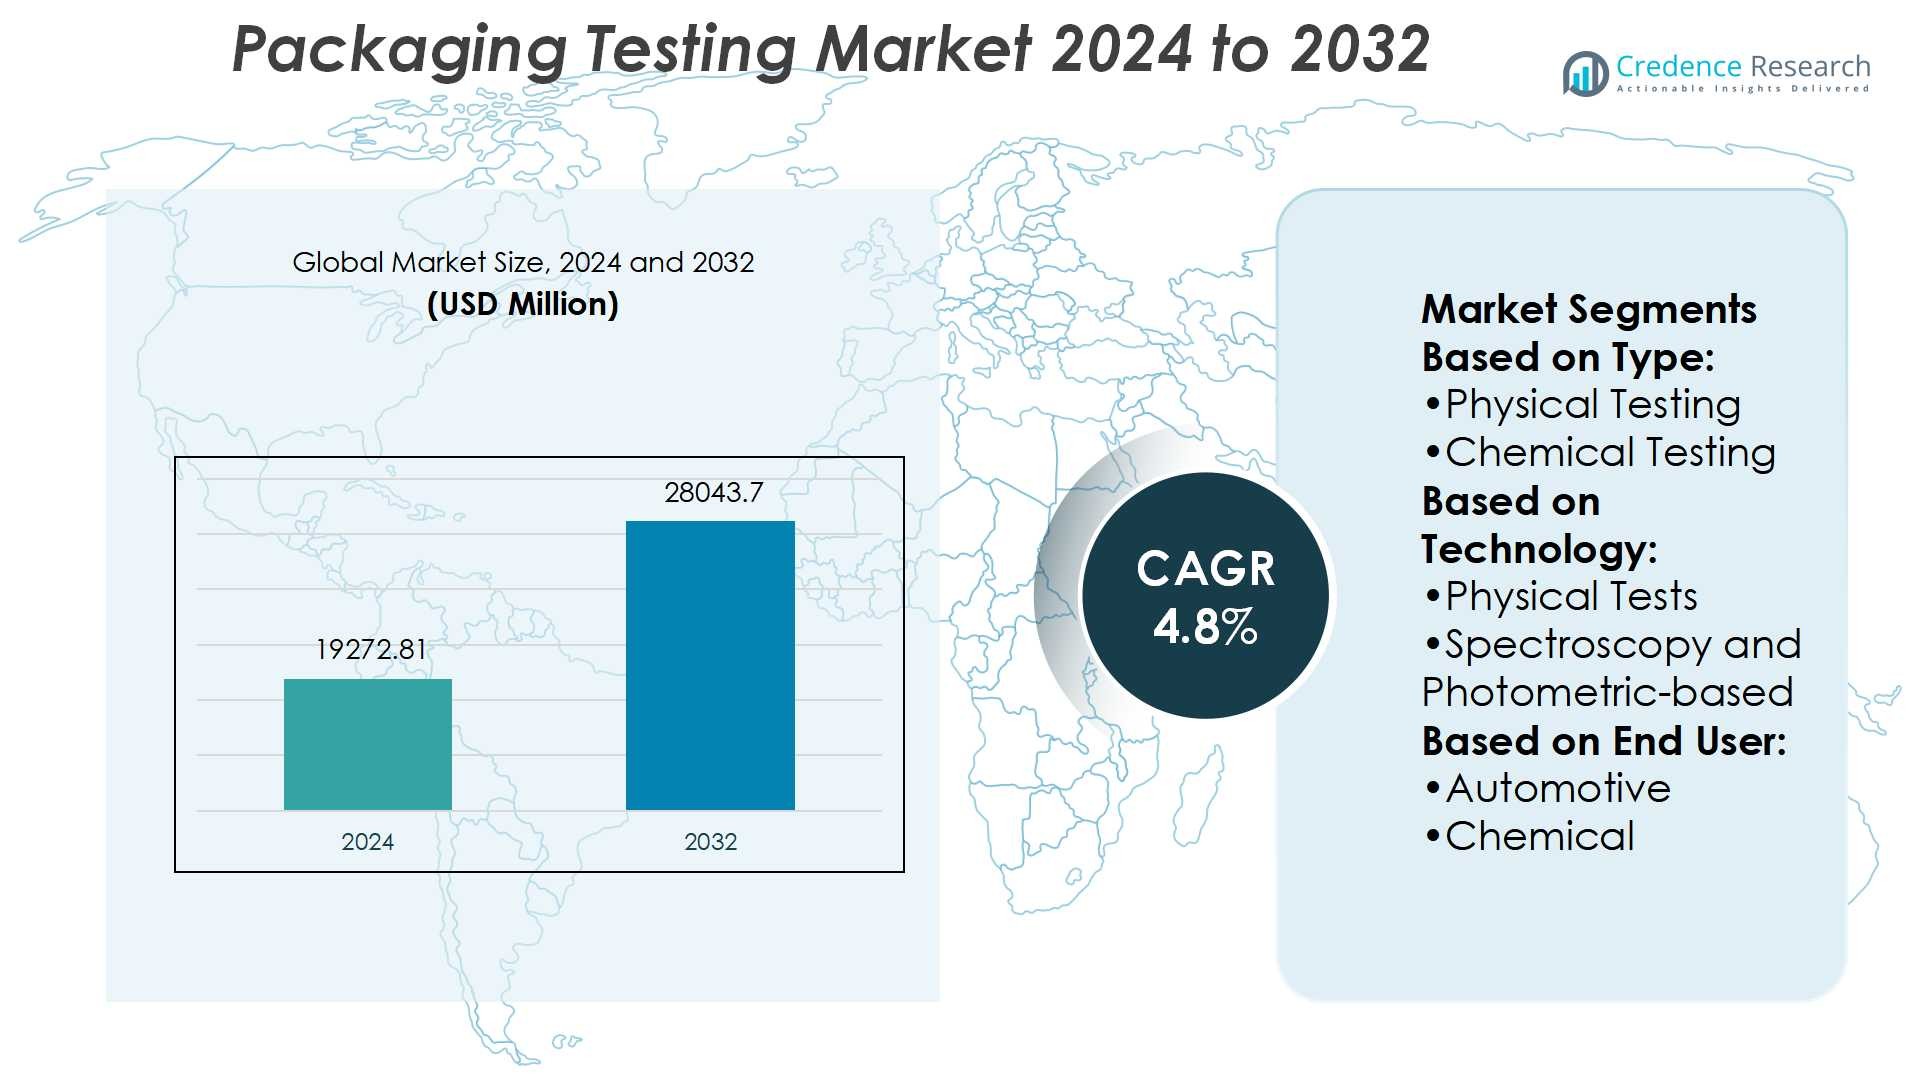
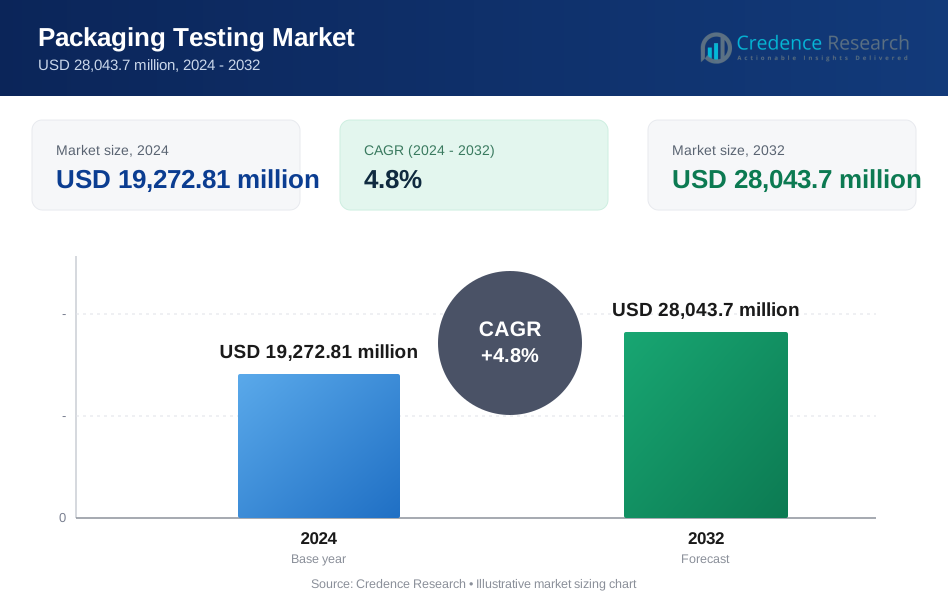
Packaging Testing Market size was valued USD 19272.81 million in 2024 and is anticipated to reach USD 28043.7 million by 2032, at a CAGR of 4.8% during the forecast period.
| REPORT ATTRIBUTE | DETAILS |
|---|---|
| Historical Period | 2020-2023 |
| Base Year | 2024 |
| Forecast Period | 2025-2032 |
| Packaging Testing Market Size 2024 | USD 19272.81 Million |
| Packaging Testing Market, CAGR | 4.8% |
| Packaging Testing Market Size 2032 | USD 28043.7 Million |
The packaging testing market is shaped by top players including Eurofins Scientific, Intertek Group, Bureau Veritas, ALS, Element Materials Technology, Merieux NutriSciences, Campden BRI, DDL, Ametek, and Measur. These companies strengthen their market presence through advanced testing technologies, regulatory compliance expertise, and sustainable solutions addressing biodegradable and recyclable packaging. Strategic collaborations, acquisitions, and global laboratory expansions enhance their capabilities across diverse industries such as food, beverages, pharmaceuticals, and consumer goods. Among regions, Asia-Pacific leads the market with a 34% share, driven by rapid industrialization, strong e-commerce growth, and expanding food and pharmaceutical packaging demand, positioning it as the most dominant region globally.
Market Insights
- The Packaging Testing Market was valued at USD 19,272.81 million in 2024 and is expected to reach USD 28,043.7 million by 2032, growing at a CAGR of 4.8% during the forecast period.
- Increasing regulatory requirements for safety and quality drive demand for testing across food, beverage, and pharmaceutical packaging, ensuring compliance and consumer protection.
- Rising adoption of sustainable packaging materials such as biodegradable films and recyclable solutions creates strong market trends, requiring advanced physical, chemical, and microbiological testing methods.
- Key players including Eurofins Scientific, Intertek Group, Bureau Veritas, ALS, and others expand their global presence through laboratory investments, acquisitions, and service diversification to maintain competitive advantage.
- Asia-Pacific leads with 34% share, followed by North America at 29% and Europe at 26%, while primary packaging dominates with over 50% share, supported by growing e-commerce and export activities fueling the demand for durability and transit testing.
Market Segmentation Analysis:
By Type
Within the Packaging Testing Market, physical testing holds the dominant share, accounting for the largest portion of demand. This sub-segment leads due to its critical role in evaluating strength, durability, and performance under real-world conditions such as compression, drop, and vibration tests. Manufacturers rely heavily on physical testing to comply with international packaging standards and ensure product safety during transit. Growth is further supported by rising e-commerce volumes, where physical integrity is a primary concern, driving companies to invest in robust packaging performance validation.
- For instance, Campden BRI offers compression strength testing.They perform compression strength testing using a Zwick Z3050 materials testing machine with a 50 kN load capacity.
By Technology
Physical test methods dominate the technology segment, securing the highest share owing to their established reliability and wide applicability. These methods remain central to assessing package resilience against stress, impact, and transportation conditions. While spectroscopy- and chromatography-based techniques are gaining traction for material and chemical analysis, physical tests are indispensable for routine validation across industries. Their dominance is driven by stringent regulatory requirements and cost-effectiveness, making them the first choice for companies seeking both compliance and operational efficiency in packaging assurance.
- For instance, Intertek’s PFAS-Free Certification Program limits total organic fluorine (TOF) at 20 ppm (parts per million). This is more stringent than many existing regulatory limits (often ≈ 50 ppm).
By End-User
The consumer goods sector leads the end-user segment with the largest market share, supported by high testing needs across food, beverages, and household products. Packaging in this sector requires rigorous evaluation to maintain safety, extend shelf life, and meet labeling regulations. Companies emphasize testing to safeguard against contamination, leakage, and mechanical failures that could affect brand reputation. The dominance of this sub-segment is reinforced by rising packaged goods consumption and increasing global focus on quality assurance and customer satisfaction in daily-use products.
Key Growth Drivers
Rising Demand for Safe and Sustainable Packaging
Global demand for sustainable packaging is a major driver for packaging testing. Regulatory bodies and consumers push manufacturers to meet safety and recyclability standards. Testing ensures compliance with guidelines covering chemical composition, barrier properties, and biodegradability. For instance, food packaging must undergo migration testing to prevent harmful chemical transfer. Growing use of eco-friendly materials such as bioplastics also requires robust testing protocols. This driver strengthens the adoption of advanced testing solutions across food, beverage, healthcare, and consumer goods industries.
- For instance, Universal Materials Test System (UTM) or Compression Testers are available with a wide range of load capacities. Machines with a capacity of up to 50 kN are available for testing various sizes of cartons and containers.
Stringent Regulatory Frameworks and Quality Compliance
Strict global regulations create sustained demand for packaging testing services. Authorities enforce mandatory testing standards to reduce contamination risks and ensure product integrity. Companies must comply with ISO, ASTM, and FDA norms to enter competitive markets. For example, pharmaceutical firms rely on stability and sterility tests before distribution. Packaging validation helps maintain safety while avoiding costly recalls and penalties. As industries expand into international markets, meeting varied regulatory requirements continues to fuel the need for comprehensive packaging testing solutions.
Growth of E-Commerce and Global Supply Chains
The e-commerce boom and global trade expansion drive advanced packaging testing adoption. Products shipped across long distances must withstand temperature variations, shocks, and vibrations. This raises demand for physical testing methods like drop, compression, and vibration tests. For instance, fragile electronics and medical devices require rigorous packaging validation to prevent damage during transit. The rise of cross-border shipping amplifies the importance of packaging durability and safety. As e-commerce penetration deepens, reliable packaging testing solutions remain essential for brand reputation and customer trust.
- For instance, Element Materials Technology's U.S. Space & Defense labs offer advanced shock and vibration testing. Their shock and drop testing can reach up to 50,000 g for less than one second, and they have performed vibration testing exceeding 200 Grms.
Key Trends & Opportunities
Adoption of Digital and Automated Testing Solutions
Automation and digital tools are transforming packaging testing practices. Technologies like AI-enabled image recognition and IoT sensors improve testing accuracy and reduce time. Automated systems streamline repetitive tasks such as tensile strength measurement or permeability checks. For example, robotics-based handling ensures consistency in compression tests for bulk packaging. These solutions enhance efficiency and scalability, making them attractive for large-scale manufacturers. Growing investment in smart testing technologies creates significant opportunities for companies to expand service portfolios and improve compliance capabilities.
- For instance, Presto launched a new environmental test chamber capable of operating within a wide temperature range, such as –40°C to +150°C, and a humidity range of 20% to 98% RH. The company claims the chamber provides 99.2% accuracy for product test results, with specific technical accuracy metrics varying by model.
Expansion of Testing Services in Emerging Markets
Emerging economies present strong opportunities for packaging testing providers. Rising disposable incomes and demand for packaged food, pharmaceuticals, and personal care products expand the market base. Governments in Asia-Pacific and Latin America increasingly adopt stricter safety regulations, boosting demand for compliance testing. For instance, India’s FSSAI mandates packaging migration tests for food products. Regional laboratories and service providers benefit by offering localized testing solutions. This trend enables faster market entry for manufacturers while strengthening consumer safety standards in developing regions.
- For instance, L.A.B. has 13,000+ equipment installations worldwide. Their product range includes drop testers, shock testers, hydraulic vibration, mechanical vibration, and incline impact testers.
Key Challenges
High Cost of Advanced Testing Technologies
The adoption of modern packaging testing equipment often comes with high capital costs. Advanced systems like chromatography, spectroscopy, or automated stress testing require substantial investment. Small and medium enterprises (SMEs) often struggle to allocate resources for in-house testing. For example, high-performance gas chromatography units cost significantly more than traditional methods. Outsourcing is an alternative but increases recurring expenses. These financial barriers limit adoption among cost-sensitive manufacturers, creating challenges for broader market penetration.
Complexity of Multi-Material and Innovative Packaging
The rise of hybrid and innovative packaging materials complicates testing requirements. Multi-layered packaging with paper, plastic, and biodegradable films demands tailored testing protocols. Each layer may react differently to temperature, pressure, or chemical exposure. For instance, laminated pouches used in food products require barrier performance tests for oxygen and moisture. Designing accurate methods to test these combinations remains challenging. This complexity increases testing time and cost, slowing innovation cycles and adding hurdles for packaging manufacturers and service providers.
Regional Analysis
North America
North America holds a 29% market share, driven by strict regulatory standards and advanced packaging technologies. The U.S. and Canada emphasize compliance with FDA and ASTM guidelines, boosting demand for physical, chemical, and microbiological testing. The strong presence of pharmaceutical, food, and consumer goods industries accelerates market growth. Rising sustainability initiatives push companies toward eco-friendly materials, requiring extensive testing for recyclability and biodegradability. E-commerce expansion further supports demand for transit and durability testing. Established testing service providers and advanced laboratory infrastructure consolidate North America’s position as a leading regional market.
Europe
Europe accounts for 26% of the packaging testing market, supported by stringent EU directives and strong environmental policies. Countries such as Germany, France, and the U.K. prioritize sustainable packaging aligned with circular economy goals. Regulatory frameworks like REACH and EFSA guidelines drive consistent demand for chemical migration and safety tests. Growth in pharmaceutical and personal care sectors increases reliance on sterile and integrity testing. Europe also leads in adopting digital testing solutions and automation, ensuring efficiency and precision. The focus on recyclability and carbon footprint reduction continues to drive the need for comprehensive packaging validation across industries.
Asia-Pacific
Asia-Pacific leads the global market with a 34% share, reflecting rapid industrialization, expanding e-commerce, and rising consumer demand. China, India, and Japan dominate testing requirements due to their vast food, beverage, and pharmaceutical industries. Governments in the region enforce stricter safety regulations, such as China’s GB standards and India’s FSSAI mandates, boosting demand for compliance testing. The surge in exports further accelerates packaging validation to meet international quality standards. Investments in advanced laboratories and partnerships with global testing firms strengthen regional capabilities. Asia-Pacific’s expanding packaged goods market positions it as the fastest-growing hub for packaging testing solutions.
Latin America
Latin America represents 6% of the packaging testing market, with Brazil and Mexico driving regional growth. Expanding food and beverage industries increase demand for durability, barrier, and microbiological testing. Regulatory bodies gradually implement stricter guidelines to align with global standards, enhancing testing requirements for consumer safety. The region’s growing e-commerce sector and export activities also contribute to demand for transit testing. However, limited infrastructure and cost barriers restrict adoption of advanced methods. Still, increasing foreign investments in packaging facilities and partnerships with international testing providers open opportunities for growth in the Latin American market.
Middle East & Africa
The Middle East & Africa (MEA) holds a 5% share of the global packaging testing market, supported by growing pharmaceutical and food industries. The UAE, Saudi Arabia, and South Africa lead adoption due to rising healthcare demands and expanding retail sectors. Import-driven economies require testing for packaging compliance with international trade standards. While regional infrastructure is still developing, multinational testing companies are entering partnerships to expand capabilities. Consumer demand for packaged food and safe medical products strengthens the need for reliable testing. Despite challenges in technology adoption, MEA presents steady growth potential through regulatory alignment and industrial expansion.
Market Segmentations:
By Type:
- Physical Testing
- Chemical Testing
By Technology:
- Physical Tests
- Spectroscopy and Photometric-based
By End User:
- Automotive
- Chemical
By Geography
- North America
- Europe
- Asia Pacific
- Latin America
- Middle East
- Africa
Competitive Landscape
The packaging testing market is highly competitive, featuring key players such as Eurofins Scientific, Campden BRI, ALS, Intertek Group, Merieux NutriSciences, Bureau Veritas, DDL, Element Materials Technology, Measur, and Ametek. The packaging testing market is characterized by strong competition, with companies focusing on technological innovation, global expansion, and regulatory compliance. Service providers invest in advanced laboratories and digital solutions such as automation, spectroscopy, and chromatography to improve accuracy and efficiency. The emphasis on sustainability drives demand for testing methods that validate biodegradable, recyclable, and eco-friendly packaging materials. Strategic collaborations, mergers, and acquisitions are common as firms aim to strengthen capabilities and expand into emerging markets. Growing regulatory pressures and rising consumer expectations for safe and durable packaging continue to shape the competitive landscape, encouraging ongoing innovation and service diversification.
Key Player Analysis
- Eurofins Scientific
- Campden BRI
- ALS
- Intertek Group
- Merieux NutriSciences
- Bureau Veritas
- DDL
- Element Materials Technology
- Measur
- Ametek
Recent Developments
- In September 2025, Mérieux NutriSciences completed its global acquisition of Bureau Veritas' food testing operations, integrating all countries involved in the transaction. The final acquisition in Peru added two laboratories, more than 220 employees, and expertise in seafood, aquaculture, and agribusiness.
- In March 2025, Food Safety Net Services (FSNS), a Certified Group company, opened a new testing laboratory in St. Louis, Missouri. This expansion adds to FSNS' North American network of more than 30 ISO-accredited laboratories, enhancing its food safety testing services for manufacturers and processors in the region.
- In March 2024, Bureau Veritas acquired OneTECH CORP and KOSTEC Co. Ltd., the South Korea-based companies. This acquisition has strengthened the position of the Bureau Veritas in testing and certification services for electrical and electronic consumer products in North and South-East Asia.
- In February 2024, UL Solutions opened its new Retail Center of Excellence in Lowell, Arkansas. This facility will help expand the capabilities of UL Solutions across several categories of products such as packaging, electronics, furniture, and sporting goods. In this facility, reliability testing and chemistry services are also available.
Report Coverage
The research report offers an in-depth analysis based on Type, Technology, End-User and Geography. It details leading market players, providing an overview of their business, product offerings, investments, revenue streams, and key applications. Additionally, the report includes insights into the competitive environment, SWOT analysis, current market trends, as well as the primary drivers and constraints. Furthermore, it discusses various factors that have driven market expansion in recent years. The report also explores market dynamics, regulatory scenarios, and technological advancements that are shaping the industry. It assesses the impact of external factors and global economic changes on market growth. Lastly, it provides strategic recommendations for new entrants and established companies to navigate the complexities of the market.
Future Outlook
- Demand for packaging testing will increase with stricter global regulatory standards.
- Sustainability goals will drive testing for biodegradable and recyclable packaging materials.
- Automation and digital technologies will streamline packaging testing processes.
- Growth in e-commerce will expand the need for transit and durability testing.
- Emerging markets will witness higher adoption due to expanding food and pharma industries.
- Investment in advanced laboratories will strengthen testing service capabilities.
- Companies will focus on multi-material packaging testing to support innovation.
- Partnerships and acquisitions will enhance global reach of testing providers.
- Consumer awareness of safety will accelerate demand for chemical migration testing.
- Packaging testing will become integral to supporting brand reputation and trust.
Request a Free Sample
Fill in your details and we'll send you a free sample report.
- Sample data tables & charts
- Research methodology
Need a Custom Version of This Report?
Tailor the scope, geography, or segments to your exact requirements.
- Custom geography or segment scope
- Direct access to our analyst team
Frequently Asked Questions
What is the current market size for the Packaging Testing Market, and what is its projected size in 2032?
At what Compound Annual Growth Rate is the Packaging Testing Market projected to grow between 2025 and 2032?
Which Packaging Testing Market segment held the largest share in 2024?
What are the primary factors fueling the growth of the Packaging Testing Market?
Who are the leading companies in the Packaging Testing Market?
Which region commanded the largest share of the Packaging Testing Market in 2024?
Table of Content
Chapter 1. Report Introduction
- 1.1 Report Description & Purpose
- 1.1.1 Report Title & Market Definition
- 1.1.2 Unique Selling Propositions (USP) & Key Differentiators
- 1.1.3 Value Proposition for Stakeholders
- 1.2 Research Objectives
- 1.2.1 Market Sizing Objectives (Volume & Revenue)
- 1.2.2 Segmentation Objectives
- 1.2.3 Competitive Intelligence Objectives
- 1.2.4 Forecast & Scenario Objectives
- 1.3 Report Scope
- 1.3.1 Packaging Testing Scope – Types & Subtypes Covered
- 1.3.2 Geographic Scope – Regions & Countries Covered
- 1.3.3 Historical Period, Base Year & Forecast Period (2024; forecast to 2032)
- 1.3.4 Inclusions & Exclusions
- 1.4 HS Code & Classification Framework
- 1.5 Currency, Units & Pricing Basis
- 1.6 Target Stakeholders
- 1.7 Limitations & Assumptions
Chapter 2. Executive Summary
- 2.1 Global Packaging Testing Market Snapshot
- 2.1.1 Market Size – Historical (2024) & Forecast (2024-2032) (2024: USD 19,272.81 million → 2032: USD 28,043.7 million)
- 2.1.2 Volume & Revenue – Global Totals
- 2.1.3 Key Market Highlights – Top Five Facts
- 2.2 Packaging Testing Market Segmentation Snapshot
- 2.2.1 Market Split by Region – 2024 vs. 2032
- 2.3 Competitive Snapshot
- 2.3.1 Top 10 Players by Revenue Share – 2024
- 2.3.2 Top 10 Players by Volume Share – 2024
- 2.3.3 Recent Strategic Developments (18-Month Summary)
- 2.4 Key Investment Highlights & Strategic Conclusions
Chapter 3. Packaging Testing Market Dynamics & Industry Analysis
- 3.1 Market Overview & Context
- 3.1.1 Packaging Testing Market Position in the Broader Automotive Value Chain
- 3.1.2 OEM vs. Replacement Market Dynamics
- 3.1.3 Market Maturity & Development Stage by Region
- 3.2 Packaging Testing Market Drivers
- 3.3 Packaging Testing Market Restraints & Challenges
- 3.4 Packaging Testing Market Opportunities
- 3.5 Porter's Five Forces Analysis
- 3.5.1 Threat of New Entrants
- 3.5.2 Bargaining Power of Suppliers
- 3.5.3 Bargaining Power of Buyers
- 3.5.4 Threat of Substitutes
- 3.5.5 Competitive Rivalry – Intensity Assessment
- 3.6 Packaging Testing Value Chain Analysis
- 3.6.1 Upstream – Raw Material/Input Suppliers
- 3.6.1.1 Raw Material/Input 1
- 3.6.1.2 Raw Material/Input 2
- 3.6.1.3 Raw Material/Input 3
- 3.6.2 Midstream – Production/Manufacturing/Service Delivery
- 3.6.2.1 Production/Process Overview
- 3.6.2.2 Key Facility Locations & Capacity by Manufacturer
- 3.6.3 Downstream – Distribution & End Consumer
- 3.6.3.1 Primary Channel – B2B/OEM
- 3.6.3.2 Secondary Channels – Dealer, Retail, Online, Direct
- 3.6.4 Value Chain Profitability Analysis
- 3.6.1 Upstream – Raw Material/Input Suppliers
- 3.7 PESTEL Analysis
- 3.7.1 Political Factors
- 3.7.2 Economic Factors
- 3.7.3 Social Factors
- 3.7.4 Technological Factors
- 3.7.5 Environmental Factors
- 3.7.6 Legal Factors
- 3.8 Packaging Testing Supply Chain Analysis
- 3.8.1 Raw Material/Input Supply Risk Assessment
- 3.8.2 Manufacturing Concentration Risk (Geographic Exposure)
- 3.8.3 Trade Disruption Impact Analysis
- 3.9 Regulatory & Policy Landscape
Note: The regulatory and policy landscape section covers regulations based on their applicability to the market, Packaging Testing category, geography, and scope of the study. Only regulatory frameworks with a material impact on operations, compliance, trade, sustainability, or market access are analyzed in detail.
Chapter 4. Key Investment Pockets & Opportunity Analysis
- 4.1 Packaging Testing Market Attractiveness Analysis
- 4.1.1 By Region – Investment Attractiveness Matrix (Volume × CAGR)
- 4.2 Absolute Revenue Growth Opportunity
- 4.2.1 By Region – Absolute USD Growth Through 2032
- 4.3 Incremental Volume Opportunity
- 4.3.1 By Region – Incremental Volume Through 2032
- 4.3.2 Segment – Incremental Volume
- 4.4 Emerging Submarket Opportunity Deep Dive (Subject to Applicability)
- 4.5 Emerging Market Opportunity Scorecards
- 4.5.1 United States
- 4.5.2 Europe
- 4.5.3 Asia
- 4.5.4 Middle East & Africa
Note: Emerging Market Opportunity Scorecards will be included based on relevance and strategic importance. Regions listed are indicative and may vary depending on data availability and market dynamics.
Chapter 5. Packaging Testing Import-Export Analysis & Trade Flows
- 5.1 Global Trade Overview
- 5.1.1 Global Export Value by Country (2024)
- 5.1.2 Global Export Volume by Country (2024)
- 5.1.3 Global Import Value by Country (2024)
- 5.1.4 Global Import Volume by Country (2024)
- 5.1.5 Net Trade Balance by Country (2024)
- 5.2 Export Analysis – Segment
- 5.2.1 Type 1 (HS Code)
- 5.2.2 Type 2 (HS Code)
- 5.2.3 Type 3 (HS Code)
- 5.2.4 Type 4 (HS Code)
- 5.2.5 Type 5 (HS Code)
- 5.3 Import Analysis – Segment
- 5.3.1 Type 1 (HS Code)
- 5.3.2 Type 2 (HS Code)
- 5.3.3 Type 3 (HS Code)
- 5.3.4 Type 4 (HS Code)
- 5.3.5 Type 5 (HS Code)
- 5.4 Average Unit Trade Prices
- 5.4.1 Average Export Price – Segment & Country
- 5.4.2 Average Import Price – Segment & Source Country
- 5.4.3 Price Trends (2024)
- 5.5 Key Trade Route Analysis
- 5.5.1 Trade Route 1
- 5.5.2 Trade Route 2
- 5.5.3 Trade Route 3
- 5.5.4 Trade Route 4
- 5.5.5 Trade Route 5
- 5.6 Trade Policy Impact Assessment
- 5.6.1 US Anti-Dumping & Section 301 Tariffs
- 5.6.2 EU Customs Union Impact
- 5.6.3 Major Free Trade Agreements
- 5.6.4 USMCA Rules of Origin
Note: Trade policy analysis will be included only where relevant to the Packaging Testing market.
Chapter 6. Competitive Landscape & Company Benchmarking
- 6.1 Packaging Testing Market Concentration & Structure
- 6.1.1 Herfindahl-Hirschman Index (HHI) – vs. 2024
- 6.1.2 Tier 1, Tier 2 & Tier 3 Market Structure
- 6.1.3 Global, Regional & Local Player Dynamics
- 6.2 Packaging Testing Market Share Analysis – 2024
- 6.2.1 Global Revenue Share by Company
- 6.2.2 Global Volume Share by Company
- 6.2.3 Regional Revenue Share
- 6.2.4 Market Share Evolution ( vs. 2024)
- 6.2.5 OEM Segment Share by Company
- 6.2.6 Replacement Segment Share by Company
- 6.3 Production/Delivery Capacity & Facility Analysis
- 6.3.1 Global Installed Capacity
- 6.3.2 Capacity Utilization Rates
- 6.3.3 Production/Output Volume
- 6.3.4 Facility Locations & Capacity Map
- 6.3.5 Planned Capacity Additions
- 6.4 Packaging Testing Competitive Benchmarking Matrix
- 6.4.1 Revenue, Volume, CAGR & Profitability Comparison
- 6.4.2 Channel Revenue Mix
- 6.4.3 Geographic Revenue Exposure
- 6.4.4 R&D Intensity
- 6.4.5 Sustainability Maturity
- 6.5 Strategic Developments in Packaging Testing (Last 24 Months)
- 6.5.1 Mergers, Acquisitions & Divestments
- 6.5.2 New Packaging Testing Launches
- 6.5.3 Facility Expansions
- 6.5.4 Strategic Alliances, Joint Ventures & Partnerships
- 6.5.5 Distribution Expansion & Market Entry
- 6.5.6 Sustainability & ESG Initiatives
- 6.6 Competitive Strategy Mapping
- 6.6.1 Leader, Challenger, Follower & Niche Classification
- 6.6.2 Pricing Strategy Comparison
- 6.6.3 Channel Strategy Matrix
Note: Strategic developments are included based on their materiality and the availability of reliable information.
Chapter 7. Global Packaging Testing Market – By Distribution Channel
- 7.1 Segment Overview
- 7.1.1 Volume & Revenue Split by Channel (2024 & 2032)
- 7.1.2 Channel Mix Evolution (2024-2032)
Chapter 8. Regional Market Analysis – Global Overview
- 8.1 Global Regional Overview
- 8.1.1 Regional Volume Share
- 8.1.2 Regional Revenue Share
- 8.1.3 Regional Volume by Region
- 8.1.4 Regional Revenue by Region
- 8.1.5 Regional Forecast Through 2032
- 8.2 Cross-Regional Segment Analysis
- 8.2.1 By Distribution Channel
- 8.2.2 By Brand/Price Tier
Chapter 9. North America Packaging Testing Market
- 9.1 United States
- 9.2 Canada
- 9.3 Mexico
Chapter 10. Europe Packaging Testing Market
- 10.1 Germany
- 10.2 France
- 10.3 Italy
- 10.4 United Kingdom
- 10.5 Spain
- 10.6 Poland
- 10.7 Russia
- 10.8 Netherlands
- 10.9 Belgium
- 10.10 Sweden
- 10.11 Denmark
- 10.12 Norway
- 10.13 Rest of Europe
Chapter 11. Asia Pacific Packaging Testing Market
- 11.1 China
- 11.2 India
- 11.3 Japan
- 11.4 South Korea
- 11.5 Thailand
- 11.6 Indonesia
- 11.7 Vietnam
- 11.8 Malaysia
- 11.9 Australia
- 11.10 Rest of Asia Pacific
Chapter 12. Latin America Packaging Testing Market
- 12.1 Brazil
- 12.2 Argentina
- 12.3 Colombia
- 12.4 Chile
- 12.5 Rest of Latin America
Chapter 13. Middle East Packaging Testing Market
- 13.1 Saudi Arabia
- 13.2 United Arab Emirates
- 13.3 Turkey
- 13.4 Israel
- 13.5 Iran
- 13.6 Rest of the Middle East
Chapter 14. Africa Packaging Testing Market
- 14.1 South Africa
- 14.2 Egypt
- 14.3 Nigeria
- 14.4 Morocco
- 14.5 Rest of Africa
Chapter 15. Packaging Testing Company Profiles
- 15.1 [Company 01]
- 15.1.1 Company Overview
- 15.1.2 Key Management Personnel
- 15.1.3 Products & Services Portfolio
- 15.1.4 Financial Performance
- 15.1.5 Key Market Focus & Geographic Presence
- 15.1.6 Recent Developments & Strategic Initiatives
Note: The company profile list is preliminary and may change based on research findings, market developments, data availability, and client requirements.
Chapter 16. Appendices
- Appendix A – List of Abbreviations & Acronyms
- Appendix B – Industry Classification Code Reference – Full Series
- Appendix C – Production & Capacity Data Tables
- Appendix D – End-Use & Demand Base Tables
- Appendix E – Consumption & Replacement Rate Assumptions
- Appendix F – ASP Reference Tables
- Appendix G – Manufacturing & Facility Database
- Appendix H – Import-Export Data Tables
- Appendix I – Regulatory Summary Tables
- Appendix J – Primary Research Participant List (Anonymized)
- Appendix K – Primary Research Questionnaire Framework
- Appendix L – Data Sources & Bibliography
- Appendix M – Market Size Divergence & Source Comparison
Chapter 17. Research Methodology
- 17.1 Research Framework & Philosophy
- 17.2 Secondary Research – Sources, Hierarchy & Data Extraction
- 17.3 Data Modeling – Bottom-Up & Top-Down Market Sizing
- 17.4 Primary Research – Stakeholder Framework, LOI & Sample Sizes
- 17.5 Forecast Methodology – Regression, Scenario & Sensitivity Analysis
- 17.6 Quality Control – Four-Layer Validation Framework
- 17.7 Limitations & Standard Assumptions
- 17.8 Disclaimer
