Home » Food & Beverage » Pea Proteins Market

Pea Proteins Market

Pea Proteins Market By Type (Isolate, Concentrate, Textured); By Application (Food & Beverages, Nutraceuticals, Animal Feed, Personal Care & Cosmetics, Others); By Form (Dry, Liquid); By Distribution Channel (Online, Offline) – Growth, Share, Opportunities & Competitive Analysis, 2024 – 2032

Price: $4699

Published: | Report ID: 8970 | Report Format : Excel, PDF
REPORT ATTRIBUTE DETAILS
Historical Period  2020-2023
Base Year  2024
Forecast Period  2025-2032
Pea Proteins Market Size 2024  USD 2,229.15 Million
Pea Proteins Market, CAGR  12.25%
 Pea Proteins Market Size 2032  USD 5,618.92 Million

Market Overview:

The Global Pea Proteins Market is projected to grow from USD 2,229.15 million in 2024 to an estimated USD 5,618.92 million by 2032, with a compound annual growth rate (CAGR) of 12.25% from 2024 to 2032.

The growth of the global pea protein market is largely driven by the rising adoption of health and wellness trends, as consumers increasingly seek nutrient-rich, allergen-free protein sources. Pea protein, known for being high in essential amino acids and free from soy, gluten, and dairy, appeals to a broad spectrum of health-conscious individuals. Additionally, the sustainability of pea cultivation, which requires less water and emits fewer greenhouse gases than animal-based protein production, aligns with the global shift toward environmentally responsible food systems. The rising popularity of vegan, vegetarian, and flexitarian diets is further accelerating demand, with pea protein serving as a suitable alternative for those avoiding animal or soy products. Furthermore, innovations in the food industry—such as the development of meat substitutes, dairy-free beverages, and sports nutrition products—are expanding the functional applications of pea protein, thereby enhancing its market appeal.

Regionally, North America dominates the global pea protein market due to its well-developed food processing industry, strong presence of key players, and a population highly engaged in health and wellness trends. Europe follows closely, with growing demand stemming from an expanding vegan population, increasing awareness about food sustainability, and supportive regulatory frameworks that encourage plant-based diets. The Asia-Pacific region is anticipated to witness the highest growth rate, driven by rapid urbanization, rising disposable incomes, and a noticeable shift toward healthier food choices. In particular, countries such as China, Japan, and India are emerging as significant markets, supported by changing dietary preferences and the introduction of innovative plant-based food products. Meanwhile, Latin America and the Middle East & Africa are gradually adopting pea protein solutions, as increasing awareness about nutrition and expanding food and beverage industries create new opportunities for growth in these developing regions.

Design Element 2

Access crucial information at unmatched prices!

Request your sample report today & start making informed decisions powered by Credence Research!

Download Sample

CTA Design Element 3

Market Insights:

  • The global pea proteins market is projected to grow from USD 2,229.15 million in 2024 to USD 5,618.92 million by 2032, at a CAGR of 12.25%.
  • Increasing health awareness and the rise in plant-based diets are key growth drivers, with pea protein offering a clean-label, allergen-free alternative to animal and soy proteins.
  • The market benefits from pea protein’s sustainable cultivation, which uses less water and emits fewer greenhouse gases, supporting eco-conscious consumer trends.
  • Pea protein’s hypoallergenic nature and functional properties enable its application across meat substitutes, dairy-free products, and sports nutrition.
  • North America leads the global market due to strong consumer awareness and a developed food processing sector, followed by Europe with regulatory support for plant-based eating.
  • Asia-Pacific is the fastest-growing region, driven by urbanization, dietary shifts, and rising disposable incomes in countries like China and India.
  • High production costs and flavor limitations present challenges, requiring continuous R&D investment to improve taste, texture, and processing efficiency.

Pea Proteins Market

Market Drivers:

Rising Health Awareness and Demand for Plant-Based Proteins

The growing global focus on health and nutrition has significantly influenced consumer preferences, driving demand for clean-label and plant-based food products. As individuals become more conscious of the long-term impacts of diet on health, protein-rich foods derived from non-animal sources have gained substantial traction. Pea protein, recognized for its high nutritional value, allergen-free nature, and digestibility, is increasingly favored among health-conscious consumers. This shift is particularly strong among populations adopting vegan, vegetarian, or flexitarian lifestyles, where pea protein serves as a reliable substitute for traditional animal-based proteins without compromising on essential amino acid content.

Sustainability and Environmental Impact Reduction

The global emphasis on environmental sustainability has further fueled the growth of the pea protein market. For instance, compared to animal farming, pea cultivation requires less land, water, and emits fewer greenhouse gases, making it a sustainable protein alternative. Consumers and food manufacturers are increasingly aligning with eco-friendly practices, and the adoption of pea protein supports this shift. The sustainability advantage is particularly important for food companies aiming to reduce their carbon footprint while catering to the rising demand for ethical and environmentally responsible food products. As climate-conscious initiatives continue to shape the food industry, plant-based ingredients like pea protein are expected to play an increasingly critical role.

Allergen-Free and Functional Benefits

Pea protein’s hypoallergenic properties contribute to its appeal, particularly among individuals with sensitivities to common allergens such as dairy, soy, and gluten. Unlike many other plant-based proteins, pea protein does not pose a high risk of allergic reactions, broadening its usability across a wide consumer base. Additionally, its functional attributes—such as emulsification, gelling, and water-binding capabilities—make it highly suitable for a variety of food and beverage applications. These characteristics enable food manufacturers to formulate a diverse range of products including meat analogs, dairy alternatives, protein bars, and beverages, thereby expanding the market reach of pea protein across multiple sectors.

Expansion of the Functional Foods and Sports Nutrition Sectors

The rapid expansion of the functional foods and sports nutrition segments has created robust growth opportunities for the global pea protein market. Consumers are increasingly seeking products that offer health benefits beyond basic nutrition, such as muscle recovery, weight management, and improved metabolic health. Pea protein, with its high branched-chain amino acid (BCAA) content, has emerged as a valuable ingredient in protein powders, meal replacements, and energy supplements. For instance, Premier Protein’s Plant Protein Powder, made from pea protein, is specifically formulated to support muscle development and endurance, offering a lactose-free and cholesterol-free alternative for consumers with dietary restrictions. Its ability to support muscle development and endurance without the drawbacks of lactose intolerance or cholesterol makes it an ideal choice for athletes and fitness enthusiasts. This growing consumer base continues to propel the demand for high-quality, plant-based protein solutions.

Market Trends:

Innovation in Food and Beverage Applications

The global pea protein market is witnessing notable trends in the diversification of applications across the food and beverage sector. Manufacturers are leveraging the neutral taste, high protein content, and functional versatility of pea protein to develop innovative plant-based alternatives. These include dairy-free yogurts, cheese, and ice cream, along with an expanding range of ready-to-drink nutritional beverages and plant-based coffee creamers. For instance, Daiya Foods has launched pea protein isolate-based products in the dairy category (5 products), meal centers (3 products), and sauces and seasonings (1 product), while Genuine Health introduced 13 new pea protein isolate snack products in 2023. With technological advancements in food processing, pea protein is being more effectively incorporated into products with enhanced texture and mouthfeel, thereby improving consumer acceptance. The expansion of clean-label product portfolios by major food brands is further reinforcing the use of pea protein in mainstream retail and health-focused consumer segments.

Rising Investment in Research and Product Development

Market players are significantly investing in research and development to enhance the nutritional and sensory attributes of pea protein-based products. Companies are exploring hybrid formulations by combining pea protein with other plant proteins such as rice or oat to achieve a complete amino acid profile while minimizing off-flavors. For example, in 2024, Rougette introduced new multinational pea protein ingredients, including NUTRALYS® H85 (hydrolysate) and NUTRALYS® T Pea variants, illustrating the sector’s focus on innovation in texture, taste, and nutritional profile. Novel processing techniques, including enzymatic hydrolysis and fermentation, are being adopted to improve solubility, digestibility, and flavor profiles. These advancements are allowing manufacturers to target not only vegan consumers but also flexitarians and individuals looking to reduce their intake of animal-based products. The competitive landscape is also witnessing the emergence of startups focused on developing next-generation protein solutions that meet evolving consumer preferences.

Mainstreaming of Plant-Based Diets in Developing Markets

While North America and Europe have traditionally led plant-based food adoption, the trend is increasingly gaining traction in emerging markets such as Southeast Asia, Latin America, and the Middle East. Growing awareness of the health and environmental benefits of plant-based diets, coupled with urbanization and shifting lifestyle habits, is driving the demand for pea protein in these regions. Governments and local manufacturers are also promoting plant-based dietary options through educational campaigns and product accessibility. As a result, domestic brands in these markets are beginning to launch their own pea protein-based snacks, bakery items, and fortified foods, tapping into a growing middle-class demographic that is becoming more nutrition-focused.

Expansion of E-commerce and Direct-to-Consumer Channels

The rapid growth of e-commerce platforms and direct-to-consumer (DTC) channels has opened new avenues for market penetration, particularly for niche pea protein products. With consumers increasingly preferring to shop online for health and wellness items, brands are capitalizing on digital platforms to market and sell their plant-based protein products. Subscription-based models, influencer marketing, and personalized nutrition offerings are enhancing consumer engagement and repeat purchases. The convenience and accessibility of these platforms have been instrumental in expanding the visibility and reach of pea protein products, especially in regions where traditional retail infrastructure may still be developing.

Market Challenges Analysis:

High Production Costs and Supply Chain Constraints

One of the major restraints affecting the growth of the global pea protein market is the high cost of production. For instance, extracting high-quality protein from peas involves multiple processing stages, such as dry fractionation and wet extraction, which are capital-intensive and energy-consuming. These processes often require advanced equipment and skilled labor, adding to operational expenses. Moreover, the volatility in raw material prices, driven by seasonal fluctuations in pea cultivation and limited geographical supply concentration, leads to inconsistent availability and pricing. As a result, manufacturers may find it challenging to maintain price competitiveness compared to soy, whey, or other more established protein sources.

Flavor, Texture, and Functional Limitations

Another significant challenge lies in addressing the sensory limitations associated with pea protein. Despite its nutritional value, pea protein tends to exhibit a beany or earthy flavor profile that may not appeal to all consumers, especially in applications requiring subtle taste characteristics. Additionally, its solubility and texture properties can be suboptimal when compared to other protein alternatives, posing formulation challenges for food and beverage producers. This can limit its usage in certain categories, such as clear beverages or creamy dairy analogs, unless enhanced through complex processing techniques or blended with other proteins. These technical hurdles require further innovation and investment, which can slow down product development cycles and limit mass adoption.

Market Opportunities:

The global pea protein market presents significant opportunities driven by the accelerating shift toward personalized nutrition and functional health solutions. As consumers increasingly seek products tailored to their dietary preferences, health goals, and ethical considerations, manufacturers have a unique opportunity to innovate with pea protein across diverse product categories. The high nutritional profile of pea protein, including its richness in essential amino acids and digestibility, positions it well for inclusion in customized dietary supplements, meal replacements, and medical nutrition products. Moreover, its hypoallergenic nature enhances its suitability for broad demographic segments, including children, seniors, and individuals with specific dietary restrictions. This opens the door for companies to develop specialized formulations that address health conditions such as muscle loss, metabolic disorders, or cardiovascular health, using pea protein as a primary ingredient.

Additionally, the expansion of plant-based product lines in sectors such as pet food, sports nutrition, and infant nutrition is generating untapped opportunities for pea protein integration. With global regulatory bodies increasingly recognizing plant proteins as viable alternatives in regulated food categories, companies can capitalize on this acceptance to scale their offerings. The growing emphasis on sustainable sourcing, carbon footprint reduction, and clean-label ingredients also aligns strongly with the environmental benefits of pea cultivation. As retailers and foodservice providers respond to demand for sustainable and transparent sourcing, brands incorporating pea protein have the potential to gain competitive advantage. These factors collectively make the pea protein market a fertile ground for investment and innovation across both established and emerging application areas.

Market Segmentation Analysis:

The global pea proteins market is segmented based on type, application, form, and distribution channel, each contributing uniquely to the market’s overall growth.

By type, the isolate segment holds the largest share due to its high protein concentration and neutral flavor, making it highly suitable for protein supplements, beverages, and meat substitutes. Concentrate pea proteins, with moderate protein content and cost-effectiveness, are widely used in bakery and snack products. Textured pea proteins are gaining momentum in meat alternatives, providing desirable texture and chewiness for plant-based formulations.

By application, food and beverages dominate the market, driven by the surge in demand for plant-based alternatives such as dairy-free milk, protein bars, and vegan meat. The nutraceuticals segment is expanding rapidly, supported by the rising popularity of clean-label dietary supplements. Animal feed, especially for pets and aquaculture, represents a growing application due to its digestibility and sustainable sourcing. Personal care and cosmetics utilize pea proteins for their moisturizing and conditioning properties, while the ‘others’ segment includes emerging uses in biodegradable packaging and bioplastics.

By form, dry pea proteins lead due to ease of handling, storage, and incorporation into a wide range of food products. Liquid pea proteins are preferred for beverage applications and certain industrial uses.

By distribution channel, offline channels remain dominant due to established retail and distribution networks. However, the online segment is witnessing rapid growth, driven by the increasing adoption of e-commerce and direct-to-consumer models that offer greater product visibility and convenience.

Segmentation:

By Type

  • Isolate
  • Concentrate
  • Textured

By Application

  • Food & Beverages
  • Nutraceuticals
  • Animal Feed
  • Personal Care & Cosmetics
  • Others

By Form

  • Dry
  • Liquid

By Distribution Channel

  • Online
  • Offline

Regional Analysis:

North America holds the largest share of the global pea protein market, accounting for 37.5% of total revenue in 2024. This dominance is attributed to the region’s well-established plant-based food industry, high consumer awareness regarding health and sustainability, and strong presence of key market players. The United States, in particular, is a leading contributor, with widespread availability of pea protein-based products across retail and foodservice channels. The growing prevalence of vegan and flexitarian diets, combined with the rising demand for clean-label and allergen-free food alternatives, continues to support market expansion across North America.

Europe represents the second-largest market, capturing 29.4% of the global pea protein market in 2024. The region’s growth is driven by increasing regulatory support for plant-based diets, rising consumer preference for sustainable food sources, and a significant vegan population. Countries such as Germany, the United Kingdom, and the Netherlands are at the forefront of this movement, with retailers and manufacturers actively introducing innovative pea protein products. Government initiatives promoting health-conscious eating and carbon-neutral food production have further accelerated the adoption of plant-based ingredients. The expanding sports nutrition and functional food segments also contribute to rising pea protein demand in the region.

The Asia-Pacific region is emerging as the fastest-growing market, currently holding a 21.8% share of global revenue. Rapid urbanization, increasing disposable incomes, and a growing middle-class population are fueling the demand for nutritious, plant-based foods. Countries such as China, India, Japan, and Australia are witnessing a surge in consumer awareness regarding sustainable nutrition, which has led to higher adoption of pea protein in both traditional and modern food formulations. Local manufacturers are also investing in product diversification to cater to evolving dietary trends, especially among younger demographics seeking high-protein, low-fat food alternatives.

Latin America and the Middle East & Africa collectively account for 11.3% of the global pea protein market. While adoption in these regions is still at a nascent stage, increasing awareness of plant-based nutrition and expanding health and wellness trends are gradually driving demand. Brazil and South Africa are key growth markets, supported by improvements in retail infrastructure and growing consumer access to functional food products. With continued investment in marketing, product localization, and supply chain development, these regions are expected to offer new opportunities for pea protein manufacturers in the coming years.

Key Player Analysis:

  • Roquette Frères
  • Cargill, Inc.
  • DuPont (IFF)
  • Ingredion Incorporated
  • Axiom Foods, Inc.
  • Burcon NutraScience Corporation
  • Cosucra Groupe Warcoing
  • Shandong Jianyuan Group
  • Fenchem Biotek Ltd.
  • The Scoular Company

Competitive Analysis:

The global pea protein market is moderately consolidated, with several key players competing through innovation, strategic partnerships, and capacity expansion. Major companies such as Roquette Frères, Cargill, Ingredion Incorporated, Glanbia PLC, and Puris are leading the market by offering diversified pea protein product portfolios catering to various applications. These companies are focusing on improving functional properties, expanding geographic reach, and investing in sustainable sourcing practices to strengthen their market position. Startups and regional manufacturers are also entering the landscape with niche offerings, particularly in sports nutrition and clean-label segments. Mergers, acquisitions, and joint ventures are common strategies adopted to enhance production capabilities and meet growing global demand. Additionally, continuous investment in R&D is enabling players to address taste and texture challenges, thereby improving consumer acceptance. As competition intensifies, brand differentiation, vertical integration, and alignment with environmental standards will remain critical success factors in the evolving pea protein market.

Recent Developments:

  • In March 2025, Daily Harvest introduced its Organic Pea Protein Powder, designed to offer a clean, allergen-friendly protein boost for smoothies and breakfast bowls. This new product contains only USDA-certified organic pea protein, free from additives, fillers, artificial sweeteners, seed oils, and preservatives, and provides 24 grams of plant-based protein per serving. The powder is tested for heavy metals, is highly digestible, and is suitable for those with common allergies, continuing Daily Harvest’s commitment to clean, simple ingredients and meeting customer demand for high-quality, convenient protein options.
  • In February 2024, Roquette expanded its NUTRALYS® plant protein range by launching four new multifunctional pea protein ingredients: NUTRALYS® Pea F853M (isolate), NUTRALYS® H85 (hydrolysate), NUTRALYS® T Pea 700FL (textured), and NUTRALYS® T Pea 700M (textured). These ingredients are designed to improve taste, texture, and application versatility in plant-based foods and high-protein nutritional products, enabling food manufacturers to develop innovative meat alternatives, nutritional bars, protein drinks, and dairy alternatives. This launch reflects Roquette’s ongoing investment in plant protein innovation and its mission to support food manufacturers in creating appealing plant-based products.
  • In January 2024, Ingredion and Lantmännen announced a long-term partnership to develop and commercialize a portfolio of pea protein isolates for the European market. This collaboration aims to leverage Ingredion’s expertise in process engineering and product development alongside Lantmännen’s vertically integrated production capabilities, with the goal of delivering high-quality, sustainably sourced pea protein isolates that meet the evolving needs of the global market.

Market Concentration & Characteristics:

The global pea protein market exhibits a moderately concentrated structure, characterized by the dominance of a few multinational corporations alongside a multitude of emerging and specialized firms. Leading players such as Roquette Frères, Cargill, Glanbia, and Ingredion command significant market shares, leveraging extensive distribution networks and robust research and development capabilities to meet the escalating demand for plant-based proteins. These industry leaders focus on enhancing product offerings and expanding their global presence to maintain a competitive edge. ​ Simultaneously, numerous small and medium-sized enterprises contribute to the market’s dynamism by introducing innovative products and targeting niche segments. These agile firms often specialize in specific applications or regional markets, fostering diversity and stimulating competition within the industry. The interplay between established corporations and emerging companies cultivates an environment conducive to continuous innovation, ensuring a broad spectrum of high-quality, plant-based protein options for consumers. This market composition not only supports stability but also encourages the development of products that align with evolving consumer preferences for health-conscious and environmentally sustainable dietary choices. ​

Shape Your Report to Specific Countries or Regions & Enjoy 30% Off!

Report Coverage:

The research report offers an in-depth analysis based on Type, Application, Form and Distribution Channel. It details leading market players, providing an overview of their business, product offerings, investments, revenue streams, and key applications. Additionally, the report includes insights into the competitive environment, SWOT analysis, current market trends, as well as the primary drivers and constraints. Furthermore, it discusses various factors that have driven market expansion in recent years. The report also explores market dynamics, regulatory scenarios, and technological advancements that are shaping the industry. It assesses the impact of external factors and global economic changes on market growth. Lastly, it provides strategic recommendations for new entrants and established companies to navigate the complexities of the market.

Future Outlook:

  • The global pea protein market is expected to continue growing at a strong CAGR, driven by increasing demand for sustainable and allergen-free protein sources.
  • Rising investments in food technology will enhance pea protein’s texture, solubility, and flavor profile, expanding its use in mainstream food products.
  • Innovations in hybrid protein formulations will improve amino acid profiles and broaden application in clinical nutrition and sports supplements.
  • Expansion of plant-based diets in developing economies will open new geographic growth avenues, particularly in Asia-Pacific and Latin America.
  • E-commerce and direct-to-consumer platforms will drive faster market penetration and brand diversification in niche product categories.
  • Strategic collaborations between food manufacturers and protein producers will accelerate product development and scale-up efforts.
  • Regulatory support for plant-based food production will encourage market entry and ensure cleaner supply chains.
  • Advances in vertical farming and sustainable pea cultivation will stabilize supply and reduce production costs.
  • The use of pea protein in non-food sectors like cosmetics and pet nutrition will create supplementary growth streams.
  • Brand focus on transparency and clean labeling will shape consumer loyalty and influence long-term market dynamics.

CHAPTER NO. 1 : INTRODUCTION 25
1.1.1. Report Description 25
Purpose of the Report 25
USP & Key Offerings 25
1.1.2. Key Benefits for Stakeholders 25
1.1.3. Target Audience 26
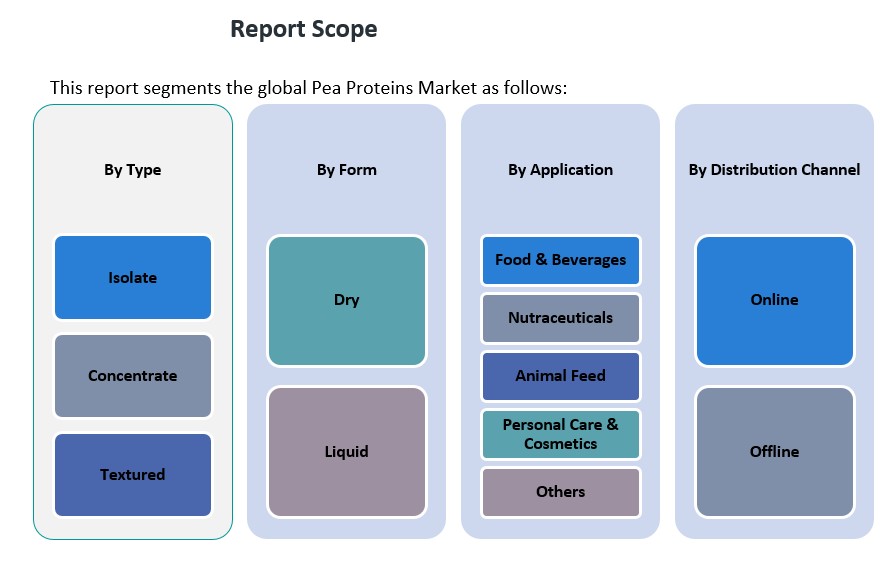
1.1.4. Report Scope 26
1.1.5. Regional Scope 27
CHAPTER NO. 2 : EXECUTIVE SUMMARY 28
2.1. Pea Proteins Market Snapshot 28
2.1.1. Global Pea Proteins Market, 2018 – 2032 (USD Million) 29
CHAPTER NO. 3 : GEOPOLITICAL CRISIS IMPACT ANALYSIS 30
3.1. Russia-Ukraine and Israel-Palestine War Impacts 30
CHAPTER NO. 4 : PEA PROTEINS MARKET – INDUSTRY ANALYSIS 31
4.1. Introduction 31
4.2. Market Drivers 32
4.2.1. Growing consumer preference for plant-based protein alternatives 32
4.2.2. Rising demand from the functional food and sports nutrition sector 33
4.3. Market Restraints 34
4.3.1. Fluctuations in raw material prices 34
4.4. Market Opportunities 35
4.4.1. Increasing investment in pea protein-based innovations 35
4.5. Porter’s Five Forces Analysis 36
4.6. Value Chain Analysis 37
4.7. Buying Criteria 38
CHAPTER NO. 5 : IMPORT EXPORT ANALYSIS 39
5.1. Import Analysis by Region 39
5.1.1. Global Pea Proteins Market Import Volume/Revenue, By Region, 2018 – 2023 39
5.2. Export Analysis by Region 40
5.2.1. Global Pea Proteins Market Export Volume/Revenue, By Region, 2018 – 2023 40
CHAPTER NO. 6 : DEMAND SUPPLY ANALYSIS 41
6.1. Demand Analysis by Region 41
6.1.1. Global Pea Proteins Market Demand Volume/Revenue, By Region, 2018 – 2023 41
6.2. Supply Analysis by Region 42
6.2.1. Global Pea Proteins Market Supply Volume/Revenue, By Region, 2018 – 2023 42
CHAPTER NO. 7 : PRODUCTION ANALYSIS 43
7.1. Production Analysis by Region 43
7.1.1. Global Pea Proteins Market Production Volume/Revenue, By Region, 2018 – 2023 43
CHAPTER NO. 8 : PRICE ANALYSIS 44
8.1. Price Analysis by Region 44
8.1.1. Global Pea Proteins Market Price, By Region, 2018 – 2023 44
8.1.2. Global Type Market Price, By Region, 2018 – 2023 44
8.2. Price Analysis by Type 45
8.2.1. Global Pea Proteins Market Price, By Type, 2018 – 2023 45
8.2.2. Global Type Market Price, By Type, 2018 – 2023 45
CHAPTER NO. 9 : RAW MATERIALS ANALYSIS 46
9.1. Key Raw Materials and Suppliers 46
9.2. Key Raw Materials Price Trend 46
CHAPTER NO. 10 : MANUFACTURING COST ANALYSIS 47
10.1. Manufacturing Cost Analysis 47
10.2. Manufacturing Process 47
CHAPTER NO. 11 : ANALYSIS COMPETITIVE LANDSCAPE 48
11.1. Company Market Share Analysis – 2023 48
11.1.1. Global Pea Proteins Market: Company Market Share, by Volume, 2023 48
11.1.2. Global Pea Proteins Market: Company Market Share, by Revenue, 2023 49
11.1.3. Global Pea Proteins Market: Top 6 Company Market Share, by Revenue, 2023 49
11.1.4. Global Pea Proteins Market: Top 3 Company Market Share, by Revenue, 2023 50
11.2. Global Pea Proteins Market Company Volume Market Share, 2023 51
11.3. Global Pea Proteins Market Company Revenue Market Share, 2023 52
11.4. Company Assessment Metrics, 2023 52
11.4.1. Stars 52
11.4.2. Emerging Leaders 52
11.4.3. Pervasive Players 52
11.4.4. Participants 52
11.5. Start-ups /SMEs Assessment Metrics, 2023 52
11.5.1. Progressive Companies 52
11.5.2. Responsive Companies 53
11.5.3. Dynamic Companies 53
11.5.4. Starting Blocks 53
11.6. Strategic Developments 54
11.6.1. Acquisitions & Mergers 54
New Product Launch 54
Regional Expansion 54
11.7. Key Players Product Matrix 55
CHAPTER NO. 12 : PESTEL & ADJACENT MARKET ANALYSIS 56
12.1. PESTEL 56
12.1.1. Political Factors 56
12.1.2. Economic Factors 56
12.1.3. Social Factors 56
12.1.4. Technological Factors 56
12.1.5. Environmental Factors 56
12.1.6. Legal Factors 56
12.2. Adjacent Market Analysis 56
CHAPTER NO. 13 : PEA PROTEINS MARKET – BY TYPE SEGMENT ANALYSIS 57
13.1. Pea Proteins Market Overview, by Type Segment 57
13.1.1. Pea Proteins Market Revenue Share, By Type, 2023 & 2032 58
13.1.2. Pea Proteins Market Attractiveness Analysis, By Type 59
13.1.3. Incremental Revenue Growth Opportunity, by Type, 2024 – 2032 59
13.1.4. Pea Proteins Market Revenue, By Type, 2018, 2023, 2027 & 2032 60
13.2. Isolate 61
13.2.1. Global Isolate Pea Proteins Market Revenue, By Region, 2018 – 2023 (USD Million) 62
13.2.2. Global Isolate Pea Proteins Market Revenue, By Region, 2024 – 2032 (USD Million) 62
13.3. Concentrate 63
13.3.1. Global Concentrate Pea Proteins Market Revenue, By Region, 2018 – 2023 (USD Million) 64
13.3.2. Global Concentrate Pea Proteins Market Revenue, By Region, 2024 – 2032 (USD Million) 64
13.4. Textured 65
13.4.1. Global Textured Pea Proteins Market Revenue, By Region, 2018 – 2023 (USD Million) 66
13.4.2. Global Textured Pea Proteins Market Revenue, By Region, 2024 – 2032 (USD Million) 66
CHAPTER NO. 14 : PEA PROTEINS MARKET – BY APPLICATION SEGMENT ANALYSIS 67
14.1. Pea Proteins Market Overview, by Application Segment 67
14.1.1. Pea Proteins Market Revenue Share, By Application, 2023 & 2032 68
14.1.2. Pea Proteins Market Attractiveness Analysis, By Application 69
14.1.3. Incremental Revenue Growth Opportunity, by Application, 2024 – 2032 69
14.1.4. Pea Proteins Market Revenue, By Application, 2018, 2023, 2027 & 2032 70
14.2. Food & Beverages 71
14.2.1. Global Food & Beverages Pea Proteins Market Revenue, By Region, 2018 – 2023 (USD Million) 72
14.2.2. Global Food & Beverages Pea Proteins Market Revenue, By Region, 2024 – 2032 (USD Million) 72
14.3. Nutraceuticals 73
14.3.1. Global Nutraceuticals Pea Proteins Market Revenue, By Region, 2018 – 2023 (USD Million) 74
14.3.2. Global Nutraceuticals Pea Proteins Market Revenue, By Region, 2024 – 2032 (USD Million) 74
14.4. Animal Feed 75
14.4.1. Global Animal Feed Pea Proteins Market Revenue, By Region, 2018 – 2023 (USD Million) 76
14.4.2. Global Animal Feed Pea Proteins Market Revenue, By Region, 2024 – 2032 (USD Million) 76
14.5. Personal Care & Cosmetics 77
14.5.1. Global Personal Care & Cosmetics Pea Proteins Market Revenue, By Region, 2018 – 2023 (USD Million) 78
14.5.2. Global Personal Care & Cosmetics Pea Proteins Market Revenue, By Region, 2024 – 2032 (USD Million) 78
14.6. Others 79
14.6.1. Global Others Pea Proteins Market Revenue, By Region, 2018 – 2023 (USD Million) 80
14.6.2. Global Others Pea Proteins Market Revenue, By Region, 2024 – 2032 (USD Million) 80
CHAPTER NO. 15 : PEA PROTEINS MARKET – BY FORM SEGMENT ANALYSIS 81
15.1. Pea Proteins Market Overview, by Form Segment 81
15.1.1. Pea Proteins Market Revenue Share, By Form, 2023 & 2032 82
15.1.2. Pea Proteins Market Attractiveness Analysis, By Form 83
15.1.3. Incremental Revenue Growth Opportunity, by Form, 2024 – 2032 83
15.1.4. Pea Proteins Market Revenue, By Form, 2018, 2023, 2027 & 2032 84
15.2. Dry 85
15.2.1. Global Dry Pea Proteins Market Revenue, By Region, 2018 – 2023 (USD Million) 86
15.2.2. Global Dry Pea Proteins Market Revenue, By Region, 2024 – 2032 (USD Million) 86
15.3. Liquid 87
15.3.1. Global Liquid Pea Proteins Market Revenue, By Region, 2018 – 2023 (USD Million) 88
15.3.2. Global Liquid Pea Proteins Market Revenue, By Region, 2024 – 2032 (USD Million) 88
CHAPTER NO. 16 : PEA PROTEINS MARKET – BY DISTRIBUTION CHANNEL SEGMENT ANALYSIS 89
16.1. Pea Proteins Market Overview, by Distribution Channel Segment 89
16.1.1. Pea Proteins Market Revenue Share, By Distribution Channel, 2023 & 2032 90
16.1.2. Pea Proteins Market Attractiveness Analysis, By Distribution Channel 91
16.1.3. Incremental Revenue Growth Opportunity, by Distribution Channel, 2024 – 2032 91
16.1.4. Pea Proteins Market Revenue, By Distribution Channel, 2018, 2023, 2027 & 2032 92
16.2. Online 93
16.2.1. Global Online Pea Proteins Market Revenue, By Region, 2018 – 2023 (USD Million) 94
16.2.2. Global Online Pea Proteins Market Revenue, By Region, 2024 – 2032 (USD Million) 94
16.3. Offline 95
16.3.1. Global Offline Pea Proteins Market Revenue, By Region, 2018 – 2023 (USD Million) 96
16.3.2. Global Offline Pea Proteins Market Revenue, By Region, 2024 – 2032 (USD Million) 96
CHAPTER NO. 17 : PEA PROTEINS MARKET – REGIONAL ANALYSIS 97
17.1. Pea Proteins Market Overview, by Regional Segments 97
17.2. Region 98
17.2.1. Global Pea Proteins Market Revenue Share, By Region, 2023 & 2032 98
17.2.2. Pea Proteins Market Attractiveness Analysis, By Region 99
17.2.3. Incremental Revenue Growth Opportunity, by Region, 2024 – 2032 99
17.2.4. Pea Proteins Market Revenue, By Region, 2018, 2023, 2027 & 2032 100
17.2.5. Global Pea Proteins Market Revenue, By Region, 2018 – 2023 (USD Million) 101
17.2.6. Global Pea Proteins Market Revenue, By Region, 2024 – 2032 (USD Million) 101
17.3. Type 102
17.3.1. Global Pea Proteins Market Revenue, By Type, 2018 – 2023 (USD Million) 102
17.4. Global Pea Proteins Market Revenue, By Type, 2024 – 2032 (USD Million) 102
17.5. Application 103
17.5.1. Global Pea Proteins Market Revenue, By Application, 2018 – 2023 (USD Million) 103
17.5.2. Global Pea Proteins Market Revenue, By Application, 2024 – 2032 (USD Million) 103
17.6. Form 104
17.6.1. Global Pea Proteins Market Revenue, By Form, 2018 – 2023 (USD Million) 104
17.6.2. Global Pea Proteins Market Revenue, By Form, 2024 – 2032 (USD Million) 104
17.7. Distribution Channel 105
17.7.1. Global Pea Proteins Market Revenue, By Distribution Channel, 2018 – 2023 (USD Million) 105
17.7.2. Global Pea Proteins Market Revenue, By Distribution Channel, 2024 – 2032 (USD Million) 105
CHAPTER NO. 18 : PEA PROTEINS MARKET – NORTH AMERICA 106
18.1. North America 106
18.1.1. Key Highlights 106
18.1.2. North America Pea Proteins Market Revenue, By Country, 2018 – 2023 (USD Million) 107
18.1.3. North America Pea Proteins Market Revenue, By Type, 2018 – 2023 (USD Million) 108
18.1.4. North America Pea Proteins Market Revenue, By Application, 2018 – 2023 (USD Million) 109
18.1.5. North America Pea Proteins Market Revenue, By Form, 2018 – 2023 (USD Million) 110
18.1.6. North America Pea Proteins Market Revenue, By Distribution Channel, 2018 – 2023 (USD Million) 111
18.2. U.S. 112
18.3. Canada 112
18.4. Mexico 112
CHAPTER NO. 19 : PEA PROTEINS MARKET – EUROPE 113
19.1. Europe 113
19.1.1. Key Highlights 113
19.1.2. Europe Pea Proteins Market Revenue, By Country, 2018 – 2023 (USD Million) 114
19.1.3. Europe Pea Proteins Market Revenue, By Type, 2018 – 2023 (USD Million) 115
19.1.4. Europe Pea Proteins Market Revenue, By Application, 2018 – 2023 (USD Million) 116
19.1.5. Europe Pea Proteins Market Revenue, By Form, 2018 – 2023 (USD Million) 117
19.1.6. Europe Pea Proteins Market Revenue, By Distribution Channel, 2018 – 2023 (USD Million) 118
19.2. UK 119
19.3. France 119
19.4. Germany 119
19.5. Italy 119
19.6. Spain 119
19.7. Russia 119
19.8. Belgium 119
19.9. Netherland 119
19.10. Austria 119
19.11. Sweden 119
19.12. Poland 119
19.13. Denmark 119
19.14. Switzerland 119
19.15. Rest of Europe 119
CHAPTER NO. 20 : PEA PROTEINS MARKET – ASIA PACIFIC 120
20.1. Asia Pacific 120
20.1.1. Key Highlights 120
20.1.2. Asia Pacific Pea Proteins Market Revenue, By Country, 2018 – 2023 (USD Million) 121
20.1.3. Asia Pacific Pea Proteins Market Revenue, By Type, 2018 – 2023 (USD Million) 122
20.1.4. Asia Pacific Pea Proteins Market Revenue, By Application, 2018 – 2023 (USD Million) 123
20.1.5. Asia Pacific Pea Proteins Market Revenue, By Form, 2018 – 2023 (USD Million) 124
20.1.6. Asia Pacific Pea Proteins Market Revenue, By Distribution Channel, 2018 – 2023 (USD Million) 125
20.2. China 126
20.3. Japan 126
20.4. South Korea 126
20.5. India 126
20.6. Australia 126
20.7. Thailand 126
20.8. Indonesia 126
20.9. Vietnam 126
20.10. Malaysia 126
20.11. Philippines 126
20.12. Taiwan 126
20.13. Rest of Asia Pacific 126
CHAPTER NO. 21 : PEA PROTEINS MARKET – LATIN AMERICA 127
21.1. Latin America 127
21.1.1. Key Highlights 127
21.1.2. Latin America Pea Proteins Market Revenue, By Country, 2018 – 2023 (USD Million) 128
21.1.3. Latin America Pea Proteins Market Revenue, By Type, 2018 – 2023 (USD Million) 129
21.1.4. Latin America Pea Proteins Market Revenue, By Application, 2018 – 2023 (USD Million) 130
21.1.5. Latin America Pea Proteins Market Revenue, By Form, 2018 – 2023 (USD Million) 131
21.1.6. Latin America Pea Proteins Market Revenue, By Distribution Channel, 2018 – 2023 (USD Million) 132
21.2. Brazil 133
21.3. Argentina 133
21.4. Peru 133
21.5. Chile 133
21.6. Colombia 133
21.7. Rest of Latin America 133
CHAPTER NO. 22 : PEA PROTEINS MARKET – MIDDLE EAST 134
22.1. Middle East 134
22.1.1. Key Highlights 134
22.1.2. Middle East Pea Proteins Market Revenue, By Country, 2018 – 2023 (USD Million) 135
22.1.3. Middle East Pea Proteins Market Revenue, By Type, 2018 – 2023 (USD Million) 136
22.1.4. Middle East Pea Proteins Market Revenue, By Application, 2018 – 2023 (USD Million) 137
22.1.5. Middle East Pea Proteins Market Revenue, By Form, 2018 – 2023 (USD Million) 138
22.1.6. Middle East Pea Proteins Market Revenue, By Distribution Channel, 2018 – 2023 (USD Million) 139
22.2. UAE 140
22.3. KSA 140
22.4. Israel 140
22.5. Turkey 140
22.6. Iran 140
22.7. Rest of Middle East 140
CHAPTER NO. 23 : PEA PROTEINS MARKET – AFRICA 141
23.1. Africa 141
23.1.1. Key Highlights 141
23.1.2. Africa Pea Proteins Market Revenue, By Country, 2018 – 2023 (USD Million) 142
23.1.3. Africa Pea Proteins Market Revenue, By Type, 2018 – 2023 (USD Million) 143
23.1.4. Africa Pea Proteins Market Revenue, By Application, 2018 – 2023 (USD Million) 144
23.1.5. Africa Pea Proteins Market Revenue, By Form, 2018 – 2023 (USD Million) 145
23.1.6. Africa Pea Proteins Market Revenue, By Distribution Channel, 2018 – 2023 (USD Million) 146
23.2. Egypt 147
23.3. Nigeria 147
23.4. Algeria 147
23.5. Morocco 147
23.6. Rest of Africa 147
CHAPTER NO. 24 : COMPANY PROFILES 148
24.1. Roquette Frères 148
24.1.1. Company Overview 148
24.1.2. Product Portfolio 148
24.1.3. Swot Analysis 148
24.1.4. Business Strategy 149
24.1.5. Financial Overview 149
24.2. Cargill, Inc. 150
24.3. DuPont (IFF) 150
24.4. Ingredion Incorporated 150
24.5. Axiom Foods, Inc. 150
24.6. Burcon NutraScience Corporation 150
24.7. Cosucra Groupe Warcoing 150
24.8. Shandong Jianyuan Group 150
24.9. Fenchem Biotek Ltd. 150
24.10. The Scoular Company 150

List of Figures
FIG NO. 1. Global Pea Proteins Market Revenue, 2018 – 2032 (USD Million) 32
FIG NO. 2. Porter’s Five Forces Analysis for Global Pea Proteins Market 39
FIG NO. 3. Value Chain Analysis for Global Pea Proteins Market 40
FIG NO. 4. Global Pea Proteins Market Import Volume/Revenue, By Region, 2018 – 2023 42
FIG NO. 5. Global Pea Proteins Market Export Volume/Revenue, By Region, 2018 – 2023 43
FIG NO. 6. Global Pea Proteins Market Demand Volume/Revenue, By Region, 2018 – 2023 44
FIG NO. 7. Global Pea Proteins Market Supply Volume/Revenue, By Region, 2018 – 2023 45
FIG NO. 8. Global Pea Proteins Market Production Volume/Revenue, By Region, 2018 – 2023 46
FIG NO. 9. Global Pea Proteins Market Price, By Region, 2018 – 2023 47
FIG NO. 10. Global Pea Proteins Market Price, By Type, 2018 – 2023 48
FIG NO. 11. Raw Materials Price Trend Analysis, 2018 – 2023 49
FIG NO. 12. Manufacturing Cost Analysis 50
FIG NO. 13. Manufacturing Process 50
FIG NO. 14. Company Share Analysis, 2023 51
FIG NO. 15. Company Share Analysis, 2023 52
FIG NO. 16. Company Share Analysis, 2023 52
FIG NO. 17. Company Share Analysis, 2023 53
FIG NO. 18. Pea Proteins Market – Company Volume Market Share, 2023 54
FIG NO. 19. Pea Proteins Market – Company Revenue Market Share, 2023 55
FIG NO. 20. Pea Proteins Market Revenue Share, By Type, 2023 & 2032 61
FIG NO. 21. Market Attractiveness Analysis, By Type 62
FIG NO. 22. Incremental Revenue Growth Opportunity by Type, 2024 – 2032 62
FIG NO. 23. Pea Proteins Market Revenue, By Type, 2018, 2023, 2027 & 2032 63
FIG NO. 24. Global Pea Proteins Market for Isolate, Revenue (USD Million) 2018 – 2032 64
FIG NO. 25. Global Pea Proteins Market for Concentrate, Revenue (USD Million) 2018 – 2032 66
FIG NO. 26. Global Pea Proteins Market for Textured, Revenue (USD Million) 2018 – 2032 68
FIG NO. 27. Pea Proteins Market Revenue Share, By Application, 2023 & 2032 71
FIG NO. 28. Market Attractiveness Analysis, By Application 72
FIG NO. 29. Incremental Revenue Growth Opportunity by Application, 2024 – 2032 72
FIG NO. 30. Pea Proteins Market Revenue, By Application, 2018, 2023, 2027 & 2032 73
FIG NO. 31. Global Pea Proteins Market for Food & Beverages, Revenue (USD Million) 2018 – 2032 74
FIG NO. 32. Global Pea Proteins Market for Nutraceuticals, Revenue (USD Million) 2018 – 2032 76
FIG NO. 33. Global Pea Proteins Market for Animal Feed, Revenue (USD Million) 2018 – 2032 78
FIG NO. 34. Global Pea Proteins Market for Personal Care & Cosmetics, Revenue (USD Million) 2018 – 2032 80
FIG NO. 35. Global Pea Proteins Market for Others, Revenue (USD Million) 2018 – 2032 82
FIG NO. 36. Pea Proteins Market Revenue Share, By Form, 2023 & 2032 85
FIG NO. 37. Market Attractiveness Analysis, By Form 86
FIG NO. 38. Incremental Revenue Growth Opportunity by Form, 2024 – 2032 86
FIG NO. 39. Pea Proteins Market Revenue, By Form, 2018, 2023, 2027 & 2032 87
FIG NO. 40. Global Pea Proteins Market for Dry, Revenue (USD Million) 2018 – 2032 88
FIG NO. 41. Global Pea Proteins Market for Liquid, Revenue (USD Million) 2018 – 2032 90
FIG NO. 42. Pea Proteins Market Revenue Share, By Distribution Channel, 2023 & 2032 93
FIG NO. 43. Market Attractiveness Analysis, By Distribution Channel 94
FIG NO. 44. Incremental Revenue Growth Opportunity by Distribution Channel, 2024 – 2032 94
FIG NO. 45. Pea Proteins Market Revenue, By Distribution Channel, 2018, 2023, 2027 & 2032 95
FIG NO. 46. Global Pea Proteins Market for Online, Revenue (USD Million) 2018 – 2032 96
FIG NO. 47. Global Pea Proteins Market for Offline, Revenue (USD Million) 2018 – 2032 98
FIG NO. 48. Global Pea Proteins Market Revenue Share, By Region, 2023 & 2032 101
FIG NO. 49. Market Attractiveness Analysis, By Region 102
FIG NO. 50. Incremental Revenue Growth Opportunity by Region, 2024 – 2032 102
FIG NO. 51. Pea Proteins Market Revenue, By Region, 2018, 2023, 2027 & 2032 103
FIG NO. 52. North America Pea Proteins Market Revenue, 2018 – 2032 (USD Million) 109
FIG NO. 53. Europe Pea Proteins Market Revenue, 2018 – 2032 (USD Million) 116
FIG NO. 54. Asia Pacific Pea Proteins Market Revenue, 2018 – 2032 (USD Million) 123
FIG NO. 55. Latin America Pea Proteins Market Revenue, 2018 – 2032 (USD Million) 130
FIG NO. 56. Middle East Pea Proteins Market Revenue, 2018 – 2032 (USD Million) 137
FIG NO. 57. Africa Pea Proteins Market Revenue, 2018 – 2032 (USD Million) 144

List of Tables
TABLE NO. 1. : Global Pea Proteins Market: Snapshot 31
TABLE NO. 2. : Drivers for the Pea Proteins Market: Impact Analysis 35
TABLE NO. 3. : Restraints for the Pea Proteins Market: Impact Analysis 37
TABLE NO. 4. : Global Pea Proteins Market Revenue, By Region, 2018 – 2023 47
TABLE NO. 5. : Global Pea Proteins Market Revenue, By Type, 2018 – 2023 48
TABLE NO. 6. : Key Raw Materials & Suppliers 49
TABLE NO. 7. : Global Isolate Pea Proteins Market Revenue, By Region, 2018 – 2023 (USD Million) 65
TABLE NO. 8. : Global Isolate Pea Proteins Market Revenue, By Region, 2024 – 2032 (USD Million) 65
TABLE NO. 9. : Global Concentrate Pea Proteins Market Revenue, By Region, 2018 – 2023 (USD Million) 67
TABLE NO. 10. : Global Concentrate Pea Proteins Market Revenue, By Region, 2024 – 2032 (USD Million) 67
TABLE NO. 11. : Global Textured Pea Proteins Market Revenue, By Region, 2018 – 2023 (USD Million) 69
TABLE NO. 12. : Global Textured Pea Proteins Market Revenue, By Region, 2024 – 2032 (USD Million) 69
TABLE NO. 13. : Global Food & Beverages Pea Proteins Market Revenue, By Region, 2018 – 2023 (USD Million) 75
TABLE NO. 14. : Global Food & Beverages Pea Proteins Market Revenue, By Region, 2024 – 2032 (USD Million) 75
TABLE NO. 15. : Global Nutraceuticals Pea Proteins Market Revenue, By Region, 2018 – 2023 (USD Million) 77
TABLE NO. 16. : Global Nutraceuticals Pea Proteins Market Revenue, By Region, 2024 – 2032 (USD Million) 77
TABLE NO. 17. : Global Animal Feed Pea Proteins Market Revenue, By Region, 2018 – 2023 (USD Million) 79
TABLE NO. 18. : Global Animal Feed Pea Proteins Market Revenue, By Region, 2024 – 2032 (USD Million) 79
TABLE NO. 19. : Global Personal Care & Cosmetics Pea Proteins Market Revenue, By Region, 2018 – 2023 (USD Million) 81
TABLE NO. 20. : Global Personal Care & Cosmetics Pea Proteins Market Revenue, By Region, 2024 – 2032 (USD Million) 81
TABLE NO. 21. : Global Others Pea Proteins Market Revenue, By Region, 2018 – 2023 (USD Million) 83
TABLE NO. 22. : Global Others Pea Proteins Market Revenue, By Region, 2024 – 2032 (USD Million) 83
TABLE NO. 23. : Global Dry Pea Proteins Market Revenue, By Region, 2018 – 2023 (USD Million) 89
TABLE NO. 24. : Global Dry Pea Proteins Market Revenue, By Region, 2024 – 2032 (USD Million) 89
TABLE NO. 25. : Global Liquid Pea Proteins Market Revenue, By Region, 2018 – 2023 (USD Million) 91
TABLE NO. 26. : Global Liquid Pea Proteins Market Revenue, By Region, 2024 – 2032 (USD Million) 91
TABLE NO. 27. : Global Online Pea Proteins Market Revenue, By Region, 2018 – 2023 (USD Million) 97
TABLE NO. 28. : Global Online Pea Proteins Market Revenue, By Region, 2024 – 2032 (USD Million) 97
TABLE NO. 29. : Global Offline Pea Proteins Market Revenue, By Region, 2018 – 2023 (USD Million) 99
TABLE NO. 30. : Global Offline Pea Proteins Market Revenue, By Region, 2024 – 2032 (USD Million) 99
TABLE NO. 31. : Global Pea Proteins Market Revenue, By Region, 2018 – 2023 (USD Million) 104
TABLE NO. 32. : Global Pea Proteins Market Revenue, By Region, 2024 – 2032 (USD Million) 104
TABLE NO. 33. : Global Pea Proteins Market Revenue, By Type, 2018 – 2023 (USD Million) 105
TABLE NO. 34. : Global Pea Proteins Market Revenue, By Type, 2024 – 2032 (USD Million) 105
TABLE NO. 35. : Global Pea Proteins Market Revenue, By Application, 2018 – 2023 (USD Million) 106
TABLE NO. 36. : Global Pea Proteins Market Revenue, By Application, 2024 – 2032 (USD Million) 106
TABLE NO. 37. : Global Pea Proteins Market Revenue, By Form, 2018 – 2023 (USD Million) 107
TABLE NO. 38. : Global Pea Proteins Market Revenue, By Form, 2024 – 2032 (USD Million) 107
TABLE NO. 39. : Global Pea Proteins Market Revenue, By Distribution Channel, 2018 – 2023 (USD Million) 108
TABLE NO. 40. : Global Pea Proteins Market Revenue, By Distribution Channel, 2024 – 2032 (USD Million) 108
TABLE NO. 41. : North America Pea Proteins Market Revenue, By Country, 2018 – 2023 (USD Million) 110
TABLE NO. 42. : North America Pea Proteins Market Revenue, By Country, 2024 – 2032 (USD Million) 110
TABLE NO. 43. : North America Pea Proteins Market Revenue, By Type, 2018 – 2023 (USD Million) 111
TABLE NO. 44. : North America Pea Proteins Market Revenue, By Type, 2024 – 2032 (USD Million) 111
TABLE NO. 45. : North America Pea Proteins Market Revenue, By Application, 2018 – 2023 (USD Million) 112
TABLE NO. 46. : North America Pea Proteins Market Revenue, By Application, 2024 – 2032 (USD Million) 112
TABLE NO. 47. : North America Pea Proteins Market Revenue, By Form, 2018 – 2023 (USD Million) 113
TABLE NO. 48. : North America Pea Proteins Market Revenue, By Form, 2024 – 2032 (USD Million) 113
TABLE NO. 49. : North America Pea Proteins Market Revenue, By Distribution Channel, 2018 – 2023 (USD Million) 114
TABLE NO. 50. : North America Pea Proteins Market Revenue, By Distribution Channel, 2024 – 2032 (USD Million) 114
TABLE NO. 51. : Europe Pea Proteins Market Revenue, By Country, 2018 – 2023 (USD Million) 117
TABLE NO. 52. : Europe Pea Proteins Market Revenue, By Country, 2024 – 2032 (USD Million) 117
TABLE NO. 53. : Europe Pea Proteins Market Revenue, By Type, 2018 – 2023 (USD Million) 118
TABLE NO. 54. : Europe Pea Proteins Market Revenue, By Type, 2024 – 2032 (USD Million) 118
TABLE NO. 55. : Europe Pea Proteins Market Revenue, By Application, 2018 – 2023 (USD Million) 119
TABLE NO. 56. : Europe Pea Proteins Market Revenue, By Application, 2024 – 2032 (USD Million) 119
TABLE NO. 57. : Europe Pea Proteins Market Revenue, By Form, 2018 – 2023 (USD Million) 120
TABLE NO. 58. : Europe Pea Proteins Market Revenue, By Form, 2024 – 2032 (USD Million) 120
TABLE NO. 59. : Europe Pea Proteins Market Revenue, By Distribution Channel, 2018 – 2023 (USD Million) 121
TABLE NO. 60. : Europe Pea Proteins Market Revenue, By Distribution Channel, 2024 – 2032 (USD Million) 121
TABLE NO. 61. : Asia Pacific Pea Proteins Market Revenue, By Country, 2018 – 2023 (USD Million) 124
TABLE NO. 62. : Asia Pacific Pea Proteins Market Revenue, By Country, 2024 – 2032 (USD Million) 124
TABLE NO. 63. : Asia Pacific Pea Proteins Market Revenue, By Type, 2018 – 2023 (USD Million) 125
TABLE NO. 64. : Asia Pacific Pea Proteins Market Revenue, By Type, 2024 – 2032 (USD Million) 125
TABLE NO. 65. : Asia Pacific Pea Proteins Market Revenue, By Application, 2018 – 2023 (USD Million) 126
TABLE NO. 66. : Asia Pacific Pea Proteins Market Revenue, By Application, 2024 – 2032 (USD Million) 126
TABLE NO. 67. : Asia Pacific Pea Proteins Market Revenue, By Form, 2018 – 2023 (USD Million) 127
TABLE NO. 68. : Asia Pacific Pea Proteins Market Revenue, By Form, 2024 – 2032 (USD Million) 127
TABLE NO. 69. : Asia Pacific Pea Proteins Market Revenue, By Distribution Channel, 2018 – 2023 (USD Million) 128
TABLE NO. 70. : Asia Pacific Pea Proteins Market Revenue, By Distribution Channel, 2024 – 2032 (USD Million) 128
TABLE NO. 71. : Latin America Pea Proteins Market Revenue, By Country, 2018 – 2023 (USD Million) 131
TABLE NO. 72. : Latin America Pea Proteins Market Revenue, By Country, 2024 – 2032 (USD Million) 131
TABLE NO. 73. : Latin America Pea Proteins Market Revenue, By Type, 2018 – 2023 (USD Million) 132
TABLE NO. 74. : Latin America Pea Proteins Market Revenue, By Type, 2024 – 2032 (USD Million) 132
TABLE NO. 75. : Latin America Pea Proteins Market Revenue, By Application, 2018 – 2023 (USD Million) 133
TABLE NO. 76. : Latin America Pea Proteins Market Revenue, By Application, 2024 – 2032 (USD Million) 133
TABLE NO. 77. : Latin America Pea Proteins Market Revenue, By Form, 2018 – 2023 (USD Million) 134
TABLE NO. 78. : Latin America Pea Proteins Market Revenue, By Form, 2024 – 2032 (USD Million) 134
TABLE NO. 79. : Latin America Pea Proteins Market Revenue, By Distribution Channel, 2018 – 2023 (USD Million) 135
TABLE NO. 80. : Latin America Pea Proteins Market Revenue, By Distribution Channel, 2024 – 2032 (USD Million) 135
TABLE NO. 81. : Middle East Pea Proteins Market Revenue, By Country, 2018 – 2023 (USD Million) 138
TABLE NO. 82. : Middle East Pea Proteins Market Revenue, By Country, 2024 – 2032 (USD Million) 138
TABLE NO. 83. : Middle East Pea Proteins Market Revenue, By Type, 2018 – 2023 (USD Million) 139
TABLE NO. 84. : Middle East Pea Proteins Market Revenue, By Type, 2024 – 2032 (USD Million) 139
TABLE NO. 85. : Middle East Pea Proteins Market Revenue, By Application, 2018 – 2023 (USD Million) 140
TABLE NO. 86. : Middle East Pea Proteins Market Revenue, By Application, 2024 – 2032 (USD Million) 140
TABLE NO. 87. : Middle East Pea Proteins Market Revenue, By Form, 2018 – 2023 (USD Million) 141
TABLE NO. 88. : Middle East Pea Proteins Market Revenue, By Form, 2024 – 2032 (USD Million) 141
TABLE NO. 89. : Middle East Pea Proteins Market Revenue, By Distribution Channel, 2018 – 2023 (USD Million) 142
TABLE NO. 90. : Middle East Pea Proteins Market Revenue, By Distribution Channel, 2024 – 2032 (USD Million) 142
TABLE NO. 91. : Africa Pea Proteins Market Revenue, By Country, 2018 – 2023 (USD Million) 145
TABLE NO. 92. : Africa Pea Proteins Market Revenue, By Country, 2024 – 2032 (USD Million) 145
TABLE NO. 93. : Africa Pea Proteins Market Revenue, By Type, 2018 – 2023 (USD Million) 146
TABLE NO. 94. : Africa Pea Proteins Market Revenue, By Type, 2024 – 2032 (USD Million) 146
TABLE NO. 95. : Africa Pea Proteins Market Revenue, By Application, 2018 – 2023 (USD Million) 147
TABLE NO. 96. : Africa Pea Proteins Market Revenue, By Application, 2024 – 2032 (USD Million) 147
TABLE NO. 97. : Africa Pea Proteins Market Revenue, By Form, 2018 – 2023 (USD Million) 148
TABLE NO. 98. : Africa Pea Proteins Market Revenue, By Form, 2024 – 2032 (USD Million) 148
TABLE NO. 99. : Africa Pea Proteins Market Revenue, By Distribution Channel, 2018 – 2023 (USD Million) 149
TABLE NO. 100. : Africa Pea Proteins Market Revenue, By Distribution Channel, 2024 – 2032 (USD Million) 149

Frequently Asked Questions:

What is the current size of the Global Pea Proteins Market?

As of 2024, the Global Pea Proteins Market is valued at USD 2,229.15 million and is projected to reach USD 5,618.92 million by 2032, growing at a CAGR of 12.25%.

What factors are driving the growth of the Global Pea Proteins Market?

Key growth drivers include rising health consciousness, demand for allergen-free proteins, sustainable farming practices, and the increasing popularity of plant-based diets.

What are the key segments within the Global Pea Proteins Market?

The market includes segments such as food and beverages, sports nutrition, meat substitutes, dairy alternatives, and clinical nutrition, with expanding applications across each category.

What are some challenges faced by the Global Pea Proteins Market?

Challenges include high production costs, flavor and texture limitations, and supply chain fluctuations impacting price stability and scalability.

Who are the major players in the Global Pea Proteins Market?

Leading players include Roquette Frères, Cargill, Ingredion Incorporated, Glanbia PLC, and Puris, all of whom are expanding through innovation and global distribution.

Spain Pea Proteins Market

Published:
Report ID: 92108

UK Pea Proteins Market

Published:
Report ID: 83246

Vietnam Pea Proteins Market

Published:
Report ID: 91586

Malaysia Pea Proteins Market

Published:
Report ID: 91090

South Korea Pea Proteins Market

Published:
Report ID: 91069

Thailand Pea Proteins Market

Published:
Report ID: 91065

U.S. Pea Proteins Market

Published:
Report ID: 83298

North America Pea Proteins Market

Published:
Report ID: 83524

Mexico Pea Proteins Market

Published:
Report ID: 83288

Vegetarian Tacos Market

Published:
Report ID: 99899

Watermelon Drink Market

Published:
Report ID: 99863

Yoghurt Making Culture Market

Published:
Report ID: 99864

Meat Snacks Market

Published:
Report ID: 99402

Ketogenic Diet Market

Published:
Report ID: 99404

Flavored Whiskey Market

Published:
Report ID: 99366

Euglena Market

Published:
Report ID: 99062

Animal and Marine Fats and Oils Market

Published:
Report ID: 99023

Algae Protein Market

Published:
Report ID: 98769

Native Micellar Casein Market

Published:
Report ID: 42138

Middle East and Africa Whipping Agents Market

Published:
Report ID: 98662

Whipping Agents Market

Published:
Report ID: 98657

Purchase Options

The report comes as a view-only PDF document, optimized for individual clients. This version is recommended for personal digital use and does not allow printing.
$4699

To meet the needs of modern corporate teams, our report comes in two formats: a printable PDF and a data-rich Excel sheet. This package is optimized for internal analysis and multi-location access, making it an excellent choice for organizations with distributed workforce.
$5699

The report will be delivered in printable PDF format along with the report’s data Excel sheet. This license offers 100 Free Analyst hours where the client can utilize Credence Research Inc.’s research team. It is highly recommended for organizations seeking to execute short, customized research projects related to the scope of the purchased report.
$12699

Credence Staff 3

MIKE, North America

Support Staff at Credence Research

KEITH PHILLIPS, Europe

Lee - CR Sales Staff

LEE VALLANCE, Asia Pacific

Smallform of Sample request

Report delivery within 24 to 48 hours

– Other Info –

What people say?-

User Review

I am very impressed with the information in this report. The author clearly did their research when they came up with this product and it has already given me a lot of ideas.

Jana Schmidt
CEDAR CX Technologies

– Connect with us –

Phone

+91 6232 49 3207


support

24/7 Research Support


sales@credenceresearch.com

– Research Methodology –

Going beyond the basics: advanced techniques in research methodology

– Trusted By –

Pepshi, LG, Nestle
Motorola, Honeywell, Johnson and johnson
LG Chem, SIEMENS, Pfizer
Unilever, Samsonite, QIAGEN

Request Sample