
Market Overview
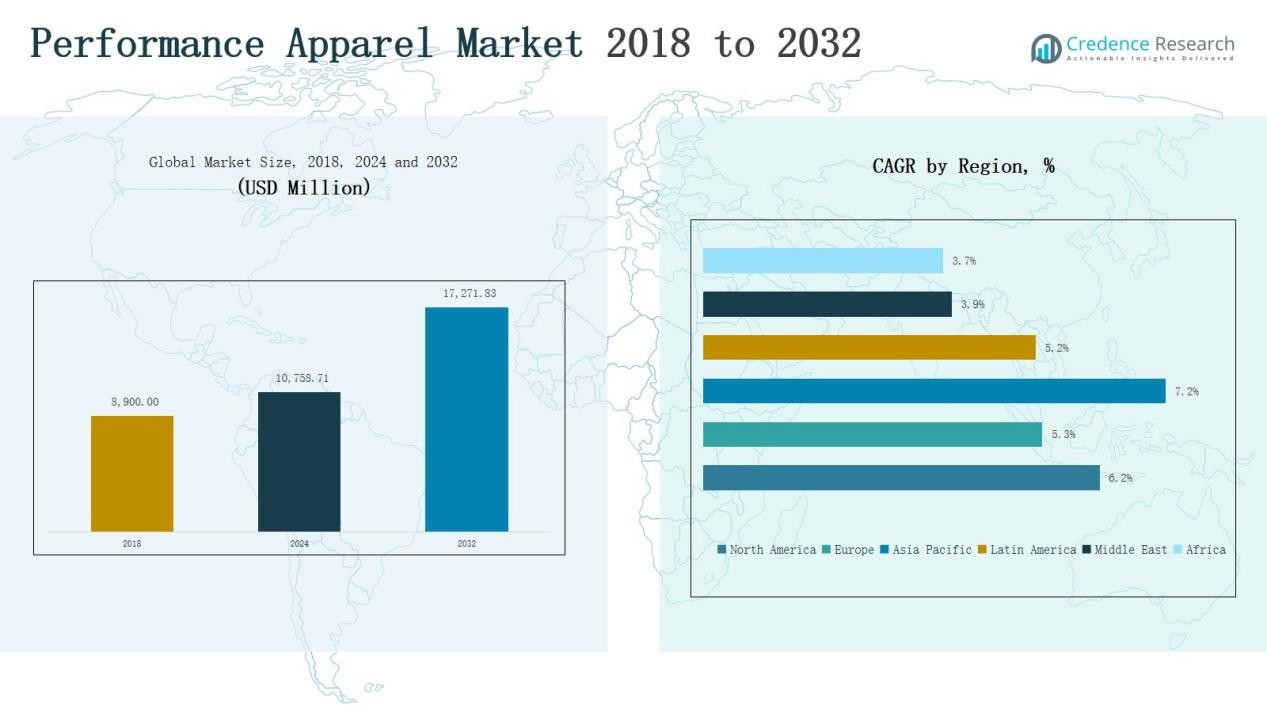
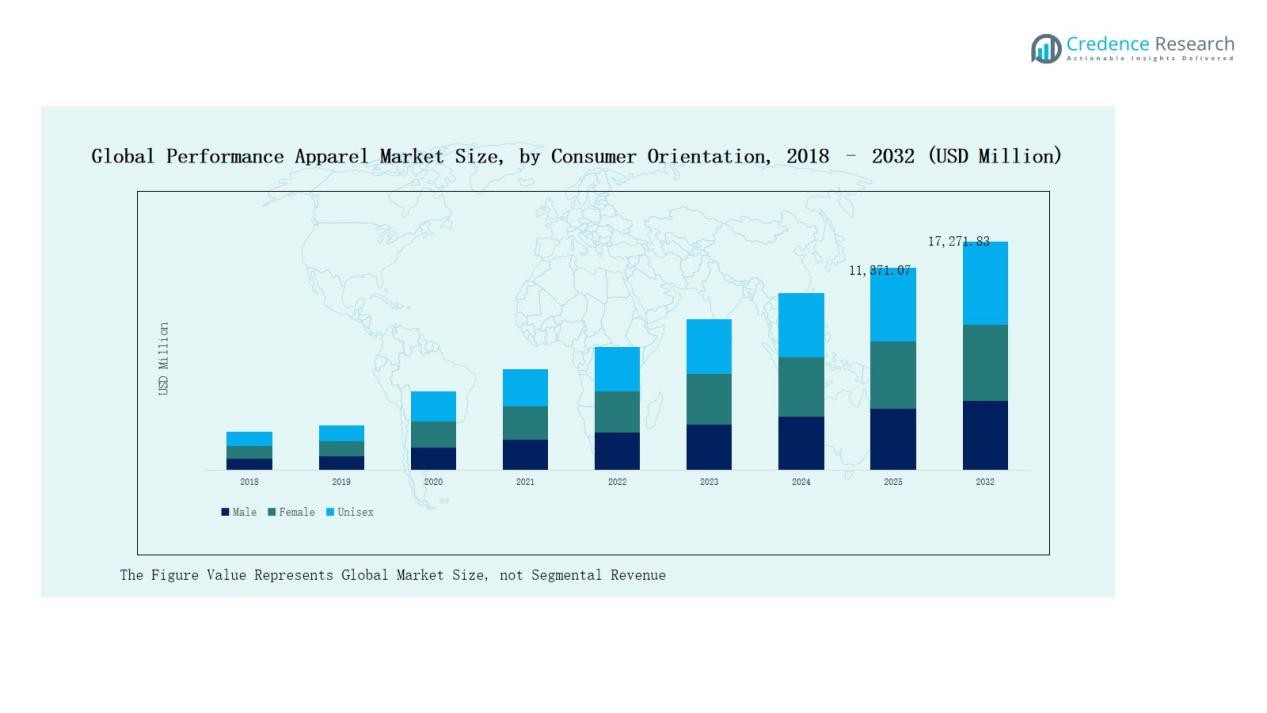
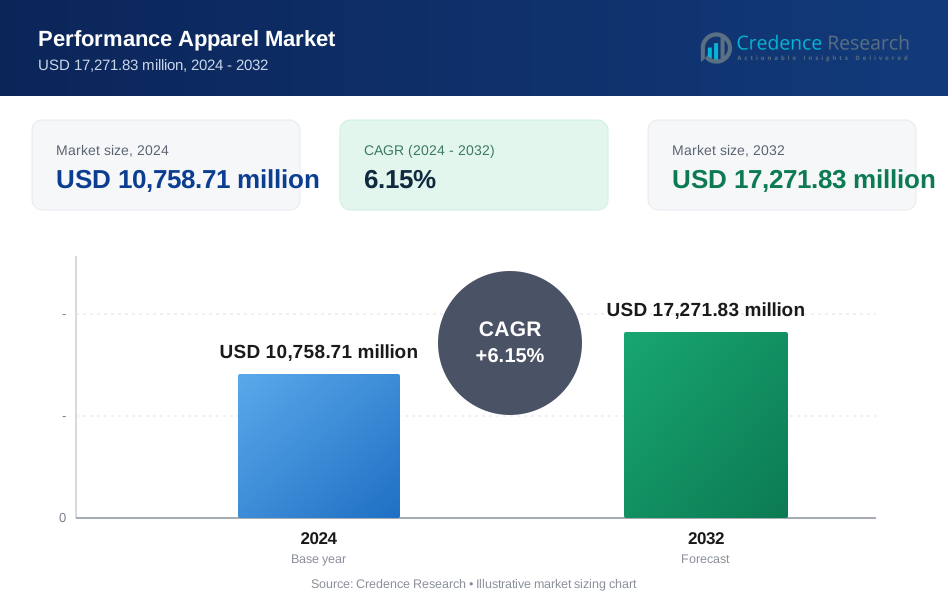
Performance Apparel Market size was valued at USD 8,900.00 million in 2018, reached USD 10,758.71 million in 2024, and is anticipated to reach USD 17,271.83 million by 2032, at a CAGR of 6.15% during the forecast period.
| REPORT ATTRIBUTE | DETAILS |
|---|---|
| Historical Period | 2020-2023 |
| Base Year | 2024 |
| Forecast Period | 2025-2032 |
| Performance Apparel Market Size 2024 | USD 10,758.71 Million |
| Performance Apparel Market, CAGR | 6.15% |
| Performance Apparel Market Size 2032 | USD 17,271.83 Million |
The Performance Apparel Market is led by global giants such as Nike, Adidas, Under Armour, Puma, and Lululemon Athletica, supported by strong regional players including Columbia Sportswear, ASICS, Patagonia, The North Face, Reebok, Anta Sports Products, and Hanesbrands. These companies dominate through innovation in high-performance fabrics, strong branding, and expanding omnichannel distribution networks. Strategic endorsements, sustainability initiatives, and premium product lines strengthen their market positions. Regionally, North America emerged as the leading market in 2024, holding a 35% share, driven by strong sports culture, fitness trends, and robust retail infrastructure.
Market Insights
- The Performance Apparel Market was valued at USD 8,900.00 million in 2018, reached USD 10,758.71 million in 2024, and is projected at USD 17,271.83 million by 2032, growing at 15% CAGR.
- Topwear led with 45% share in 2024, dominated by T-shirts and jerseys, driven by rising sports, fitness, and athleisure demand, supported by jackets and sweatshirts in seasonal use.
- By consumer orientation, the male segment held 52% share in 2024, supported by investments in durable sportswear, bottomwear, and endorsements from athletes fueling continued market leadership.
- Sportswear dominated applications with 60% share in 2024, supported by gym culture, yoga, cycling, and running, while protective clothing and dancewear saw growing niche adoption.
- North America led with 35% share in 2024, followed by Asia Pacific at 32% and Europe at 21%, with Asia Pacific identified as the fastest-growing regional market.
Market Segment Insights
By Product Type
Topwear leads the performance apparel market, accounting for nearly 45% share in 2024. Within topwear, T-shirts and jerseys dominate due to their widespread use in sports, fitness, and athleisure. Consumers favor lightweight fabrics, moisture-wicking materials, and stylish designs that transition between athletic and casual wear. Jackets and sweatshirts also contribute significantly, supported by seasonal demand and premium positioning. Growth in health awareness and lifestyle integration continues to drive consistent adoption across both professional athletes and everyday users.
- For instance, Adidas launched the Own the Run Jackets with water-repellent technology and reflective detailing, designed for urban runners training in variable weather.
By Consumer Orientation
The male segment captured about 52% share in 2024, making it the largest orientation category in the performance apparel market. Male consumers increasingly invest in durable sportswear and functional bottomwear such as track pants and shoes. Rising participation in outdoor activities, fitness programs, and competitive sports fuels steady demand. While female and unisex categories are expanding, men’s demand for versatile and performance-driven apparel keeps this segment dominant. Growing brand endorsements by male athletes further reinforce strong adoption trends.
- For instance, Nike launched its Vaporfly 3 running shoes, designed with lightweight cushioning and improved durability, which quickly gained popularity among male marathon runners.
By Application
Sportswear remains the dominant application,
representing nearly 60% share in 2024. Its leadership is attributed to rising fitness awareness, gym culture, and the popularity of running, cycling, and yoga. Performance apparel in sportswear emphasizes breathability, stretchability, and sweat resistance, making it indispensable for both professionals and hobbyists. Protective clothing and dancewear follow, gaining traction in niche categories like safety gear and performing arts. The sportswear segment continues to expand with strong influence from athleisure fashion and global fitness movements.
Key Growth Drivers
Rising Fitness and Sports Participation
Growing interest in fitness, athletics, and outdoor activities drives strong demand for performance apparel. Rising gym memberships, organized sports events, and increased awareness of healthy lifestyles support this growth. Consumers seek high-performance fabrics that enhance comfort, regulate temperature, and improve flexibility. The influence of sports celebrities and digital fitness platforms further encourages adoption. This rising participation, particularly among younger demographics, has positioned performance apparel as a mainstream choice, extending its relevance beyond professional athletes into everyday fashion and active lifestyles.
Expansion of Athleisure Fashion
The blurring lines between athletic wear and casual clothing have boosted the global appeal of athleisure. Performance apparel, particularly topwear like T-shirts, jerseys, and hoodies, benefits from this cultural shift. Consumers prefer versatile clothing that combines functionality with style, suitable for workouts, office commutes, and social gatherings. This trend aligns with rising urbanization, growing disposable incomes, and a heightened focus on fashion-forward performance wear. The expansion of athleisure ensures sustained market growth, as brands innovate with hybrid designs that balance durability and aesthetic appeal.
- For instance, Technosport launched its ‘CotFlex’ fabric this year, mimicking the feel of cotton while enhancing stretch, breathability, and quick-dry features tailored for urban lifestyles.
Advancements in Fabric and Material Technology
Innovations in textiles, including moisture-wicking, anti-odor, and temperature-regulating fabrics, strengthen the performance apparel market. Brands invest heavily in R&D to integrate nanotechnology, smart fabrics, and sustainable materials like recycled polyester. These enhancements meet consumer expectations for comfort, durability, and eco-conscious choices. Shoes and socks incorporating breathable, lightweight materials also gain popularity. Technological advancements not only enhance athletic performance but also extend product longevity. This focus on material innovation differentiates brands in a competitive market, fueling consumer loyalty and premium pricing opportunities across global regions.
- For instance, Adidas introduced its TERREX apparel line featuring Drydye technology, which saves around 25 liters of water per T-shirt by using a waterless dyeing process.
Key Trends & Opportunities
Growing Online and Omnichannel Distribution
E-commerce platforms and brand-owned websites increasingly drive sales in performance apparel. Consumers prefer online channels for their wide product range, price comparisons, and personalized shopping experiences. Brands adopt omnichannel strategies, blending digital platforms with physical outlets to enhance convenience and accessibility. Emerging technologies like AR fitting tools and AI-driven recommendations further strengthen online adoption. This trend creates opportunities for direct-to-consumer engagement, improved inventory management, and higher margins, making online and omnichannel strategies critical for future growth in competitive performance apparel markets.
- For instance, Lululemon has incorporated augmented reality (AR) try-on tools for specific footwear releases, which have been accessed through its website and through partnerships with other platforms, rather than being a standard feature in its primary mobile shopping app.
Sustainability and Eco-Friendly Innovations
Sustainability is shaping the future of performance apparel as consumers demand ethical and eco-conscious products. Brands focus on recycled fibers, biodegradable fabrics, and eco-friendly dyes to reduce environmental impact. This trend opens opportunities for differentiation in a saturated market while meeting regulatory and consumer expectations. Transparent supply chains, circular fashion initiatives, and carbon-neutral commitments gain traction. Eco-friendly innovations also attract younger demographics who value sustainability in purchasing decisions. Companies embracing sustainable practices secure long-term relevance while aligning profitability with environmental responsibility and global climate goals.
- For instance, Adidas aimed to eliminate all virgin polyester by 2024, implementing its three-loop strategy that includes using recycled plastics recovered from oceans for its products. The company reached 99% recycled polyester use in 2024, nearly achieving its goal.
Key Challenges
High Market Competition and Price Pressure
The performance apparel market is intensely competitive, with global and regional brands vying for share. Companies face pricing pressure due to the presence of low-cost alternatives and fast-fashion retailers offering similar designs. Maintaining profitability while sustaining product quality becomes challenging. Premium brands must invest in marketing and innovation to differentiate, which increases costs. Balancing affordability with value-added features is crucial. This competitive intensity creates barriers for new entrants and forces established players to continually evolve their offerings to retain consumer loyalty and market leadership.
Counterfeit and Imitation Products
The prevalence of counterfeit and imitation apparel undermines brand value and erodes consumer trust. Fake products often use inferior materials, compromising durability and performance. With online marketplaces expanding, counterfeit distribution has grown rapidly, posing a threat to both revenues and reputation. Consumers misled by low-priced replicas may associate negative experiences with authentic brands. Combating this challenge requires stricter regulations, advanced authentication technologies, and stronger consumer education. Counterfeits remain a persistent obstacle, particularly in developing markets where price sensitivity is high and enforcement mechanisms are limited.
Supply Chain and Raw Material Volatility
Volatility in raw material prices, logistics costs, and supply chain disruptions hampers the stability of the performance apparel market. Dependence on synthetic fibers like polyester and spandex exposes manufacturers to price fluctuations and environmental scrutiny. Global challenges, including shipping delays and geopolitical tensions, add further complexity. Brands must balance efficient sourcing with sustainability goals while managing costs. Unexpected disruptions, such as pandemics or natural disasters, highlight vulnerabilities in global supply networks. Securing resilient, localized, and flexible supply chains has become a critical challenge for long-term growth.
Regional Analysis
North America
North America held the largest share of the Performance Apparel Market with 35% in 2024. The market was valued at USD 3,157.72 million in 2018, grew to USD 3,769.79 million in 2024, and is projected to reach USD 6,043.44 million by 2032, reflecting a CAGR of 6.2%. Strong consumer preference for sportswear, widespread gym culture, and leading brands like Nike, Under Armour, and Lululemon drive growth. The region’s advanced retail infrastructure and rising adoption of athleisure further strengthen market dominance.
Europe
Europe accounted for 21% share in 2024 of the Performance Apparel Market. Valued at USD 1,993.60 million in 2018, it reached USD 2,299.92 million in 2024 and is projected to grow to USD 3,450.09 million by 2032, at a CAGR of 5.3%. Increasing participation in outdoor sports, winter athletics, and the growing popularity of fitness fashion drive demand. Countries like Germany, the UK, and France lead the market due to high sports culture and premium brand adoption. Europe continues to expand with sustainable apparel innovations.
Asia Pacific
Asia Pacific captured 32% share in 2024, emerging as the fastest-growing region. The market was valued at USD 2,794.60 million in 2018, expanded to USD 3,494.92 million in 2024, and is expected to reach USD 6,067.61 million by 2032, at a CAGR of 7.2%. Rapid urbanization, rising middle-class income, and increasing health awareness fuel adoption. China, India, and Japan dominate consumption, while Southeast Asia is emerging. The region benefits from affordable production capabilities and a growing preference for global as well as local athletic brands.
Latin America
Latin America held 6% share in 2024 of the Performance Apparel Market. It was valued at USD 551.80 million in 2018, increased to USD 660.48 million in 2024, and is forecast to reach USD 982.25 million by 2032, at a CAGR of 5.2%. Growth is driven by rising interest in football, fitness training, and lifestyle-driven athleisure demand. Brazil and Mexico represent the largest contributors due to a young population and sports enthusiasm. E-commerce expansion and increasing availability of international brands further support regional performance apparel consumption.
Middle East
The Middle East represented 3% share in 2024 of the Performance Apparel Market. Valued at USD 213.60 million in 2018, it reached USD 232.32 million in 2024 and is expected to grow to USD 312.72 million by 2032, reflecting a CAGR of 3.9%. Rising awareness of fitness and growing adoption of Western lifestyle trends influence the market. GCC countries lead demand, with premium performance brands gaining traction in urban centers. However, high pricing and limited local manufacturing capacity remain challenges for broader adoption across the region.
Africa
Africa accounted for 3% share in 2024 of the Performance Apparel Market. The market size was USD 188.68 million in 2018, expanded to USD 301.29 million in 2024, and is projected to reach USD 415.72 million by 2032, at a CAGR of 3.7%. South Africa leads consumption, supported by a strong sports culture and rising urban fitness trends. Nigeria and Egypt also contribute to growth, with younger populations driving demand. Despite infrastructure and affordability challenges, increasing e-commerce penetration and global brand presence open opportunities for gradual market expansion.
Market Segmentations:
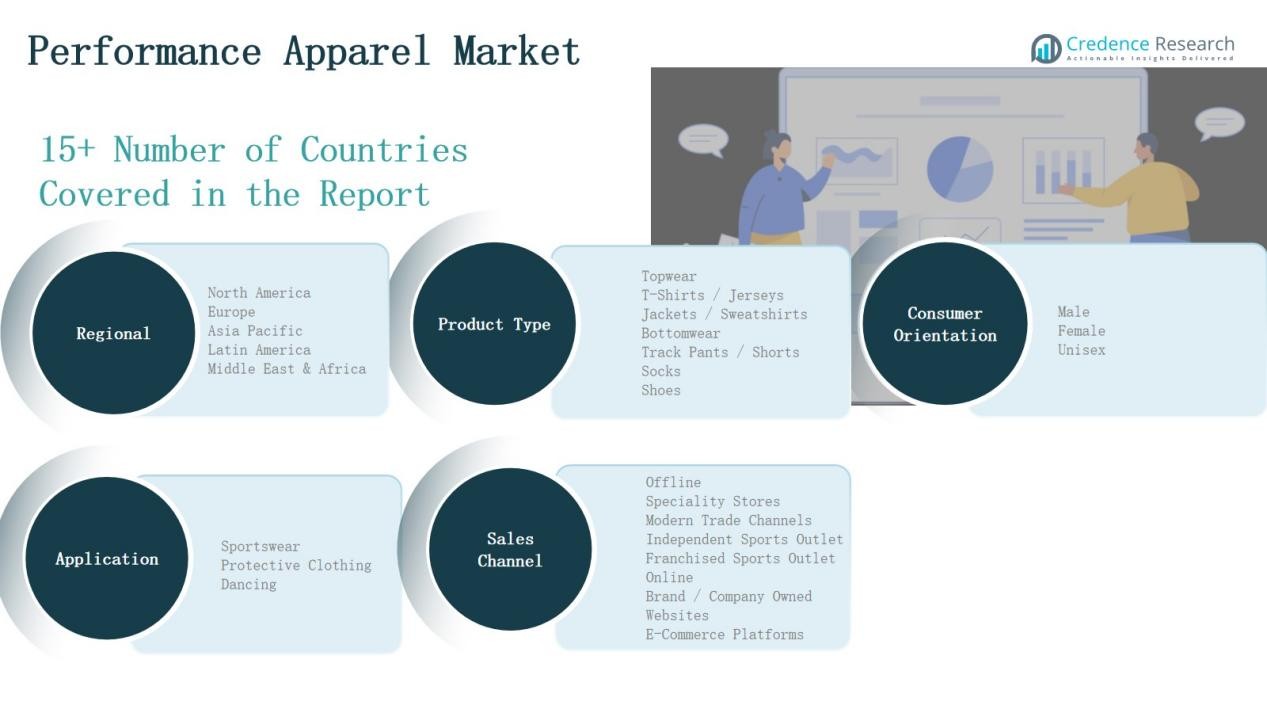
By Product Type
Topwear
- T-Shirts / Jerseys
- Jackets / Sweatshirts
Bottomwear
- Track Pants / Shorts
- Socks
- Shoes
By Consumer Orientation
- Male
- Female
- Unisex
By Application
- Sportswear
- Protective Clothing
- Dancing
By Sales Channel
Offline
- Specialty Stores
- Modern Trade Channels
- Independent Sports Outlets
- Franchised Sports Outlets
Online
- Brand / Company-Owned Websites
- E-Commerce Platforms
By Region
- North America (U.S., Canada, Mexico)
- Europe (UK, France, Germany, Italy, Spain, Russia, Rest of Europe)
- Asia Pacific (China, Japan, South Korea, India, Australia, Southeast Asia, Rest of Asia Pacific)
- Latin America (Brazil, Argentina, Rest of Latin America)
- Middle East (GCC Countries, Israel, Turkey, Rest of Middle East)
- Africa (South Africa, Egypt, Rest of Africa)
Competitive Landscape
The Performance Apparel Market is highly competitive, shaped by global leaders and regional players focusing on innovation, branding, and distribution. Leading companies such as Nike, Adidas, Under Armour, Puma, and Lululemon Athletica dominate with strong brand equity, advanced product portfolios, and extensive retail networks. These firms emphasize high-performance fabrics, sustainable sourcing, and digital integration to differentiate offerings. Columbia Sportswear, ASICS, Patagonia, and The North Face leverage niche strengths in outdoor and specialized apparel. Emerging players in Asia, including Anta Sports, gain share through competitive pricing and localized strategies. Partnerships with athletes, expansion of e-commerce platforms, and investment in athleisure styles are key strategies across the market. Intense price competition, frequent product launches, and rising counterfeit risks define the competitive environment. Companies increasingly focus on balancing affordability with innovation, while sustainability and eco-friendly practices have become critical factors shaping long-term positioning and consumer loyalty in the global market.
Key Players
- Nike
- Adidas
- Under Armour
- Puma
- Lululemon Athletica
- Columbia Sportswear
- ASICS
- Patagonia
- The North Face (VF Corporation)
- Reebok
- Anta Sports Products
- Hanesbrands
Recent Developments
- In Feburary 2025, Galaxy Universal acquired Reebok Design Group and U.S. operations of Reebok, taking control of its footwear wholesale, retail, and e-commerce channels.
- On September 16, 2025, Black Diamond introduced its Fall/Winter 2025 collection, focusing on backcountry performance apparel built for demanding mountain conditions.
- In June 2025, Kontoor Brands completed acquisition of Helly Hansen for USD 1.3 billion, bringing the outdoor performance brand under its umbrella.
Report Coverage
The research report offers an in-depth analysis based on Product Type, Consumer Orientation, Application, Sales Channel and Region. It details leading market players, providing an overview of their business, product offerings, investments, revenue streams, and key applications. Additionally, the report includes insights into the competitive environment, SWOT analysis, current market trends, as well as the primary drivers and constraints. Furthermore, it discusses various factors that have driven market expansion in recent years. The report also explores market dynamics, regulatory scenarios, and technological advancements that are shaping the industry. It assesses the impact of external factors and global economic changes on market growth. Lastly, it provides strategic recommendations for new entrants and established companies to navigate the complexities of the market.
Future Outlook
- Demand for athleisure will continue to grow across both developed and emerging economies.
- Sustainable and eco-friendly performance fabrics will gain wider consumer acceptance.
- Online channels will strengthen as leading distribution platforms for global and regional brands.
- Personalization and smart apparel with wearable technology will see rising adoption.
- Collaborations with athletes and influencers will remain key brand growth strategies.
- Premiumization will expand as consumers pay more for style and functionality.
- Emerging markets in Asia and Latin America will provide new growth opportunities.
- Counterfeit product concerns will drive stronger authentication and brand protection measures.
- Innovations in material science will improve durability, comfort, and performance features.
- Omni-channel retail integration will enhance customer engagement and loyalty worldwide.
Request a Free Sample
Fill in your details and we'll send you a free sample report.
- Sample data tables & charts
- Research methodology
Need a Custom Version of This Report?
Tailor the scope, geography, or segments to your exact requirements.
- Custom geography or segment scope
- Direct access to our analyst team
Frequently Asked Questions
What is the current market size for Performance Apparel Market, and what is its projected size in 2032?
At what Compound Annual Growth Rate is the Performance Apparel Market projected to grow between 2025 and 2032?
Which Performance Apparel Market segment held the largest share in 2024?
What are the primary factors fueling the growth of the Performance Apparel Market?
Who are the leading companies in the Performance Apparel Market?
Which region commanded the largest share of the Performance Apparel Market in 2024?
Table of Content
Chapter 1. Report Introduction
- 1.1 Report Description & Purpose
- 1.1.1 Report Title & Market Definition
- 1.1.2 Unique Selling Propositions (USP) & Key Differentiators
- 1.1.3 Value Proposition for Stakeholders
- 1.2 Research Objectives
- 1.2.1 Market Sizing Objectives (Volume & Revenue) (Volume Where Applicable)
- 1.2.2 Segmentation Objectives
- 1.2.3 Competitive Intelligence Objectives
- 1.2.4 Forecast & Scenario Objectives
- 1.3 Report Scope
- 1.3.1 Performance Apparel Scope – Segments & Subsegments Covered
- 1.3.2 Geographic Scope – Regions & Countries Covered
- 1.3.3 Historical Period, Base Year & Forecast Period (2024; forecast to 2032)
- 1.3.4 Inclusions & Exclusions
- 1.4 Industry Classification & Applicable Codes
- 1.5 Currency, Measurement Units & Valuation Basis
- 1.6 Target Stakeholders
- 1.7 Limitations & Assumptions
Chapter 2. Executive Summary
- 2.1 Global Performance Apparel Market Snapshot
- 2.1.1 Market Size – Historical (2024) & Forecast (2024-2032) (2024: USD 10,758.71 million → 2032: USD 17,271.83 million)
- 2.1.2 Volume & Revenue – Global Totals (Volume Where Applicable)
- 2.1.3 Key Market Highlights – Top Five Facts
- 2.2 Performance Apparel Market Segmentation Snapshot
- 2.2.1 Market Split by Region – 2024 vs. 2032
- 2.3 Competitive Snapshot
- 2.3.1 Top 10 Players by Revenue Share – 2024
- 2.3.2 Top 10 Players by Volume Share – 2024 (Volume Where Applicable)
- 2.3.3 Recent Strategic Developments (18-Month Summary)
- 2.4 Key Investment Highlights & Strategic Conclusions
Chapter 3. Performance Apparel Market Dynamics & Industry Analysis
- 3.1 Market Overview & Context
- 3.1.1 Performance Apparel Market Position in the Broader Industry Value Chain
- 3.1.2 Demand Structure & Purchasing Dynamics
- 3.1.3 Market Maturity & Development Stage by Region
- 3.2 Performance Apparel Market Drivers
- 3.3 Performance Apparel Market Restraints & Challenges
- 3.4 Performance Apparel Market Opportunities
- 3.5 Porter's Five Forces Analysis
- 3.5.1 Threat of New Entrants
- 3.5.2 Bargaining Power of Suppliers
- 3.5.3 Bargaining Power of Buyers
- 3.5.4 Threat of Substitutes
- 3.5.5 Competitive Rivalry – Intensity Assessment
- 3.6 Performance Apparel Value Chain Analysis
- 3.6.1 Upstream – Key Inputs, Resources & Suppliers
- 3.6.1.1 Key Input/Resource 1
- 3.6.1.2 Key Input/Resource 2
- 3.6.1.3 Key Input/Resource 3
- 3.6.2 Midstream – Core Operations & Value Creation
- 3.6.2.1 Operating Model & Process Overview
- 3.6.2.2 Key Operating Locations & Capabilities by Company
- 3.6.3 Downstream – Market Channels & End Users
- 3.6.3.1 Direct Sales & Customer Engagement Channels
- 3.6.3.2 Indirect Sales, Intermediaries & Partner Channels
- 3.6.4 Value Chain Profitability Analysis
- 3.6.1 Upstream – Key Inputs, Resources & Suppliers
- 3.7 PESTEL Analysis
- 3.7.1 Political Factors
- 3.7.2 Economic Factors
- 3.7.3 Social Factors
- 3.7.4 Technological Factors
- 3.7.5 Environmental Factors
- 3.7.6 Legal Factors
- 3.8 Performance Apparel Supply Chain Analysis
- 3.8.1 Critical Input & Resource Availability Risk Assessment
- 3.8.2 Supplier & Operational Concentration Risk (Geographic Exposure)
- 3.8.3 Supply & Service Disruption Impact Analysis
- 3.9 Regulatory & Policy Landscape
Note: The regulatory and policy landscape section covers regulations based on their applicability to the market, Performance Apparel category, geography, and scope of the study. Only regulatory frameworks with a material impact on operations, compliance, trade, sustainability, or market access are analyzed in detail.
Chapter 4. Key Investment Pockets & Opportunity Analysis
- 4.1 Performance Apparel Market Attractiveness Analysis
- 4.1.1 By Region – Investment Attractiveness Matrix (Market Size × CAGR)
- 4.2 Absolute Revenue Growth Opportunity
- 4.2.1 By Region – Absolute Revenue Growth Through 2032
- 4.3 Incremental Demand Opportunity
- 4.3.1 By Region – Incremental Demand Through 2032
- 4.3.2 Segment – Incremental Demand
- 4.4 Emerging Submarket Opportunity Deep Dive (Subject to Applicability)
- 4.5 Priority Market Opportunity Scorecards
- 4.5.1 United States
- 4.5.2 Europe
- 4.5.3 Asia
- 4.5.4 Middle East & Africa
Note: Priority market opportunity scorecards reflect the geographic scope and strategic relevance of the study. Listed markets are indicative and may be adapted to the industry.
Chapter 5. Performance Apparel Cross-Border Trade & Market Access Analysis
- 5.1 International Trade & Cross-Border Activity Overview
- 5.1.1 Global Export Value by Country (2024)
- 5.1.2 Global Export Volume by Country (2024) (Volume Where Applicable)
- 5.1.3 Global Import Value by Country (2024)
- 5.1.4 Global Import Volume by Country (2024) (Volume Where Applicable)
- 5.1.5 Net Trade Balance by Country (2024)
- 5.2 Export Analysis – Segment
- 5.2.1 Category 1 (Applicable Classification Code)
- 5.2.2 Category 2 (Applicable Classification Code)
- 5.2.3 Category 3 (Applicable Classification Code)
- 5.2.4 Category 4 (Applicable Classification Code)
- 5.2.5 Category 5 (Applicable Classification Code)
- 5.3 Import Analysis – Segment
- 5.3.1 Category 1 (Applicable Classification Code)
- 5.3.2 Category 2 (Applicable Classification Code)
- 5.3.3 Category 3 (Applicable Classification Code)
- 5.3.4 Category 4 (Applicable Classification Code)
- 5.3.5 Category 5 (Applicable Classification Code)
- 5.4 Cross-Border Pricing & Transaction Benchmarks
- 5.4.1 Export Pricing – Segment & Country
- 5.4.2 Import Pricing – Segment & Source Country
- 5.4.3 Price Trends (2024)
- 5.5 Key Cross-Border Trade & Delivery Routes
- 5.5.1 Cross-Border Trade/Delivery Route 1
- 5.5.2 Cross-Border Trade/Delivery Route 2
- 5.5.3 Cross-Border Trade/Delivery Route 3
- 5.5.4 Cross-Border Trade/Delivery Route 4
- 5.5.5 Cross-Border Trade/Delivery Route 5
- 5.6 Trade Policy & Market Access Impact Assessment
- 5.6.1 Tariff & Non-Tariff Barriers
- 5.6.2 Regional Trade & Economic Integration Frameworks
- 5.6.3 Bilateral & Multilateral Trade Agreements
- 5.6.4 Cross-Border Operating, Licensing & Localization Requirements
Note: This chapter applies where cross-border trade or delivery is relevant to Performance Apparel. Goods, services, and digital offerings are assessed using applicable classifications and transaction measures. Import-export volumes, trade balances, and route analyses are included only where meaningful to the market.
Chapter 6. Competitive Landscape & Company Benchmarking
- 6.1 Performance Apparel Market Concentration & Structure
- 6.1.1 Herfindahl-Hirschman Index (HHI) – the historical period vs. 2024
- 6.1.2 Leading, Mid-Sized & Emerging Player Structure
- 6.1.3 Global, Regional & Local Player Dynamics
- 6.2 Performance Apparel Market Share Analysis – 2024
- 6.2.1 Global Revenue Share by Company
- 6.2.2 Global Volume Share by Company (Volume Where Applicable)
- 6.2.3 Regional Revenue Share
- 6.2.4 Market Share Evolution (the historical period vs. 2024)
- 6.2.5 Company Market Share by Key Segment
- 6.2.6 Company Market Share by Customer Group
- 6.3 Operating Scale, Capacity & Infrastructure Analysis
- 6.3.1 Global Operating Scale & Supply Capacity
- 6.3.2 Resource Utilization & Operating Efficiency
- 6.3.3 Output, Service Delivery & Activity Metrics
- 6.3.4 Operating Footprint & Infrastructure Map
- 6.3.5 Planned Operational & Capacity Expansion
- 6.4 Performance Apparel Competitive Benchmarking Matrix
- 6.4.1 Revenue, Growth, Profitability & Operating Metric Comparison
- 6.4.2 Channel Revenue Mix
- 6.4.3 Geographic Revenue Exposure
- 6.4.4 R&D Intensity
- 6.4.5 Sustainability Maturity
- 6.5 Strategic Developments in Performance Apparel (Last 24 Months)
- 6.5.1 Mergers, Acquisitions & Divestments
- 6.5.2 New Products, Services & Solutions in Performance Apparel
- 6.5.3 Operational & Infrastructure Expansions
- 6.5.4 Strategic Alliances, Joint Ventures & Partnerships
- 6.5.5 Distribution Expansion & Market Entry
- 6.5.6 Sustainability & ESG Initiatives
- 6.6 Competitive Strategy Mapping
- 6.6.1 Leader, Challenger, Follower & Niche Classification
- 6.6.2 Pricing Strategy Comparison
- 6.6.3 Channel Strategy Matrix
Note: Strategic developments are included based on their materiality and the availability of reliable information.
Chapter 7. Global Performance Apparel Market – By Sales & Delivery Channel
- 7.1 Segment Overview
- 7.1.1 Volume & Revenue Split by Channel (2024 & 2032) (Volume Where Applicable)
- 7.1.2 Channel Mix Evolution (2024-2032)
Chapter 8. Regional Market Analysis – Global Overview
- 8.1 Global Regional Overview
- 8.1.1 Regional Volume Share (Volume Where Applicable)
- 8.1.2 Regional Revenue Share
- 8.1.3 Regional Volume by Region (Volume Where Applicable)
- 8.1.4 Regional Revenue by Region
- 8.1.5 Regional Forecast Through 2032
- 8.2 Cross-Regional Segment Analysis
- 8.2.1 By Sales & Delivery Channel
- 8.2.2 By Competitive Positioning & Price Tier
Chapter 9. North America Performance Apparel Market
- 9.1 United States
- 9.2 Canada
- 9.3 Mexico
Chapter 10. Europe Performance Apparel Market
- 10.1 Germany
- 10.2 France
- 10.3 Italy
- 10.4 United Kingdom
- 10.5 Spain
- 10.6 Poland
- 10.7 Russia
- 10.8 Netherlands
- 10.9 Belgium
- 10.10 Sweden
- 10.11 Denmark
- 10.12 Norway
- 10.13 Rest of Europe
Chapter 11. Asia Pacific Performance Apparel Market
- 11.1 China
- 11.2 India
- 11.3 Japan
- 11.4 South Korea
- 11.5 Thailand
- 11.6 Indonesia
- 11.7 Vietnam
- 11.8 Malaysia
- 11.9 Australia
- 11.10 Rest of Asia Pacific
Chapter 12. Latin America Performance Apparel Market
- 12.1 Brazil
- 12.2 Argentina
- 12.3 Colombia
- 12.4 Chile
- 12.5 Rest of Latin America
Chapter 13. Middle East Performance Apparel Market
- 13.1 Saudi Arabia
- 13.2 United Arab Emirates
- 13.3 Turkey
- 13.4 Israel
- 13.5 Iran
- 13.6 Rest of the Middle East
Chapter 14. Africa Performance Apparel Market
- 14.1 South Africa
- 14.2 Egypt
- 14.3 Nigeria
- 14.4 Morocco
- 14.5 Rest of Africa
Chapter 15. Performance Apparel Company Profiles
- 15.1 [Company 01]
- 15.1.1 Company Overview
- 15.1.2 Key Management Personnel
- 15.1.3 Products & Services Portfolio
- 15.1.4 Financial Performance
- 15.1.5 Key Market Focus & Geographic Presence
- 15.1.6 Recent Developments & Strategic Initiatives
Note: The company profile list is preliminary and may change based on research findings, market developments, data availability, and client requirements.
Chapter 16. Appendices
- Appendix A – List of Abbreviations & Acronyms
- Appendix B – Industry Classification Code Reference – Full Series
- Appendix C – Supply, Output & Operating Capacity Data Tables
- Appendix D – End-Use & Demand Base Tables
- Appendix E – Demand, Adoption & Usage Assumptions
- Appendix F – Pricing & Revenue Metric Reference Tables
- Appendix G – Company Operations & Infrastructure Database
- Appendix H – Cross-Border Trade & Activity Data Tables (Where Applicable)
- Appendix I – Regulatory Summary Tables
- Appendix J – Primary Research Participant List (Anonymized)
- Appendix K – Primary Research Questionnaire Framework
- Appendix L – Data Sources & Bibliography
- Appendix M – Market Size Divergence & Source Comparison
Chapter 17. Research Methodology
- 17.1 Research Framework & Philosophy
- 17.2 Secondary Research – Sources, Hierarchy & Data Extraction
- 17.3 Data Modeling – Bottom-Up & Top-Down Market Sizing
- 17.4 Primary Research – Stakeholder Framework, LOI & Sample Sizes
- 17.5 Forecast Methodology – Regression, Scenario & Sensitivity Analysis
- 17.6 Quality Control – Four-Layer Validation Framework
- 17.7 Limitations & Standard Assumptions
- 17.8 Disclaimer
