
Market overview
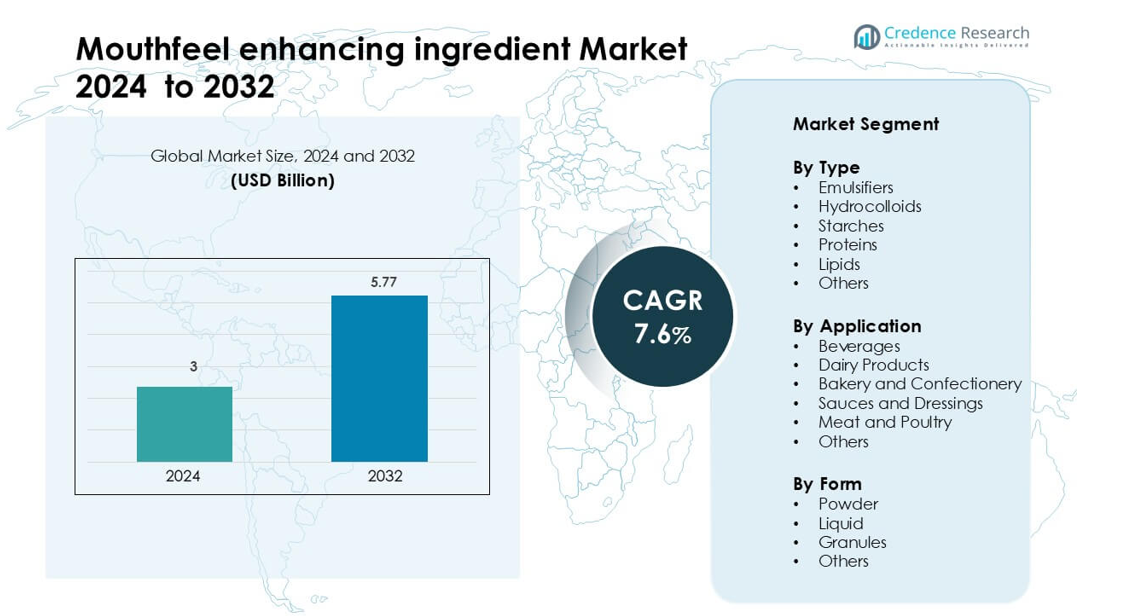
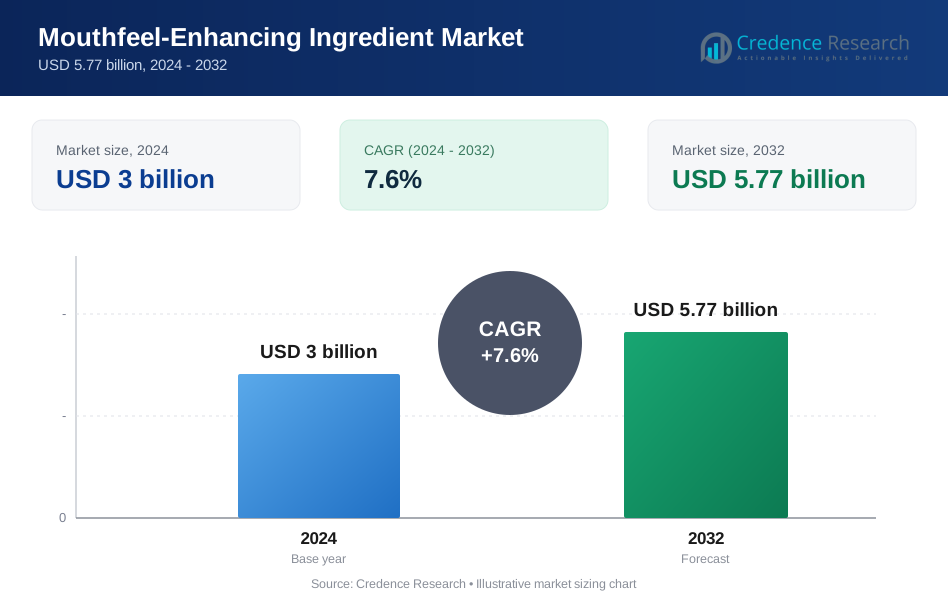
Mouthfeel enhancing ingredient Market was valued at USD 3 billion in 2024 and is anticipated to reach USD 5.77 billion by 2032, growing at a CAGR of 7.6% during the forecast period.
| REPORT ATTRIBUTE | DETAILS |
|---|---|
| Historical Period | 2020-2023 |
| Base Year | 2024 |
| Forecast Period | 2025-2032 |
| Mouthfeel Enhancing Ingredient Market Size 2024 | USD 3 billion |
| Mouthfeel Enhancing Ingredient Market, CAGR | 7.6% |
| Mouthfeel Enhancing Ingredient Market Size 2032 | USD 5.77 billion |
The mouthfeel enhancing ingredient market is shaped by major players such as Sensient Technologies Corporation, Cargill, Incorporated, Tate & Lyle, International Flavors & Fragrances, Givaudan, Corbion N.V., Kerry Group, Symrise AG, Ingredion Incorporated, and Firmenich. These companies compete through advanced emulsifiers, hydrocolloids, and starch-based systems that enhance creaminess, viscosity, and overall sensory appeal across beverages, dairy, bakery, and plant-based foods. They invest in clean-label solutions, texture innovation, and regional expansion to meet rising global demand. Asia-Pacific leads the market with a 37% share, supported by rapid growth in packaged foods, dairy alternatives, and ready-to-drink beverages across major economies.
Market Insights
- The global mouthfeel enhancing ingredient market was valued at USD 3 in 2024 and is projected to reach USD 5.77 by 2032, expanding at a CAGR of 7.6 % during the forecast period.
- Strong demand for smooth, creamy, and stable textures in beverages and dairy drives adoption, with emulsifiers holding a 32% type share and powder form leading with a 47% share due to easy handling and shelf stability.
- Clean-label preference, growth of plant-based foods, and rising use of hydrocolloids and specialty starches shape key trends, especially in dairy alternatives and high-protein drinks.
- Competitive intensity remains high as global players focus on natural solutions, tailored texture systems, and regional capacity expansion, while raw material variability and reformulation complexity act as restraints.
- Asia-Pacific leads with a 37% regional share, followed by North America at 33% and Europe at 28%, reflecting strong packaged food consumption, growing beverage demand, and expanding plant-based product adoption across major markets
Market Segmentation Analysis:
By Type
Emulsifiers lead the type segment with a 32% share, driven by their strong role in improving texture, stability, and smoothness across diverse food systems. These additives help create uniform dispersion in fat–water mixtures, which enhances creaminess in beverages, spreads, and sauces. Hydrocolloids expand due to rising demand for thickening and gelling solutions in clean-label products. Starches support cost-effective viscosity control in processed foods, while proteins gain traction in high-protein formulations. Lipids and other specialty agents advance steadily as brands develop richer textures for premium categories.
- For instance, Cargill's plant-based lecithin solutions are derived exclusively from plants (soybean, sunflower, rapeseed). These solutions have been used to improve dough release, moisture retention, and fat dispersion in bakery applications. In confectionery applications, they help adjust viscosity and reduce the need for expensive cocoa butter, keeping costs in check.
By Application
Beverages dominate the application segment with a 29% share, supported by strong use in dairy drinks, plant-based beverages, and nutritional blends that require smooth mouthfeel and reduced grittiness. These formulations rely on stabilizers and emulsifiers to maintain suspension and enhance sensory appeal. Dairy products remain a major user as manufacturers focus on creamy textures in yogurts, desserts, and cheese alternatives. Bakery and confectionery brands adopt these ingredients to enhance softness and moisture retention. Sauces, dressings, and meat products also grow due to rising demand for richer, more uniform textures.
- For instance, Kerry Group developed a stabilizer system for a whole-grain dairy-based protein beverage that delivered 8 g of whole grains and 8 g of milk protein per 8-oz glass while maintaining uniform suspension through ultra-high-temperature pasteurisation.
By Form
Powder form holds the leading position with a 47% share, driven by easy handling, long shelf life, and strong compatibility with dry blending processes. Powdered emulsifiers and hydrocolloids are widely used in bakery mixes, instant beverages, and dairy applications because they disperse quickly and provide consistent performance. Liquid forms gain traction in sauces, dressings, and ready-to-drink beverages that need rapid solubility. Granules expand in industrial setups seeking reduced dusting and improved flow. Other specialized forms progress as manufacturers design tailored delivery systems for advanced texture control.
Key Growth Drivers
Growing Demand for Premium Texture Experiences
Rising consumer interest in smooth, creamy, and indulgent textures drives strong demand for mouthfeel enhancing ingredients across food and beverage categories. Brands focus on sensory appeal because texture influences product acceptance as much as taste. This shift encourages wider use of emulsifiers, hydrocolloids, and specialized starches to deliver richness in beverages, dairy items, sauces, and plant-based foods. Clean-label trends also push manufacturers to replace artificial thickeners with natural gums and proteins. Premiumization in ready-to-drink beverages and high-protein snacks strengthens adoption as companies refine viscosity, creaminess, and stability. Growing urban lifestyles, rising income levels, and the popularity of café-style products further boost the need for advanced texture solutions.
- For instance, Ingredion Incorporated reports that 79% of consumers agree that texture impacts their overall satisfaction with a food product, and 8 in 10 say they are likely to recommend a product based on its texture.
Expansion of Plant-Based and Low-Fat Formulations
The rapid rise of plant-based, low-fat, and reduced-sugar products increases demand for mouthfeel enhancers that compensate for lost creaminess and body. Milk alternatives, meat analogues, and functional beverages require stabilizers and structured lipids to achieve desirable thickness and smoothness. Plant-protein products often struggle with grainy textures, prompting stronger dependence on hydrocolloids, modified starches, and emulsification systems. As consumers shift to health-focused diets, manufacturers look for solutions that maintain indulgent mouthfeel without added fat or sugar. This trend expands opportunities for natural gums, enzymatically modified starches, and next-generation protein-based mouthfeel agents designed for clean-label alignment.
- For instance, one published study demonstrated that a binary mixture of modified oat flour and faba bean protein isolate used at 2 % (w/w) produced plant-based Pickering emulsions with droplet sizes ranging 14.00 to 20.57 µm, yielding a thick consistency and smooth shear-thinning behaviour in a non-dairy cream alternative.
Rising Use of Advanced Food Processing Technologies
Innovations in high-shear mixing, micro-emulsification, and cold-processing systems enable better dispersion and improved functionality of mouthfeel ingredients. Modern processing unlocks smoother textures in beverages, soups, desserts, and fortified foods while reducing ingredient usage and improving cost efficiency. Growth in ready-to-drink nutrition products pushes adoption of technologies that prevent sedimentation and enhance fluid consistency. Companies use encapsulation and controlled-release systems to deliver richer textures while protecting ingredient stability. As automation expands in food manufacturing, producers increasingly choose mouthfeel enhancers that perform reliably under diverse processing conditions, supporting consistent quality in large-scale production.
Key Trends and Opportunities
Growing Preference for Clean-Label Texture Systems
Consumers now prefer natural, minimally processed solutions, which drives manufacturers to replace synthetic emulsifiers and thickeners with plant-derived hydrocolloids, natural starches, and protein-based stabilizers. This shift creates opportunities for suppliers offering label-friendly texture systems that still deliver stability, viscosity, and creaminess. Food brands explore botanical gums, pulse proteins, and fermentation-derived ingredients that improve texture without compromising transparency or nutritional claims. As clean-label regulations strengthen across regions, companies invest in simple ingredient lists that still support desirable mouthfeel across beverages, baked goods, sauces, and dairy alternatives.
- For instance, ADM’s Stabrium™ Hydrocolloid Solutions 100 and 200 were formulated as dry blends of plant-based ingredients that helped a yoghurt alternative brand reduce its ingredient list from 9 to 6 distinct texture modifiers, while achieving comparable viscosity and syneresis control.
R&D Focus on Customized Texture Profiles
Manufacturers now develop tailored texture solutions that fit distinct product categories, such as velvety dairy alternatives, airy bakery fillings, or gel-based confectionery. Growing interest in multisensory eating experiences encourages brands to focus on mouth-coating effects, melt-in-mouth sensations, and enhanced moisture retention. Companies expand R&D efforts to design blends that perform across varied pH levels, temperature cycles, and processing environments. This focus opens opportunities for hybrid systems that combine proteins, lipids, and hydrocolloids to deliver precise textures for premium and functional food launches.
- For instance, Ingredion consistently highlights the importance of texture in consumer preference and uses its own research, such as the "Texture Research study" and the global ATLAS database, to demonstrate ingredient performance.
Increasing Demand from Functional and Nutritional Products
Functional beverages, sports nutrition products, and fortified foods require consistent viscosity and smoothness to improve consumer acceptance. As high-protein and high-fiber formulations become more common, demand rises for ingredients that reduce chalkiness and enhance flow. This trend opens space for advanced emulsifiers, fiber-based texturizers, and heat-stable gums optimized for nutraceutical applications. Companies leverage this shift to introduce specialized systems that sustain mouthfeel even under thermal processing or long-term storage.
Key Challenges
Raw Material Price Instability
Price fluctuations in natural gums, plant-based proteins, starch derivatives, and lipid sources create uncertainty for manufacturers. Climatic changes, limited regional cultivation, and supply chain disruptions often affect the availability of raw materials used in texture-enhancing systems. This instability increases production costs and pressures companies to optimize formulations or find alternative sources. Smaller manufacturers face greater challenges due to lower procurement power. Maintaining consistent product performance also becomes difficult when ingredient specifications vary due to crop quality issues. These factors create a persistent challenge for market expansion.
Complexity in Achieving Clean-Label and High-Performance Balance
Delivering indulgent mouthfeel while meeting clean-label demands remains a major technical challenge. Natural alternatives often have limitations related to flavor masking, stability, or functionality under heat and shear conditions. Reformulation becomes complex when replacing synthetic emulsifiers or modified starches without compromising texture, shelf life, or processing efficiency. Brands must also comply with regional regulations that restrict certain hydrocolloids or additives. R&D efforts grow more intensive as companies attempt to create minimal-ingredient formulations with performance comparable to conventional systems. This balance continues to challenge manufacturers across product categories.
Regional Analysis
North America
North America holds a 33% share of the mouthfeel enhancing ingredient market, supported by strong demand for premium textures in beverages, dairy, and functional nutrition products. The region benefits from advanced food processing technologies and high adoption of clean-label stabilizers and emulsifiers. Growth in plant-based milk, protein-enriched drinks, and reduced-fat formulations increases the need for hydrocolloids and specialty starches. Major manufacturers focus on customized texture systems for ready-to-drink beverages and bakery applications. The mature packaged food sector and rising interest in indulgent yet healthy products keep North America a leading market for advanced mouthfeel solutions.
Europe
Europe accounts for a 28% share of the market, driven by strict quality standards, clean-label requirements, and a strong focus on natural texture systems. Dairy and bakery remain major users as manufacturers enhance creaminess, softness, and stability in premium and artisanal products. Plant-based food growth strengthens demand for hydrocolloids and protein-based texturizers that address grainy or thin textures. The region’s mature regulatory environment accelerates adoption of natural gums, enzymatically modified starches, and structured lipids. Innovation in low-fat spreads, sauces, and confectionery also supports sustained regional consumption of mouthfeel enhancing ingredients.
Asia-Pacific
Asia-Pacific leads with a 37% share, supported by rapid growth in packaged foods, beverages, and dairy alternatives across China, India, and Southeast Asia. Rising incomes and urban lifestyles drive demand for smooth, creamy, and indulgent textures in ready-to-drink beverages, bakery goods, and snack products. Expansion of plant-based and fortified beverages boosts use of stabilizers and emulsifiers that improve suspension and mouth-coating properties. Local manufacturers increasingly invest in hydrocolloids and advanced starches to match global texture standards. Fast-growing foodservice and convenience sectors strengthen Asia-Pacific’s position as the fastest-expanding market.
Latin America
Latin America holds a 7% share, driven by rising consumption of dairy drinks, flavored beverages, and bakery products that require improved mouthfeel. Brazil and Mexico lead adoption as manufacturers enhance creaminess and consistency in affordable and value-added food products. The region shows growing interest in natural gums and starch-based solutions for clean-label reformulations. Expansion of ready-to-eat and on-the-go products increases reliance on stabilizers that provide uniform textures under warm climates. Although cost-sensitive, the market benefits from increasing investments in texture optimization for sauces, snacks, and confectionery.
Middle East & Africa
The Middle East & Africa region accounts for a 5% share, supported by growing demand for processed foods, dairy products, and flavored beverages that require consistent mouthfeel. Higher temperatures increase the need for stabilizers and emulsifiers that maintain viscosity and prevent separation. Urbanization and rising interest in premium bakery, confectionery, and ready-to-drink beverages strengthen adoption of hydrocolloids and modified starches. Manufacturers in the Gulf countries focus on texture improvement to match international product standards. Although growth is gradual, increasing investments in food manufacturing capacity enhance the long-term outlook for mouthfeel enhancing ingredients.
Market Segmentations:
By Type
- Emulsifiers
- Hydrocolloids
- Starches
- Proteins
- Lipids
- Others
By Application
- Beverages
- Dairy Products
- Bakery and Confectionery
- Sauces and Dressings
- Meat and Poultry
- Others
By Form
- Powder
- Liquid
- Granules
- Others
By Geography
- North America
- U.S.
- Canada
- Mexico
- Europe
- Germany
- France
- U.K.
- Italy
- Spain
- Rest of Europe
- Asia Pacific
- China
- Japan
- India
- South Korea
- South-east Asia
- Rest of Asia Pacific
- Latin America
- Brazil
- Argentina
- Rest of Latin America
- Middle East & Africa
- GCC Countries
- South Africa
- Rest of the Middle East and Africa
Competitive Landscape
The competitive landscape of the mouthfeel enhancing ingredient market features a mix of global ingredient suppliers, specialized stabilizer manufacturers, and innovation-driven formulation companies that compete through technology, product range, and clean-label alignment. Leading players focus on advanced hydrocolloids, emulsifiers, modified starches, and structured lipids designed to enhance creaminess, viscosity, and texture consistency across beverages, dairy products, bakery items, sauces, and plant-based foods. Companies strengthen their portfolios through R&D investments, patented texture systems, and customer-specific formulation support. Many suppliers expand clean-label and natural ingredient lines to meet rising demand for botanical gums and minimally processed solutions. Strategic partnerships with food manufacturers help deliver customized texture profiles for emerging categories such as protein-rich drinks, low-fat dairy alternatives, and functional beverages. Global players also expand production capacity in Asia-Pacific and Latin America to serve high-growth regions and reduce supply risks. Continuous innovation, sustainability focus, and tailored technical services define the competitive intensity in this market.
Key Player Analysis
- Sensient Technologies Corporation
- Cargill, Incorporated
- Tate & Lyle
- International Flavors & Fragrances (IFF)
- Givaudan
- Corbion N.V.
- Kerry Group
- Symrise AG
- Ingredion Incorporated
- Firmenich
Recent Developments
- In June 2025, Givaudan announced that it is developing technologies focused on masking off-notes and enhancing mouthfeel to create more authentic meat-like textures in plant-based applications.
- In April 2023, Sensient introduced a vegetable-protein extract called “Nacre”, positioned as a clean-label, low-salt, high-protein flavoring solution that boosts umami and delivers pleasant mouthfeel across applications including plant-based meats, snacks, sauces, soups and bakery
Report Coverage
The research report offers an in-depth analysis based on Type, Application, Form and Geography. It details leading market players, providing an overview of their business, product offerings, investments, revenue streams, and key applications. Additionally, the report includes insights into the competitive environment, SWOT analysis, current market trends, as well as the primary drivers and constraints. Furthermore, it discusses various factors that have driven market expansion in recent years. The report also explores market dynamics, regulatory scenarios, and technological advancements that are shaping the industry. It assesses the impact of external factors and global economic changes on market growth. Lastly, it provides strategic recommendations for new entrants and established companies to navigate the complexities of the market.
Future Outlook
- Demand for clean-label mouthfeel solutions will rise across beverages and dairy alternatives.
- Plant-based food growth will increase the need for advanced hydrocolloids and emulsifiers.
- Texture optimization will become essential in high-protein and functional nutrition products.
- Companies will adopt natural gums and protein-based systems to replace synthetic ingredients.
- Encapsulation and structured lipid technologies will gain wider use for improved creaminess.
- Customized texture blends will expand to support premium bakery and confectionery launches.
- Regional manufacturers will increase capacity to reduce supply risks and improve availability.
- AI-assisted formulation tools will help design targeted mouthfeel profiles faster.
- Sustainability goals will drive development of bio-based and low-impact texturizing agents.
- Regulatory focus on transparency will accelerate innovation in minimally processed texture systems.
Request a Free Sample
Fill in your details and we'll send you a free sample report.
- Sample data tables & charts
- Research methodology
Need a Custom Version of This Report?
Tailor the scope, geography, or segments to your exact requirements.
- Custom geography or segment scope
- Direct access to our analyst team
Frequently Asked Questions
What is the current market size for Mouthfeel Enhancing Ingredient Market, and what is its projected size in 2032?
At what Compound Annual Growth Rate is the Mouthfeel Enhancing Ingredient Market projected to grow between 2025 and 2032?
Which segment is expected to post the highest CAGR during the forecast period?
Who are the major players in the global Mouthfeel enhancing ingredient market?
What is the major market driver of the mouthfeel-enhancing ingredient industry?
What are the major market restraints of the mouthfeel-enhancing ingredient industry?
What are the major market opportunities of the mouthfeel-enhancing ingredient industry?
Who are the leading companies in the Mouthfeel Enhancing Ingredient Market?
Table of Content
Chapter 1. Report Introduction
- 1.1 Report Description & Purpose
- 1.1.1 Report Title & Market Definition
- 1.1.2 Unique Selling Propositions (USP) & Key Differentiators
- 1.1.3 Value Proposition for Stakeholders
- 1.2 Research Objectives
- 1.2.1 Market Sizing Objectives (Volume & Revenue)
- 1.2.2 Segmentation Objectives
- 1.2.3 Competitive Intelligence Objectives
- 1.2.4 Forecast & Scenario Objectives
- 1.3 Report Scope
- 1.3.1 Mouthfeel-Enhancing Ingredient Scope – Types & Subtypes Covered
- 1.3.2 Geographic Scope – Regions & Countries Covered
- 1.3.3 Historical Period, Base Year & Forecast Period (2024; forecast to 2032)
- 1.3.4 Inclusions & Exclusions
- 1.4 HS Code & Classification Framework
- 1.5 Currency, Units & Pricing Basis
- 1.6 Target Stakeholders
- 1.7 Limitations & Assumptions
Chapter 2. Executive Summary
- 2.1 Global Mouthfeel-Enhancing Ingredient Market Snapshot
- 2.1.1 Market Size – Historical (2024) & Forecast (2024-2032) (2024: USD 3 billion → 2032: USD 5.77 billion)
- 2.1.2 Volume & Revenue – Global Totals
- 2.1.3 Key Market Highlights – Top Five Facts
- 2.2 Mouthfeel-Enhancing Ingredient Market Segmentation Snapshot
- 2.2.1 Market Split by Region – 2024 vs. 2032
- 2.3 Competitive Snapshot
- 2.3.1 Top 10 Players by Revenue Share – 2024
- 2.3.2 Top 10 Players by Volume Share – 2024
- 2.3.3 Recent Strategic Developments (18-Month Summary)
- 2.4 Key Investment Highlights & Strategic Conclusions
Chapter 3. Mouthfeel-Enhancing Ingredient Market Dynamics & Industry Analysis
- 3.1 Market Overview & Context
- 3.1.1 Mouthfeel-Enhancing Ingredient Market Position in the Broader Automotive Value Chain
- 3.1.2 OEM vs. Replacement Market Dynamics
- 3.1.3 Market Maturity & Development Stage by Region
- 3.2 Mouthfeel-Enhancing Ingredient Market Drivers
- 3.3 Mouthfeel-Enhancing Ingredient Market Restraints & Challenges
- 3.4 Mouthfeel-Enhancing Ingredient Market Opportunities
- 3.5 Porter's Five Forces Analysis
- 3.5.1 Threat of New Entrants
- 3.5.2 Bargaining Power of Suppliers
- 3.5.3 Bargaining Power of Buyers
- 3.5.4 Threat of Substitutes
- 3.5.5 Competitive Rivalry – Intensity Assessment
- 3.6 Mouthfeel-Enhancing Ingredient Value Chain Analysis
- 3.6.1 Upstream – Raw Material/Input Suppliers
- 3.6.1.1 Raw Material/Input 1
- 3.6.1.2 Raw Material/Input 2
- 3.6.1.3 Raw Material/Input 3
- 3.6.2 Midstream – Production/Manufacturing/Service Delivery
- 3.6.2.1 Production/Process Overview
- 3.6.2.2 Key Facility Locations & Capacity by Manufacturer
- 3.6.3 Downstream – Distribution & End Consumer
- 3.6.3.1 Primary Channel – B2B/OEM
- 3.6.3.2 Secondary Channels – Dealer, Retail, Online, Direct
- 3.6.4 Value Chain Profitability Analysis
- 3.6.1 Upstream – Raw Material/Input Suppliers
- 3.7 PESTEL Analysis
- 3.7.1 Political Factors
- 3.7.2 Economic Factors
- 3.7.3 Social Factors
- 3.7.4 Technological Factors
- 3.7.5 Environmental Factors
- 3.7.6 Legal Factors
- 3.8 Mouthfeel-Enhancing Ingredient Supply Chain Analysis
- 3.8.1 Raw Material/Input Supply Risk Assessment
- 3.8.2 Manufacturing Concentration Risk (Geographic Exposure)
- 3.8.3 Trade Disruption Impact Analysis
- 3.9 Regulatory & Policy Landscape
Note: The regulatory and policy landscape section covers regulations based on their applicability to the market, Mouthfeel-Enhancing Ingredient category, geography, and scope of the study. Only regulatory frameworks with a material impact on operations, compliance, trade, sustainability, or market access are analyzed in detail.
Chapter 4. Key Investment Pockets & Opportunity Analysis
- 4.1 Mouthfeel-Enhancing Ingredient Market Attractiveness Analysis
- 4.1.1 By Region – Investment Attractiveness Matrix (Volume × CAGR)
- 4.2 Absolute Revenue Growth Opportunity
- 4.2.1 By Region – Absolute USD Growth Through 2032
- 4.3 Incremental Volume Opportunity
- 4.3.1 By Region – Incremental Volume Through 2032
- 4.3.2 Segment – Incremental Volume
- 4.4 Emerging Submarket Opportunity Deep Dive (Subject to Applicability)
- 4.5 Emerging Market Opportunity Scorecards
- 4.5.1 United States
- 4.5.2 Europe
- 4.5.3 Asia
- 4.5.4 Middle East & Africa
Note: Emerging Market Opportunity Scorecards will be included based on relevance and strategic importance. Regions listed are indicative and may vary depending on data availability and market dynamics.
Chapter 5. Mouthfeel-Enhancing Ingredient Import-Export Analysis & Trade Flows
- 5.1 Global Trade Overview
- 5.1.1 Global Export Value by Country (2024)
- 5.1.2 Global Export Volume by Country (2024)
- 5.1.3 Global Import Value by Country (2024)
- 5.1.4 Global Import Volume by Country (2024)
- 5.1.5 Net Trade Balance by Country (2024)
- 5.2 Export Analysis – Segment
- 5.2.1 Type 1 (HS Code)
- 5.2.2 Type 2 (HS Code)
- 5.2.3 Type 3 (HS Code)
- 5.2.4 Type 4 (HS Code)
- 5.2.5 Type 5 (HS Code)
- 5.3 Import Analysis – Segment
- 5.3.1 Type 1 (HS Code)
- 5.3.2 Type 2 (HS Code)
- 5.3.3 Type 3 (HS Code)
- 5.3.4 Type 4 (HS Code)
- 5.3.5 Type 5 (HS Code)
- 5.4 Average Unit Trade Prices
- 5.4.1 Average Export Price – Segment & Country
- 5.4.2 Average Import Price – Segment & Source Country
- 5.4.3 Price Trends (2024)
- 5.5 Key Trade Route Analysis
- 5.5.1 Trade Route 1
- 5.5.2 Trade Route 2
- 5.5.3 Trade Route 3
- 5.5.4 Trade Route 4
- 5.5.5 Trade Route 5
- 5.6 Trade Policy Impact Assessment
- 5.6.1 US Anti-Dumping & Section 301 Tariffs
- 5.6.2 EU Customs Union Impact
- 5.6.3 Major Free Trade Agreements
- 5.6.4 USMCA Rules of Origin
Note: Trade policy analysis will be included only where relevant to the Mouthfeel-Enhancing Ingredient market.
Chapter 6. Competitive Landscape & Company Benchmarking
- 6.1 Mouthfeel-Enhancing Ingredient Market Concentration & Structure
- 6.1.1 Herfindahl-Hirschman Index (HHI) – vs. 2024
- 6.1.2 Tier 1, Tier 2 & Tier 3 Market Structure
- 6.1.3 Global, Regional & Local Player Dynamics
- 6.2 Mouthfeel-Enhancing Ingredient Market Share Analysis – 2024
- 6.2.1 Global Revenue Share by Company
- 6.2.2 Global Volume Share by Company
- 6.2.3 Regional Revenue Share
- 6.2.4 Market Share Evolution ( vs. 2024)
- 6.2.5 OEM Segment Share by Company
- 6.2.6 Replacement Segment Share by Company
- 6.3 Production/Delivery Capacity & Facility Analysis
- 6.3.1 Global Installed Capacity
- 6.3.2 Capacity Utilization Rates
- 6.3.3 Production/Output Volume
- 6.3.4 Facility Locations & Capacity Map
- 6.3.5 Planned Capacity Additions
- 6.4 Mouthfeel-Enhancing Ingredient Competitive Benchmarking Matrix
- 6.4.1 Revenue, Volume, CAGR & Profitability Comparison
- 6.4.2 Channel Revenue Mix
- 6.4.3 Geographic Revenue Exposure
- 6.4.4 R&D Intensity
- 6.4.5 Sustainability Maturity
- 6.5 Strategic Developments in Mouthfeel-Enhancing Ingredient (Last 24 Months)
- 6.5.1 Mergers, Acquisitions & Divestments
- 6.5.2 New Mouthfeel-Enhancing Ingredient Launches
- 6.5.3 Facility Expansions
- 6.5.4 Strategic Alliances, Joint Ventures & Partnerships
- 6.5.5 Distribution Expansion & Market Entry
- 6.5.6 Sustainability & ESG Initiatives
- 6.6 Competitive Strategy Mapping
- 6.6.1 Leader, Challenger, Follower & Niche Classification
- 6.6.2 Pricing Strategy Comparison
- 6.6.3 Channel Strategy Matrix
Note: Strategic developments are included based on their materiality and the availability of reliable information.
Chapter 7. Global Mouthfeel-Enhancing Ingredient Market – By Distribution Channel
- 7.1 Segment Overview
- 7.1.1 Volume & Revenue Split by Channel (2024 & 2032)
- 7.1.2 Channel Mix Evolution (2024-2032)
Chapter 8. Regional Market Analysis – Global Overview
- 8.1 Global Regional Overview
- 8.1.1 Regional Volume Share
- 8.1.2 Regional Revenue Share
- 8.1.3 Regional Volume by Region
- 8.1.4 Regional Revenue by Region
- 8.1.5 Regional Forecast Through 2032
- 8.2 Cross-Regional Segment Analysis
- 8.2.1 By Distribution Channel
- 8.2.2 By Brand/Price Tier
Chapter 9. North America Mouthfeel-Enhancing Ingredient Market
- 9.1 United States
- 9.2 Canada
- 9.3 Mexico
Chapter 10. Europe Mouthfeel-Enhancing Ingredient Market
- 10.1 Germany
- 10.2 France
- 10.3 Italy
- 10.4 United Kingdom
- 10.5 Spain
- 10.6 Poland
- 10.7 Russia
- 10.8 Netherlands
- 10.9 Belgium
- 10.10 Sweden
- 10.11 Denmark
- 10.12 Norway
- 10.13 Rest of Europe
Chapter 11. Asia Pacific Mouthfeel-Enhancing Ingredient Market
- 11.1 China
- 11.2 India
- 11.3 Japan
- 11.4 South Korea
- 11.5 Thailand
- 11.6 Indonesia
- 11.7 Vietnam
- 11.8 Malaysia
- 11.9 Australia
- 11.10 Rest of Asia Pacific
Chapter 12. Latin America Mouthfeel-Enhancing Ingredient Market
- 12.1 Brazil
- 12.2 Argentina
- 12.3 Colombia
- 12.4 Chile
- 12.5 Rest of Latin America
Chapter 13. Middle East Mouthfeel-Enhancing Ingredient Market
- 13.1 Saudi Arabia
- 13.2 United Arab Emirates
- 13.3 Turkey
- 13.4 Israel
- 13.5 Iran
- 13.6 Rest of the Middle East
Chapter 14. Africa Mouthfeel-Enhancing Ingredient Market
- 14.1 South Africa
- 14.2 Egypt
- 14.3 Nigeria
- 14.4 Morocco
- 14.5 Rest of Africa
Chapter 15. Mouthfeel-Enhancing Ingredient Company Profiles
- 15.1 [Company 01]
- 15.1.1 Company Overview
- 15.1.2 Key Management Personnel
- 15.1.3 Products & Services Portfolio
- 15.1.4 Financial Performance
- 15.1.5 Key Market Focus & Geographic Presence
- 15.1.6 Recent Developments & Strategic Initiatives
Note: The company profile list is preliminary and may change based on research findings, market developments, data availability, and client requirements.
Chapter 16. Appendices
- Appendix A – List of Abbreviations & Acronyms
- Appendix B – Industry Classification Code Reference – Full Series
- Appendix C – Production & Capacity Data Tables
- Appendix D – End-Use & Demand Base Tables
- Appendix E – Consumption & Replacement Rate Assumptions
- Appendix F – ASP Reference Tables
- Appendix G – Manufacturing & Facility Database
- Appendix H – Import-Export Data Tables
- Appendix I – Regulatory Summary Tables
- Appendix J – Primary Research Participant List (Anonymized)
- Appendix K – Primary Research Questionnaire Framework
- Appendix L – Data Sources & Bibliography
- Appendix M – Market Size Divergence & Source Comparison
Chapter 17. Research Methodology
- 17.1 Research Framework & Philosophy
- 17.2 Secondary Research – Sources, Hierarchy & Data Extraction
- 17.3 Data Modeling – Bottom-Up & Top-Down Market Sizing
- 17.4 Primary Research – Stakeholder Framework, LOI & Sample Sizes
- 17.5 Forecast Methodology – Regression, Scenario & Sensitivity Analysis
- 17.6 Quality Control – Four-Layer Validation Framework
- 17.7 Limitations & Standard Assumptions
- 17.8 Disclaimer
