
Market overview
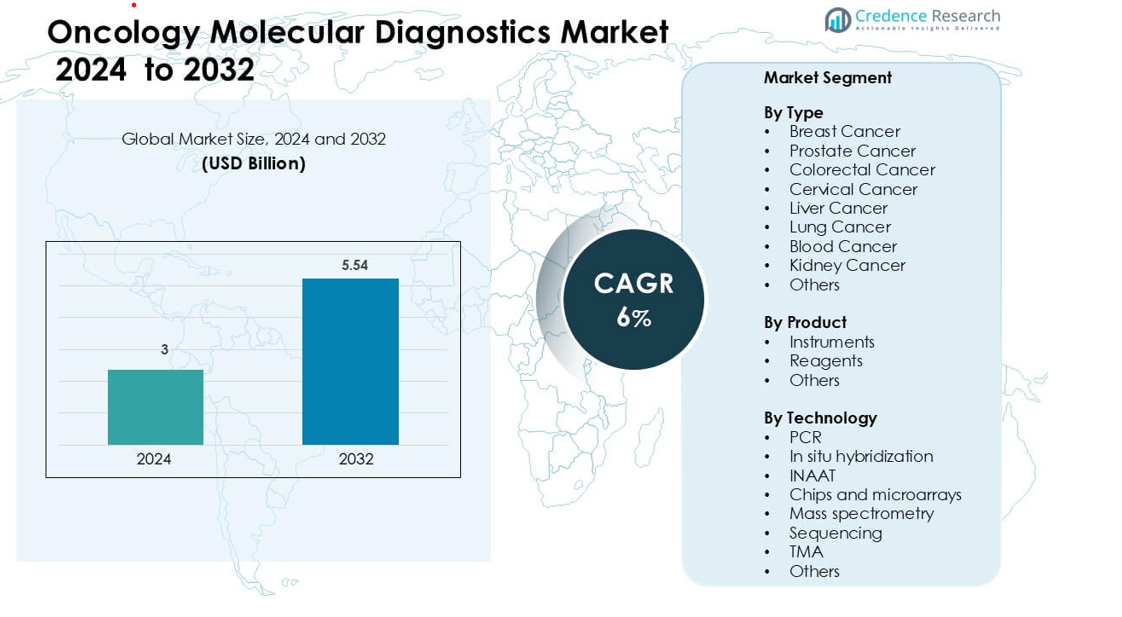
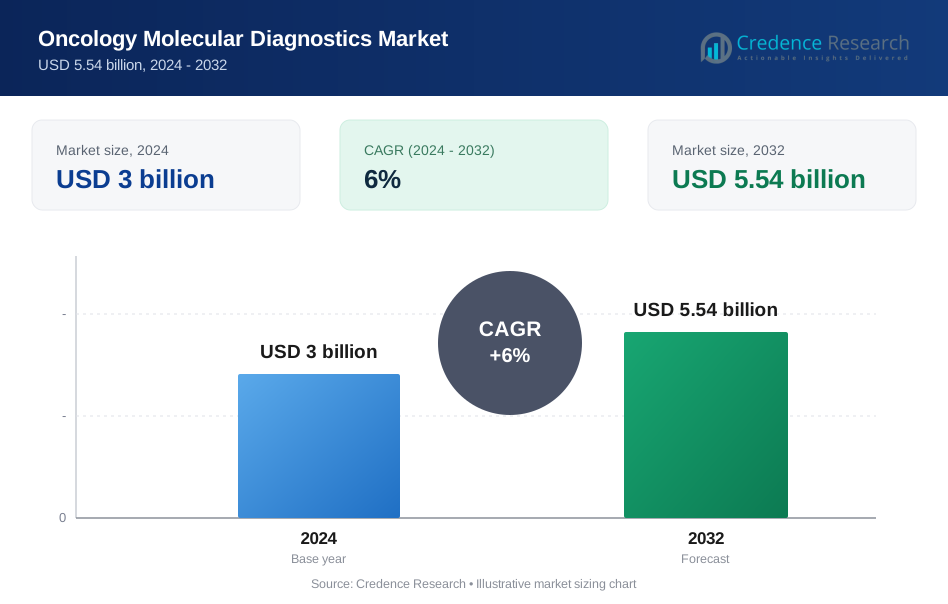
Oncology Molecular Diagnostics Market was valued at USD 3 billion in 2024 and is anticipated to reach USD 5.54 billion by 2032, growing at a CAGR of 6 % during the forecast period.
| REPORT ATTRIBUTE | DETAILS |
|---|---|
| Historical Period | 2020-2023 |
| Base Year | 2024 |
| Forecast Period | 2025-2032 |
| Oncology Molecular Diagnostics Market Size 2024 | USD 3 billion |
| Oncology Molecular Diagnostics Market, CAGR | 6% |
| Oncology Molecular Diagnostics Market Size 2032 | USD 5.54 billion |
The Oncology Molecular Diagnostics Market is shaped by leading companies that expand their capabilities in PCR, sequencing, liquid biopsy, and companion diagnostics to support precision cancer care. Major players focus on high-sensitivity assays, automated workflows, and advanced biomarker panels that enhance detection and treatment selection across major tumor types. These vendors strengthen their positions through partnerships with cancer centers and pharmaceutical developers, accelerating adoption of targeted testing. North America remains the leading region with a 41% share, driven by strong clinical genomics infrastructure, high investment in oncology research, and widespread integration of molecular diagnostics into routine cancer management.
Market Insights
- The Oncology Molecular Diagnostics Market was valued at USD 3 billion in 2024 and is projected to grow at a CAGR of 6% through 2032.
- Rising demand for precision oncology and increased adoption of biomarker-based testing drive strong market growth, supported by expanding use of PCR, sequencing, and liquid biopsy across major cancer types.
- Key trends include rapid integration of high-throughput platforms, growth of multi-cancer early detection assays, and rising adoption of AI-enabled analysis tools that enhance accuracy and reduce reporting time.
- The competitive landscape features global diagnostics leaders focusing on high-sensitivity assays, automated instruments, and strategic collaborations with oncology centers to expand biomarker panels and strengthen clinical utility.
- North America leads with a 41% share, followed by Europe at 30%, while Asia Pacific shows the fastest growth. By type, breast cancer dominates with a 26% share, and by technology, PCR leads with 34%, reflecting strong clinical adoption.
Market Segmentation Analysis:
By Type
Breast cancer leads this segment with a 26% share due to high global screening rates and strong adoption of genomic assays. Growing use of multigene panels helps clinicians predict recurrence risk and guide therapy selection. Increased awareness and expanded screening programs also support demand. Wider uptake of companion diagnostics strengthens the use of molecular tools in treatment planning. Advancements in liquid biopsy further enhance early detection and monitoring for breast cancer patients.
- For instance, Oncotype DX a 21‑gene assay developed by Exact Sciences Corp. has been used in over 900 000 patients worldwide, and in clinical studies involving nearly 4 000 patients its Recurrence Score changed treatment decisions in approximately 30 % of cases.
By Product
Reagents dominate this category with a 48% share, driven by recurring demand in diagnostic workflows. Laboratories rely on high-sensitivity reagents for PCR, sequencing, and hybridization tests, which boosts repeat purchases. Growth in personalized oncology testing increases reagent consumption across both centralized labs and hospital settings. Rising volumes of biomarker testing and the need for consistent assay performance support expansion. Continuous kit upgrades from manufacturers improve reliability and reduce processing time.
- For instance, QIAGEN N.V. announced that its sample‑preparation and consumable kits used to process over 3 billion biological samples to date across its platforms.
By Technology
PCR holds the highest share at 34% due to its established role in detecting cancer-specific mutations with high accuracy. Its rapid turnaround time and compatibility with diverse sample types support broad clinical adoption. Continued development of real-time and digital PCR enhances sensitivity and quantification for oncology applications. Sequencing technologies gain traction but remain secondary because of higher cost and workflow complexity. PCR’s scalability and strong presence in routine diagnostics sustain its leadership across global oncology testing.
Key Growth Drivers
Rising Cancer Incidence and Demand for Early Detection
The global increase in cancer incidence is a foundational growth driver for the oncology molecular diagnostics market. According to industry data, the number of new cancer cases is projected to grow significantly in coming years, thereby boosting demand for diagnostic tests that enable early detection and intervention. Molecular diagnostics solutions including gene panels, mutation assays and advanced sequencing are sought after because they permit identification of oncogenic changes before clinical symptoms emerge or at earlier stages of disease. The urgency for diagnostics is further heightened by public health initiatives and healthcare providers seeking to improve outcomes, reduce treatment costs and mitigate the burden of advanced‑stage cancer care.
- For instance, in 2022 there were an estimated 20 million new cancer cases worldwide and 9.7 million cancer‑related deaths.
Adoption of Precision Medicine and Biomarker‑Driven Therapies
The shift toward precision oncology tailoring treatments based on individual tumour genetic and molecular profiles is substantially driving the molecular diagnostics market. Diagnostics that identify actionable biomarkers (mutations, fusions, copy number changes, microsatellite instability) enable clinicians to select targeted therapies and monitor response. As companion diagnostics and multi‑gene panels become integral to therapeutic decision‑making, demand for advanced molecular tests escalates. Furthermore, regulatory approvals and clinical guidelines increasingly recognise the value of stratified diagnostics, which enhances the uptake of such tests across oncology care pathways.
- For instance, Caris Life Sciences has conducted more than 6.5 million tumour and blood‑based molecular profiling tests across approximately 849,000 unique cancer cases.
Technological Advancements in Molecular Platforms
Rapid developments in molecular testing technologies form a third major driver. The emergence and maturation of next‑generation sequencing (NGS), liquid biopsies (circulating tumour DNA), high‑throughput PCR/multiplex platforms, and bioinformatics tools enable more comprehensive, rapid and cost‑efficient diagnostics. Lowering cost per test, improved sensitivity/specificity and streamlined workflows further enhance appeal. In addition, expanded R&D investment and infrastructure improvement support broader adoption of these advanced diagnostics.
Key Trends & Opportunities
Non‑invasive Testing and Liquid Biopsy
A prominent trend offering opportunity in the oncology molecular diagnostics market is the shift toward non‑invasive sampling modalities, especially liquid biopsies. These tests analyse circulating tumour DNA (ctDNA) or tumour‑derived exosomes in blood or other bodily fluids, enabling tumour profiling, treatment monitoring and minimal residual disease evaluation without invasive tissue biopsy. This trend is significant because it enhances patient compliance, allows more frequent testing, and opens diagnostics to settings where tissue access is limited. For companies and labs, this presents opportunities to develop novel assays, integrate monitoring workflows and capture revenue from longitudinal testing.
- For instance, Guardant Health’s liquid biopsy offering its “Guardant360” test was used by over 100,000 patients by 2019, covering more than 50 different cancer types in its blood‑based panel.
Integration of Artificial Intelligence and Data Analytics
Another key trend is the incorporation of artificial intelligence (AI), machine learning (ML) and advanced bioinformatics into oncology molecular diagnostics. Given the large volumes of genomic and molecular data generated, AI‑driven analytics offer opportunities to enhance variant interpretation, predictive modelling for treatment response, and tumour origin classification. The synergy of AI with molecular platforms presents a growth prospect: diagnostics providers can differentiate through decision‑support tools, labs can improve throughput and accuracy, and payers and providers may adopt data‑driven workflows more confidently.
- For instance, in advanced non-squamous non-small cell lung cancer (NSCLC), approximately 30% to 50% of patients in general populations have an oncogenic driver alteration, with around 30-40% having a driver mutation or rearrangement (e.g., EGFR, ALK, ROS1, BRAF, MET, RET, HER2, KRAS G12C) that is targetable by an FDA-approved agent, illustrating the prevalence of biomarker-matched therapies.
Expansion into Emerging Markets and Decentralised Testing
Emerging economies particularly in Asia‑Pacific, Latin America and parts of the Middle East/Africa represent a substantial growth opportunity for the oncology molecular diagnostics market. Improving healthcare infrastructure, rising cancer burden, increasing awareness of personalised medicine and greater investment in diagnostic laboratories drive this expansion. Additionally, decentralised testing models, point‑of‑care molecular diagnostics and partnerships with regional labs create new entry pathways. For companies, tailoring cost‑effective solutions and regional partnerships provides a strategic opportunity to capture underserved markets.
Key Challenges
High Cost and Reimbursement Barriers
A significant challenge for the oncology molecular diagnostics market lies in the high cost of advanced tests equipment, reagents, data analysis infrastructure and skilled personnel all contribute to elevated costs. Moreover, inconsistent reimbursement policies and variable payer coverage across regions further limit uptake, especially in low‑ and middle‑income countries where cost sensitivity is acute. These economic constraints hinder widespread adoption of molecular diagnostics, restricting the market potential in less developed settings and placing pressure on pricing strategies and cost‑structure optimisation.
Regulatory, Data and Workforce‑Related Hurdles
Another major challenge is the complex and variable regulatory environment, alongside data‑interpretation and workforce limitations. Diagnostic product approvals (e.g., through the FDA, CE‑marking or other regional authorities) require rigorous validation, clinical evidence and time‑consuming processes which can delay time‑to‑market. In parallel, the volume and complexity of genomic data demand trained bioinformaticians and molecular pathologists-who are in short supply while data privacy, cybersecurity and interoperability issues remain real constraints. These hurdles complicate implementation of molecular diagnostics in routine clinical practice and reduce scalability in resource‑limited settings.
Regional Analysis
North America
North America leads the Oncology Molecular Diagnostics Market with a 41% share due to strong adoption of precision oncology and widespread use of companion diagnostics. Hospitals and cancer centers use advanced PCR, NGS, and liquid biopsy platforms to support targeted therapy planning. High spending on cancer research and broad reimbursement coverage boosts testing volumes. The U.S. drives most demand because of large clinical genomics programs and rapid integration of biomarker-guided treatment pathways. Canada follows with growing investments in early detection programs. Strong pharmaceutical collaboration further reinforces North America’s leadership in molecular cancer testing.
Europe
Europe holds a 30% share of the Oncology Molecular Diagnostics Market, supported by structured cancer screening programs and strong regulatory backing for biomarker-based testing. Many countries adopt molecular assays for colorectal, breast, and lung cancer screening, driving routine clinical use. Germany, the U.K., and France lead adoption with advanced laboratory networks and high patient awareness. The region benefits from strong collaborations between research institutes and diagnostic manufacturers. Growing interest in liquid biopsy for early detection also expands market activity. Continued investment in centralized testing infrastructures helps maintain Europe’s strong regional position.
Asia Pacific
Asia Pacific accounts for a 22% share and represents the fastest-growing region in oncology molecular diagnostics. Rising cancer incidence and expanding healthcare infrastructure fuel strong demand. China, Japan, and India invest heavily in sequencing platforms and biomarker-driven therapy selection. Adoption of liquid biopsy and high-throughput testing accelerates as hospitals modernize diagnostic workflows. Government-led cancer control programs expand screening volumes across major cancers. Regional manufacturers increase availability of cost-effective kits, improving access. Growing clinical trial activity and precision oncology initiatives continue to push rapid market growth across Asia Pacific.
Latin America
Latin America captures a 5% share of the Oncology Molecular Diagnostics Market, driven by gradual adoption of genomic testing across urban hospitals. Brazil and Mexico lead regional demand due to expanding cancer centers and improved laboratory capacity. Awareness of biomarker-guided treatment rises, especially in major cities. Limited reimbursement and uneven access restrict widespread adoption, but private hospitals increasingly invest in PCR and sequencing platforms. International partnerships help strengthen laboratory standards. As cancer incidence grows and diagnostic modernization accelerates, the region shows steady potential for molecular testing expansion.
Middle East & Africa
The Middle East & Africa region holds a 2% share, supported by growing adoption in high-income Gulf countries. The UAE and Saudi Arabia expand oncology centers equipped with PCR and sequencing technologies to improve early diagnosis. Rising investment in cancer care infrastructure boosts testing use in major hospitals. In Africa, adoption progresses slowly due to limited laboratory capacity and cost barriers. International health programs help strengthen diagnostic capability in select nations. Increased government spending on oncology services and rising awareness of biomarker-based treatment are expected to support long-term market growth.
Market Segmentations:
By Type
- Breast Cancer
- Prostate Cancer
- Colorectal Cancer
- Cervical Cancer
- Liver Cancer
- Lung Cancer
- Blood Cancer
- Kidney Cancer
- Others
By Product
- Instruments
- Reagents
- Others
By Technology
- PCR
- In situ hybridization
- INAAT
- Chips and microarrays
- Mass spectrometry
- Sequencing
- TMA
- Others
By Geography
- North America
- U.S.
- Canada
- Mexico
- Europe
- Germany
- France
- U.K.
- Italy
- Spain
- Rest of Europe
- Asia Pacific
- China
- Japan
- India
- South Korea
- South-east Asia
- Rest of Asia Pacific
- Latin America
- Brazil
- Argentina
- Rest of Latin America
- Middle East & Africa
- GCC Countries
- South Africa
- Rest of the Middle East and Africa
Competitive Landscape
The competitive landscape of the Oncology Molecular Diagnostics Market features strong participation from global diagnostic leaders that expand their oncology portfolios through advanced platforms, high-sensitivity assays, and integrated workflow solutions. Companies focus on PCR, sequencing, liquid biopsy, and companion diagnostics to support personalized cancer care. Vendors invest in automated instruments and digital reporting tools to help laboratories manage rising test volumes with greater accuracy. Strategic collaborations with oncology centers and pharmaceutical firms strengthen development of biomarker-based tests used in treatment selection and disease monitoring. Many players also enhance their reagent lines to improve mutation detection and streamline workflows. Expansion into emerging markets and regulatory approvals for new cancer panels further intensify competition, while continuous innovation in high-throughput analysis and early detection solutions shapes long-term leadership across the industry.
Key Player Analysis
- Danaher
- Agilent Technologies, Inc.
- Hoffmann-La Roche Ltd.
- Qiagen
- BD
- Hologic, Inc.
- Cepheid
- Abbott
- Bayer AG
- Siemens
Recent Developments
- In November 2025, QIAGEN Unveiled the QIAsymphony Connect platform at AMP 2025 for high-sensitivity oncology workflows. The system is optimized for liquid biopsy and MRD monitoring and boosts sample throughput. QIAGEN also highlighted precision oncology partnerships, including an HRD assay for cancer profiling with Myriad Genetics.
- In October 2025, Hologic, Inc.: Agreed to be taken private by Blackstone and TPG in a large medtech deal. The buyers plan to accelerate R&D and product development in Hologic’s women’s health diagnostics, including breast and cervical cancer testing. This structure is expected to support longer-term investment in oncology molecular diagnostics without quarterly earnings pressure.
Report Coverage
The research report offers an in-depth analysis based on Type, Product, Technology and Geography. It details leading market players, providing an overview of their business, product offerings, investments, revenue streams, and key applications. Additionally, the report includes insights into the competitive environment, SWOT analysis, current market trends, as well as the primary drivers and constraints. Furthermore, it discusses various factors that have driven market expansion in recent years. The report also explores market dynamics, regulatory scenarios, and technological advancements that are shaping the industry. It assesses the impact of external factors and global economic changes on market growth. Lastly, it provides strategic recommendations for new entrants and established companies to navigate the complexities of the market.
Future Outlook
- The market will expand as precision oncology becomes part of routine cancer care.
- Adoption of liquid biopsy will rise due to its non-invasive sampling benefits.
- Multi-cancer early detection tests will gain strong clinical and commercial traction.
- AI-driven analytics will improve test accuracy and speed across major workflows.
- High-throughput sequencing platforms will see wider use in large cancer centers.
- Companion diagnostics will grow as more targeted therapies receive approvals.
- Automation in laboratories will cut turnaround time and support higher test volumes.
- Emerging markets will adopt molecular assays faster as cancer programs expand.
- Regulatory support for biomarker-guided treatment will strengthen market growth.
- Integration of digital pathology with molecular data will improve therapy decisions.
Request a Free Sample
Fill in your details and we'll send you a free sample report.
- Sample data tables & charts
- Research methodology
Need a Custom Version of This Report?
Tailor the scope, geography, or segments to your exact requirements.
- Custom geography or segment scope
- Direct access to our analyst team
Frequently Asked Questions
What is the current market size for Oncology Molecular Diagnostics Market, and what is its projected size in 2032?
At what Compound Annual Growth Rate is the Oncology Molecular Diagnostics Market projected to grow between 2025 and 2032?
Which test location segment governs the demand for oncology molecular diagnostics worldwide?
Who are the major players in the global oncology molecular diagnostics market?
What are the major market drivers of the oncology molecular diagnostics industry?
What are the major market restraints of the oncology molecular diagnostics industry?
What are the major market opportunities of the oncology molecular diagnostics industry?
Who are the leading companies in the Oncology Molecular Diagnostics Market?
Table of Content
Chapter 1. Report Introduction
- 1.1 Report Description & Purpose
- 1.1.1 Report Title & Market Definition
- 1.1.2 Unique Selling Propositions (USP) & Key Differentiators
- 1.1.3 Value Proposition for Stakeholders
- 1.2 Research Objectives
- 1.2.1 Market Sizing Objectives (Volume & Revenue) (Volume Where Applicable)
- 1.2.2 Segmentation Objectives
- 1.2.3 Competitive Intelligence Objectives
- 1.2.4 Forecast & Scenario Objectives
- 1.3 Report Scope
- 1.3.1 Oncology Molecular Diagnostics Scope – Segments & Subsegments Covered
- 1.3.2 Geographic Scope – Regions & Countries Covered
- 1.3.3 Historical Period, Base Year & Forecast Period (2024; forecast to 2032)
- 1.3.4 Inclusions & Exclusions
- 1.4 Industry Classification & Applicable Codes
- 1.5 Currency, Measurement Units & Valuation Basis
- 1.6 Target Stakeholders
- 1.7 Limitations & Assumptions
Chapter 2. Executive Summary
- 2.1 Global Oncology Molecular Diagnostics Market Snapshot
- 2.1.1 Market Size – Historical (2024) & Forecast (2024-2032) (2024: USD 3 billion → 2032: USD 5.54 billion)
- 2.1.2 Volume & Revenue – Global Totals (Volume Where Applicable)
- 2.1.3 Key Market Highlights – Top Five Facts
- 2.2 Oncology Molecular Diagnostics Market Segmentation Snapshot
- 2.2.1 Market Split by Region – 2024 vs. 2032
- 2.3 Competitive Snapshot
- 2.3.1 Top 10 Players by Revenue Share – 2024
- 2.3.2 Top 10 Players by Volume Share – 2024 (Volume Where Applicable)
- 2.3.3 Recent Strategic Developments (18-Month Summary)
- 2.4 Key Investment Highlights & Strategic Conclusions
Chapter 3. Oncology Molecular Diagnostics Market Dynamics & Industry Analysis
- 3.1 Market Overview & Context
- 3.1.1 Oncology Molecular Diagnostics Market Position in the Broader Industry Value Chain
- 3.1.2 Demand Structure & Purchasing Dynamics
- 3.1.3 Market Maturity & Development Stage by Region
- 3.2 Oncology Molecular Diagnostics Market Drivers
- 3.3 Oncology Molecular Diagnostics Market Restraints & Challenges
- 3.4 Oncology Molecular Diagnostics Market Opportunities
- 3.5 Porter's Five Forces Analysis
- 3.5.1 Threat of New Entrants
- 3.5.2 Bargaining Power of Suppliers
- 3.5.3 Bargaining Power of Buyers
- 3.5.4 Threat of Substitutes
- 3.5.5 Competitive Rivalry – Intensity Assessment
- 3.6 Oncology Molecular Diagnostics Value Chain Analysis
- 3.6.1 Upstream – Key Inputs, Resources & Suppliers
- 3.6.1.1 Key Input/Resource 1
- 3.6.1.2 Key Input/Resource 2
- 3.6.1.3 Key Input/Resource 3
- 3.6.2 Midstream – Core Operations & Value Creation
- 3.6.2.1 Operating Model & Process Overview
- 3.6.2.2 Key Operating Locations & Capabilities by Company
- 3.6.3 Downstream – Market Channels & End Users
- 3.6.3.1 Direct Sales & Customer Engagement Channels
- 3.6.3.2 Indirect Sales, Intermediaries & Partner Channels
- 3.6.4 Value Chain Profitability Analysis
- 3.6.1 Upstream – Key Inputs, Resources & Suppliers
- 3.7 PESTEL Analysis
- 3.7.1 Political Factors
- 3.7.2 Economic Factors
- 3.7.3 Social Factors
- 3.7.4 Technological Factors
- 3.7.5 Environmental Factors
- 3.7.6 Legal Factors
- 3.8 Oncology Molecular Diagnostics Supply Chain Analysis
- 3.8.1 Critical Input & Resource Availability Risk Assessment
- 3.8.2 Supplier & Operational Concentration Risk (Geographic Exposure)
- 3.8.3 Supply & Service Disruption Impact Analysis
- 3.9 Regulatory & Policy Landscape
Note: The regulatory and policy landscape section covers regulations based on their applicability to the market, Oncology Molecular Diagnostics category, geography, and scope of the study. Only regulatory frameworks with a material impact on operations, compliance, trade, sustainability, or market access are analyzed in detail.
Chapter 4. Key Investment Pockets & Opportunity Analysis
- 4.1 Oncology Molecular Diagnostics Market Attractiveness Analysis
- 4.1.1 By Region – Investment Attractiveness Matrix (Market Size × CAGR)
- 4.2 Absolute Revenue Growth Opportunity
- 4.2.1 By Region – Absolute Revenue Growth Through 2032
- 4.3 Incremental Demand Opportunity
- 4.3.1 By Region – Incremental Demand Through 2032
- 4.3.2 Segment – Incremental Demand
- 4.4 Emerging Submarket Opportunity Deep Dive (Subject to Applicability)
- 4.5 Priority Market Opportunity Scorecards
- 4.5.1 United States
- 4.5.2 Europe
- 4.5.3 Asia
- 4.5.4 Middle East & Africa
Note: Priority market opportunity scorecards reflect the geographic scope and strategic relevance of the study. Listed markets are indicative and may be adapted to the industry.
Chapter 5. Oncology Molecular Diagnostics Cross-Border Trade & Market Access Analysis
- 5.1 International Trade & Cross-Border Activity Overview
- 5.1.1 Global Export Value by Country (2024)
- 5.1.2 Global Export Volume by Country (2024) (Volume Where Applicable)
- 5.1.3 Global Import Value by Country (2024)
- 5.1.4 Global Import Volume by Country (2024) (Volume Where Applicable)
- 5.1.5 Net Trade Balance by Country (2024)
- 5.2 Export Analysis – Segment
- 5.2.1 Category 1 (Applicable Classification Code)
- 5.2.2 Category 2 (Applicable Classification Code)
- 5.2.3 Category 3 (Applicable Classification Code)
- 5.2.4 Category 4 (Applicable Classification Code)
- 5.2.5 Category 5 (Applicable Classification Code)
- 5.3 Import Analysis – Segment
- 5.3.1 Category 1 (Applicable Classification Code)
- 5.3.2 Category 2 (Applicable Classification Code)
- 5.3.3 Category 3 (Applicable Classification Code)
- 5.3.4 Category 4 (Applicable Classification Code)
- 5.3.5 Category 5 (Applicable Classification Code)
- 5.4 Cross-Border Pricing & Transaction Benchmarks
- 5.4.1 Export Pricing – Segment & Country
- 5.4.2 Import Pricing – Segment & Source Country
- 5.4.3 Price Trends (2024)
- 5.5 Key Cross-Border Trade & Delivery Routes
- 5.5.1 Cross-Border Trade/Delivery Route 1
- 5.5.2 Cross-Border Trade/Delivery Route 2
- 5.5.3 Cross-Border Trade/Delivery Route 3
- 5.5.4 Cross-Border Trade/Delivery Route 4
- 5.5.5 Cross-Border Trade/Delivery Route 5
- 5.6 Trade Policy & Market Access Impact Assessment
- 5.6.1 Tariff & Non-Tariff Barriers
- 5.6.2 Regional Trade & Economic Integration Frameworks
- 5.6.3 Bilateral & Multilateral Trade Agreements
- 5.6.4 Cross-Border Operating, Licensing & Localization Requirements
Note: This chapter applies where cross-border trade or delivery is relevant to Oncology Molecular Diagnostics. Goods, services, and digital offerings are assessed using applicable classifications and transaction measures. Import-export volumes, trade balances, and route analyses are included only where meaningful to the market.
Chapter 6. Competitive Landscape & Company Benchmarking
- 6.1 Oncology Molecular Diagnostics Market Concentration & Structure
- 6.1.1 Herfindahl-Hirschman Index (HHI) – vs. 2024
- 6.1.2 Leading, Mid-Sized & Emerging Player Structure
- 6.1.3 Global, Regional & Local Player Dynamics
- 6.2 Oncology Molecular Diagnostics Market Share Analysis – 2024
- 6.2.1 Global Revenue Share by Company
- 6.2.2 Global Volume Share by Company (Volume Where Applicable)
- 6.2.3 Regional Revenue Share
- 6.2.4 Market Share Evolution ( vs. 2024)
- 6.2.5 Company Market Share by Key Segment
- 6.2.6 Company Market Share by Customer Group
- 6.3 Operating Scale, Capacity & Infrastructure Analysis
- 6.3.1 Global Operating Scale & Supply Capacity
- 6.3.2 Resource Utilization & Operating Efficiency
- 6.3.3 Output, Service Delivery & Activity Metrics
- 6.3.4 Operating Footprint & Infrastructure Map
- 6.3.5 Planned Operational & Capacity Expansion
- 6.4 Oncology Molecular Diagnostics Competitive Benchmarking Matrix
- 6.4.1 Revenue, Growth, Profitability & Operating Metric Comparison
- 6.4.2 Channel Revenue Mix
- 6.4.3 Geographic Revenue Exposure
- 6.4.4 R&D Intensity
- 6.4.5 Sustainability Maturity
- 6.5 Strategic Developments in Oncology Molecular Diagnostics (Last 24 Months)
- 6.5.1 Mergers, Acquisitions & Divestments
- 6.5.2 New Products, Services & Solutions in Oncology Molecular Diagnostics
- 6.5.3 Operational & Infrastructure Expansions
- 6.5.4 Strategic Alliances, Joint Ventures & Partnerships
- 6.5.5 Distribution Expansion & Market Entry
- 6.5.6 Sustainability & ESG Initiatives
- 6.6 Competitive Strategy Mapping
- 6.6.1 Leader, Challenger, Follower & Niche Classification
- 6.6.2 Pricing Strategy Comparison
- 6.6.3 Channel Strategy Matrix
Note: Strategic developments are included based on their materiality and the availability of reliable information.
Chapter 7. Global Oncology Molecular Diagnostics Market – By Sales & Delivery Channel
- 7.1 Segment Overview
- 7.1.1 Volume & Revenue Split by Channel (2024 & 2032) (Volume Where Applicable)
- 7.1.2 Channel Mix Evolution (2024-2032)
Chapter 8. Regional Market Analysis – Global Overview
- 8.1 Global Regional Overview
- 8.1.1 Regional Volume Share (Volume Where Applicable)
- 8.1.2 Regional Revenue Share
- 8.1.3 Regional Volume by Region (Volume Where Applicable)
- 8.1.4 Regional Revenue by Region
- 8.1.5 Regional Forecast Through 2032
- 8.2 Cross-Regional Segment Analysis
- 8.2.1 By Sales & Delivery Channel
- 8.2.2 By Competitive Positioning & Price Tier
Chapter 9. North America Oncology Molecular Diagnostics Market
- 9.1 United States
- 9.2 Canada
- 9.3 Mexico
Chapter 10. Europe Oncology Molecular Diagnostics Market
- 10.1 Germany
- 10.2 France
- 10.3 Italy
- 10.4 United Kingdom
- 10.5 Spain
- 10.6 Poland
- 10.7 Russia
- 10.8 Netherlands
- 10.9 Belgium
- 10.10 Sweden
- 10.11 Denmark
- 10.12 Norway
- 10.13 Rest of Europe
Chapter 11. Asia Pacific Oncology Molecular Diagnostics Market
- 11.1 China
- 11.2 India
- 11.3 Japan
- 11.4 South Korea
- 11.5 Thailand
- 11.6 Indonesia
- 11.7 Vietnam
- 11.8 Malaysia
- 11.9 Australia
- 11.10 Rest of Asia Pacific
Chapter 12. Latin America Oncology Molecular Diagnostics Market
- 12.1 Brazil
- 12.2 Argentina
- 12.3 Colombia
- 12.4 Chile
- 12.5 Rest of Latin America
Chapter 13. Middle East Oncology Molecular Diagnostics Market
- 13.1 Saudi Arabia
- 13.2 United Arab Emirates
- 13.3 Turkey
- 13.4 Israel
- 13.5 Iran
- 13.6 Rest of the Middle East
Chapter 14. Africa Oncology Molecular Diagnostics Market
- 14.1 South Africa
- 14.2 Egypt
- 14.3 Nigeria
- 14.4 Morocco
- 14.5 Rest of Africa
Chapter 15. Oncology Molecular Diagnostics Company Profiles
- 15.1 [Company 01]
- 15.1.1 Company Overview
- 15.1.2 Key Management Personnel
- 15.1.3 Products & Services Portfolio
- 15.1.4 Financial Performance
- 15.1.5 Key Market Focus & Geographic Presence
- 15.1.6 Recent Developments & Strategic Initiatives
Note: The company profile list is preliminary and may change based on research findings, market developments, data availability, and client requirements.
Chapter 16. Appendices
- Appendix A – List of Abbreviations & Acronyms
- Appendix B – Industry Classification Code Reference – Full Series
- Appendix C – Supply, Output & Operating Capacity Data Tables
- Appendix D – End-Use & Demand Base Tables
- Appendix E – Demand, Adoption & Usage Assumptions
- Appendix F – Pricing & Revenue Metric Reference Tables
- Appendix G – Company Operations & Infrastructure Database
- Appendix H – Cross-Border Trade & Activity Data Tables (Where Applicable)
- Appendix I – Regulatory Summary Tables
- Appendix J – Primary Research Participant List (Anonymized)
- Appendix K – Primary Research Questionnaire Framework
- Appendix L – Data Sources & Bibliography
- Appendix M – Market Size Divergence & Source Comparison
Chapter 17. Research Methodology
- 17.1 Research Framework & Philosophy
- 17.2 Secondary Research – Sources, Hierarchy & Data Extraction
- 17.3 Data Modeling – Bottom-Up & Top-Down Market Sizing
- 17.4 Primary Research – Stakeholder Framework, LOI & Sample Sizes
- 17.5 Forecast Methodology – Regression, Scenario & Sensitivity Analysis
- 17.6 Quality Control – Four-Layer Validation Framework
- 17.7 Limitations & Standard Assumptions
- 17.8 Disclaimer
