CHAPTER NO. 1: GENESIS OF THE MARKET
1.1 Market Prelude – Introduction & Scope
1.2 The Big Picture – Objectives & Vision
1.3 Strategic Edge – Unique Value Proposition
1.4 Stakeholder Compass – Key Beneficiaries
CHAPTER NO. 2: EXECUTIVE LENS
2.1 Pulse of the Industry – Market Snapshot
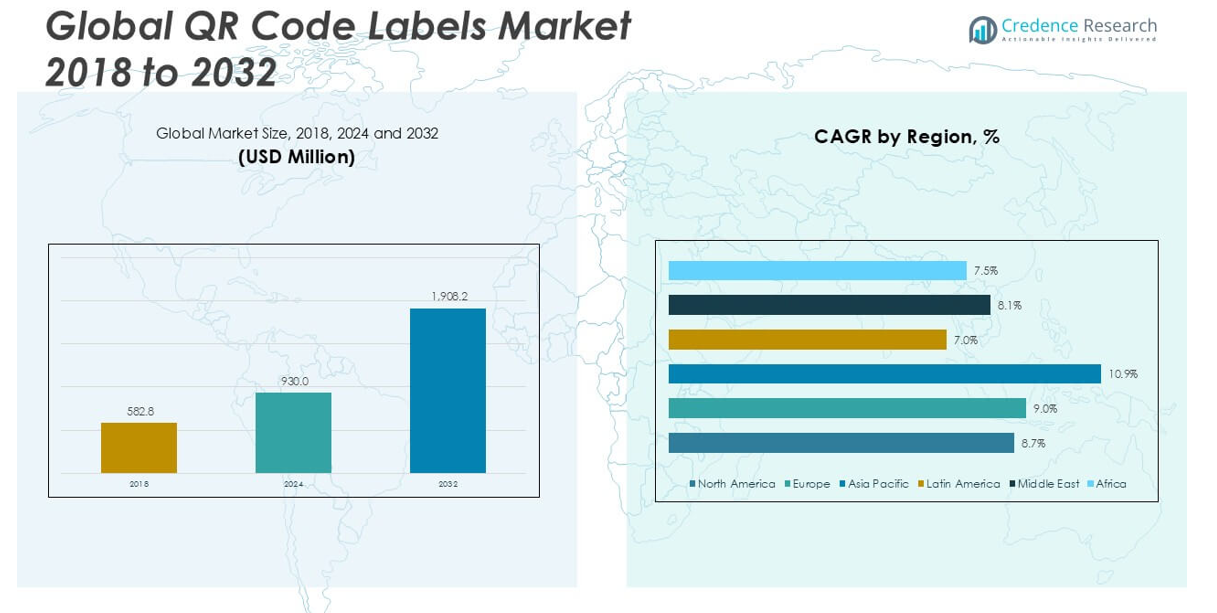
2.2 Growth Arc – Revenue Projections (USD Million)
2.3. Premium Insights – Based on Primary Interviews
CHAPTER NO. 3: QR CODE LABELS MARKET FORCES & INDUSTRY PULSE
3.1 Foundations of Change – Market Overview
3.2 Catalysts of Expansion – Key Market Drivers
3.2.1 Momentum Boosters – Growth Triggers
3.2.2 Innovation Fuel – Disruptive Technologies
3.3 Headwinds & Crosswinds – Market Restraints
3.3.1 Regulatory Tides – Compliance Challenges
3.3.2 Economic Frictions – Inflationary Pressures
3.4 Untapped Horizons – Growth Potential & Opportunities
3.5 Strategic Navigation – Industry Frameworks
3.5.1 Market Equilibrium – Porter’s Five Forces
3.5.2 Ecosystem Dynamics – Value Chain Analysis
3.5.3 Macro Forces – PESTEL Breakdown
3.6 Price Trend Analysis
3.6.1 Regional Price Trend
3.6.2 Price Trend by product
CHAPTER NO. 4: KEY INVESTMENT EPICENTER
4.1 Regional Goldmines – High-Growth Geographies
4.2 Product Frontiers – Lucrative Product Categories
4.3 Printing Technology Sweet Spots – Emerging Demand Segments
CHAPTER NO. 5: REVENUE TRAJECTORY & WEALTH MAPPING
5.1 Momentum Metrics – Forecast & Growth Curves
5.2 Regional Revenue Footprint – Market Share Insights
5.3 Segmental Wealth Flow – Type & Printing Technology Revenue
CHAPTER NO. 6: TRADE & COMMERCE ANALYSIS
6.1. Import Analysis by Region
6.1.1. Global QR Code Labels Market Import Revenue By Region
6.2. Export Analysis by Region
6.2.1. Global QR Code Labels Market Export Revenue By Region
CHAPTER NO. 7: COMPETITION ANALYSIS
7.1. Company Market Share Analysis
7.1.1. Global QR Code Labels Market: Company Market Share
7.2. Global QR Code Labels Market Company Revenue Market Share
7.3. Strategic Developments
7.3.1. Acquisitions & Mergers
7.3.2. New Product Launch
7.3.3. Regional Expansion
7.4. Competitive Dashboard
7.5. Company Assessment Metrics, 2024
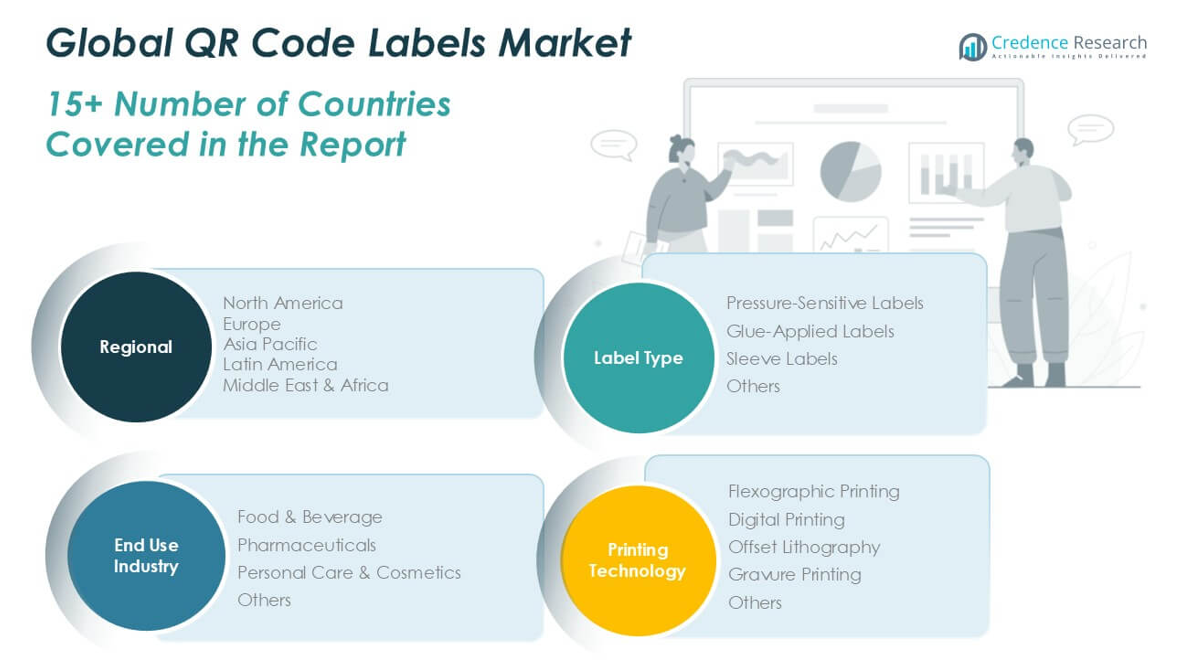
CHAPTER NO. 8: QR CODE LABELS MARKET – BY LABEL TYPE SEGMENT ANALYSIS
8.1. QR Code Labels Market Overview by Label Type Segment
8.1.1. QR Code Labels Market Revenue Share By Label Type
8.2. Pressure-Sensitive Labels
8.3. Glue-Applied Labels
8.4. Sleeve Labels
8.5. Others
CHAPTER NO. 9: QR CODE LABELS MARKET – BY PRINTING TECHNOLOGY SEGMENT ANALYSIS
9.1. QR Code Labels Market Overview by Printing Technology Segment
9.1.1. QR Code Labels Market Revenue Share By Printing Technology
9.2. Flexographic Printing
9.3. Digital Printing
9.4. Offset Lithography
9.5. Gravure Printing
9.6. Others
CHAPTER NO. 10: QR CODE LABELS MARKET – BY END USE INDUSTRY SEGMENT ANALYSIS
10.1. QR Code Labels Market Overview by End Use Industry Segment
10.1.1. QR Code Labels Market Revenue Share By End Use Industry
10.2. Food & Beverage
10.3. Pharmaceuticals
10.4. Personal Care & Cosmetics
10.5. Others
CHAPTER NO. 11: QR CODE LABELS MARKET – REGIONAL ANALYSIS
11.1. QR Code Labels Market Overview by Region Segment
11.1.1. Global QR Code Labels Market Revenue Share By Region
11.1.2. Regions
11.1.3. Global QR Code Labels Market Revenue By Region
11.1.4. Label Type
11.1.5. Global QR Code Labels Market Revenue By Label Type
11.1.6. Printing Technology
11.1.7. Global QR Code Labels Market Revenue By Printing Technology
11.1.8. End Use Industry
11.1.9. Global QR Code Labels Market Revenue By End Use Industry
CHAPTER NO. 12: NORTH AMERICA QR CODE LABELS MARKET – COUNTRY ANALYSIS
12.1. North America QR Code Labels Market Overview by Country Segment
12.1.1. North America QR Code Labels Market Revenue Share By Region
12.2. North America
12.2.1. North America QR Code Labels Market Revenue By Country
12.2.2. Label Type
12.2.3. North America QR Code Labels Market Revenue By Label Type
12.2.4. Printing Technology
12.2.5. North America QR Code Labels Market Revenue By Printing Technology
2.2.6. End Use Industry
12.2.7. North America QR Code Labels Market Revenue By End Use Industry
2.3. U.S.
12.4. Canada
12.5. Mexico
CHAPTER NO. 13: EUROPE QR CODE LABELS MARKET – COUNTRY ANALYSIS
13.1. Europe QR Code Labels Market Overview by Country Segment
13.1.1. Europe QR Code Labels Market Revenue Share By Region
13.2. Europe
13.2.1. Europe QR Code Labels Market Revenue By Country
13.2.2. Label Type
13.2.3. Europe QR Code Labels Market Revenue By Label Type
13.2.4. Printing Technology
13.2.5. Europe QR Code Labels Market Revenue By Printing Technology
13.2.6. End Use Industry
13.2.7. Europe QR Code Labels Market Revenue By End Use Industry
13.3. UK
13.4. France
13.5. Germany
13.6. Italy
13.7. Spain
13.8. Russia
13.9. Rest of Europe
CHAPTER NO. 14: ASIA PACIFIC QR CODE LABELS MARKET – COUNTRY ANALYSIS
14.1. Asia Pacific QR Code Labels Market Overview by Country Segment
14.1.1. Asia Pacific QR Code Labels Market Revenue Share By Region
14.2. Asia Pacific
14.2.1. Asia Pacific QR Code Labels Market Revenue By Country
14.2.2. Label Type
14.2.3. Asia Pacific QR Code Labels Market Revenue By Label Type
14.2.4. Printing Technology
14.2.5. Asia Pacific QR Code Labels Market Revenue By Printing Technology
14.2.5. End Use Industry
14.2.7. Asia Pacific QR Code Labels Market Revenue By End Use Industry
14.3. China
14.4. Japan
14.5. South Korea
14.6. India
14.7. Australia
14.8. Southeast Asia
14.9. Rest of Asia Pacific
CHAPTER NO. 15: LATIN AMERICA QR CODE LABELS MARKET – COUNTRY ANALYSIS
15.1. Latin America QR Code Labels Market Overview by Country Segment
15.1.1. Latin America QR Code Labels Market Revenue Share By Region
15.2. Latin America
15.2.1. Latin America QR Code Labels Market Revenue By Country
15.2.2. Label Type
15.2.3. Latin America QR Code Labels Market Revenue By Label Type
15.2.4. Printing Technology
15.2.5. Latin America QR Code Labels Market Revenue By Printing Technology
15.2.6. End Use Industry
15.2.7. Latin America QR Code Labels Market Revenue By End Use Industry
15.3. Brazil
15.4. Argentina
15.5. Rest of Latin America
CHAPTER NO. 16: MIDDLE EAST QR CODE LABELS MARKET – COUNTRY ANALYSIS
16.1. Middle East QR Code Labels Market Overview by Country Segment
16.1.1. Middle East QR Code Labels Market Revenue Share By Region
16.2. Middle East
16.2.1. Middle East QR Code Labels Market Revenue By Country
16.2.2. Label Type
16.2.3. Middle East QR Code Labels Market Revenue By Label Type
16.2.4. Printing Technology
16.2.5. Middle East QR Code Labels Market Revenue By Printing Technology
16.2.6. End Use Industry
16.2.7. Middle East QR Code Labels Market Revenue By End Use Industry
16.3. GCC Countries
16.4. Israel
16.5. Turkey
16.6. Rest of Middle East
CHAPTER NO. 17: AFRICA QR CODE LABELS MARKET – COUNTRY ANALYSIS
17.1. Africa QR Code Labels Market Overview by Country Segment
17.1.1. Africa QR Code Labels Market Revenue Share By Region
17.2. Africa
17.2.1. Africa QR Code Labels Market Revenue By Country
17.2.2. Label Type
17.2.3. Africa QR Code Labels Market Revenue By Label Type
17.2.4. Printing Technology
17.2.5. Africa QR Code Labels Market Revenue By Printing Technology
17.2.6. End Use Industry
17.2.7. Africa QR Code Labels Market Revenue By End Use Industry
17.3. South Africa
17.4. Egypt
17.5. Rest of Africa
CHAPTER NO. 18: COMPANY PROFILES
18.1. Avery Dennison Corporation
18.1.1. Company Overview
18.1.2. Product Portfolio
18.1.3. Financial Overview
18.1.4. Recent Developments
18.1.5. Growth Strategy
18.1.6. SWOT Analysis
18.2. CCL Industries Inc.
18.3. 3M Company
18.4. UPM Raflatac
18.5. Lintec Corporation
18.6. Huhtamaki Oyj
18.7. Constantia Flexibles
18.8. Brady Corporation
18.9. Zebra Technologies Corporation
18.10. Sato Holdings Corporation
18.11. Fuji Seal International, Inc.
18.12. Honeywell International Inc.
18.13. HERMA GmbH
18.14. Resource Label Group
18.15. Multi-Color Corporation (MCC)