Market Overview
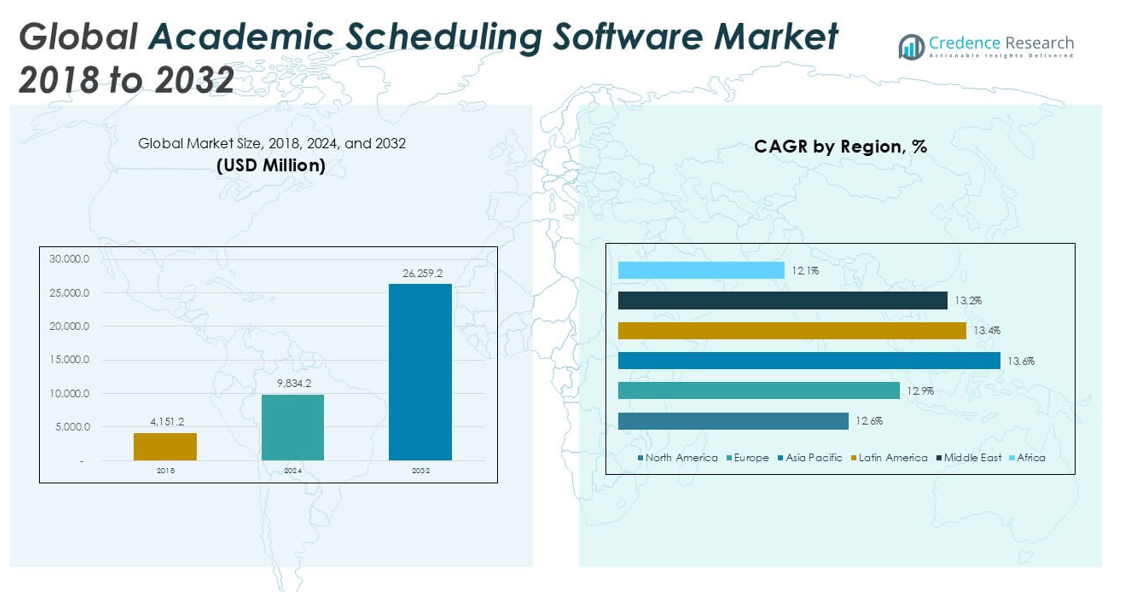
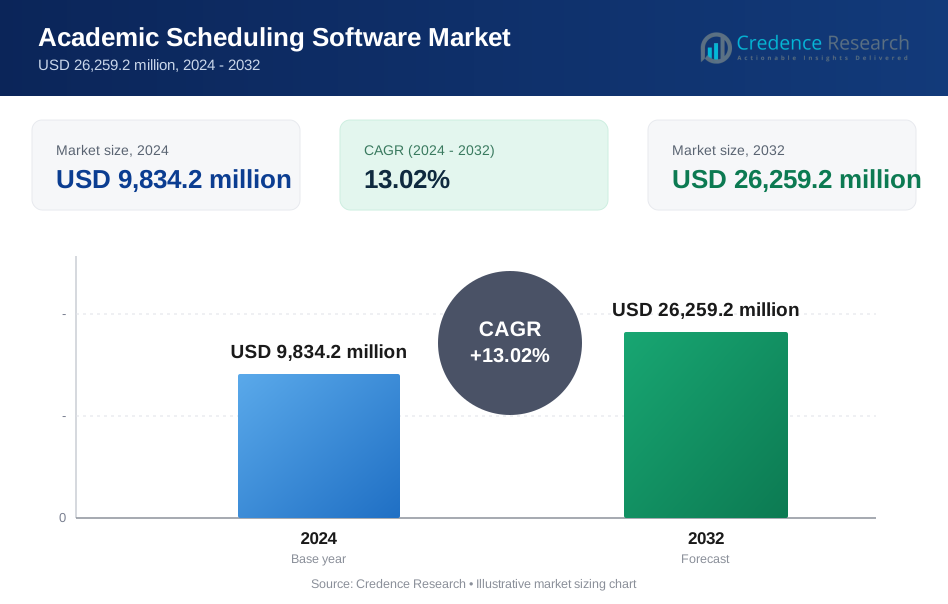
Global Academic Scheduling Software market size was valued at USD 4,151.2 million in 2018 to USD 9,834.2 million in 2024 and is anticipated to reach USD 26,259.2 million by 2032, at a CAGR of 13.02% during the forecast period.
| REPORT ATTRIBUTE | DETAILS |
|---|---|
| Historical Period | 2020-2023 |
| Base Year | 2024 |
| Forecast Period | 2025-2032 |
| Academic Scheduling Software Market Size 2024 | USD 9,834.2 million |
| Academic Scheduling Software Market, CAGR | 13.02% |
| Academic Scheduling Software Market Size 2032 | USD 26,259.2 million |
The global academic scheduling software market features strong competition among key players such as Ad Astra, Accruent, October Resolutions Ltd, Modern Campus USA Inc., Coursedog Inc., VirtoSoftware, Civitas Learning Inc., Arlo, and Creatrix Campus. These companies compete through cloud-native platforms, automation depth, and integration strength with institutional systems. North America leads the market with an exact share of 33.1%, driven by early digital adoption and complex higher education needs. Asia Pacific follows with a 26.9% share, supported by rapid enrollment growth and education digitization. Europe holds a 22.0% share, backed by public-sector digital initiatives and standardized academic planning across universities.
Market Insights
- The market grew from USD 4,151.2 million in 2018 to USD 9,834.2 million in 2024 and may reach USD 26,259.2 million by 2032, at a 13.02% CAGR.
- Growth is driven by education digitization, rising enrollment, and demand for automated scheduling across complex academic environments worldwide.
- Cloud-based deployment leads deployment segments due to scalability and lower costs, while course and class scheduling holds the largest functionality share.
- Competition remains moderate, with vendors focusing on cloud platforms, system integration, analytics, and long-term institutional contracts to gain share.
- North America leads with 33.1% share, followed by Asia Pacific at 26.9% and Europe at 22.0%, while budget limits restrain adoption in Africa and parts of Latin America.
Market Segmentation Analysis:
By Deployment
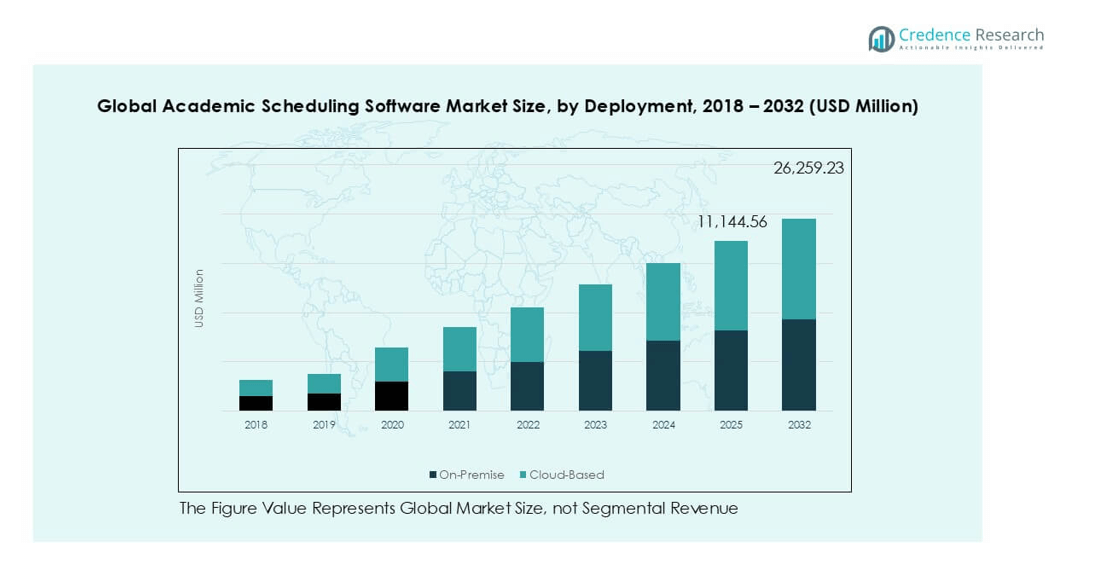
The deployment segment shows clear dominance of cloud-based academic scheduling software, accounting for the majority market share. Cloud-based solutions lead due to lower upfront costs, faster deployment, and easy scalability across campuses. Institutions favor cloud platforms for real-time updates, remote access, and seamless integration with learning management and student information systems. Automatic software updates and reduced IT maintenance further support adoption. On-premise solutions retain demand among institutions with strict data control needs, but limited flexibility and higher infrastructure costs constrain growth compared to cloud-based deployments.
- For instance, Ellucian’s SaaS-based scheduling and SIS platforms support more than 2,900 higher-education institutions worldwide and are designed to handle tens of thousands of concurrent student schedule transactions during peak registration periods.
By Functionality
Course and class scheduling represents the dominant functionality segment, holding the largest revenue share. This dominance stems from the critical need to manage complex timetables, student enrollments, and curriculum structures efficiently. Automated conflict detection, optimized timetable generation, and rule-based scheduling drive adoption. Exam and assessment scheduling follows, supported by growing digital examination workflows. Resource and room allocation gains traction as institutions aim to maximize space utilization. Faculty workload management adoption rises steadily, driven by compliance, transparency, and balanced workload planning requirements.
- For instance, Oracle’s PeopleSoft Campus Solutions scheduling engine can process thousands of course sections in a single scheduling run, applying hundreds of academic rules to prevent instructor, room, and student conflicts across large university systems.
By End User
Higher education institutions dominate the end-user segment, capturing the largest market share globally. Universities and colleges face complex scheduling needs involving large student populations, diverse programs, and shared resources. Advanced scheduling tools help improve operational efficiency and student experience. K–12 schools show steady growth, supported by increasing digital transformation initiatives and centralized district-level planning. Vocational and training centers adopt scheduling software to manage flexible course formats and short-term programs. Overall growth is driven by rising enrollment volumes and administrative automation priorities.
Key Growth Drivers
Rapid Digital Transformation in Education
Digital transformation across global education systems remains a primary growth driver. Institutions increasingly replace manual scheduling with automated platforms. Academic scheduling software improves accuracy, speed, and operational transparency. Administrators use these systems to manage growing student volumes efficiently. Digital tools reduce timetable conflicts and administrative errors. Governments support education digitization through funding and policy initiatives. Cloud adoption accelerates system accessibility across campuses. Integration with learning management and student information systems strengthens value. Institutions prioritize data-driven planning and centralized control. The shift toward hybrid and online learning further increases scheduling complexity. Software solutions address multi-format course delivery needs. Demand rises as institutions seek scalable digital infrastructure. This transformation sustains long-term market expansion globally.
- For instance, Ellucian’s Banner and Colleague platforms support over 18 million students globally and can process tens of thousands of schedule changes within peak registration windows without system downtime.
Increasing Enrollment and Program Complexity
Rising student enrollment drives demand for advanced scheduling solutions. Universities manage diverse programs, electives, and interdisciplinary courses. Manual systems struggle with such complexity. Scheduling software automates rule-based timetable generation. Institutions optimize class capacity and resource utilization. Growing international student intake adds scheduling challenges. Multi-campus operations require centralized planning tools. Academic software supports flexible semester structures and credit systems. Institutions improve student satisfaction through reduced scheduling conflicts. Faculty assignment accuracy also improves. These factors strengthen adoption across higher education markets. Complexity-driven demand remains a strong growth catalyst.
- For instance, Oracle PeopleSoft Campus Solutions supports universities with more than 100,000 active students and can apply several hundred scheduling constraints per timetable run to avoid class, room, and instructor conflicts.
Operational Efficiency and Cost Optimization
Institutions focus strongly on operational efficiency. Scheduling software reduces administrative workload significantly. Automation lowers dependency on manual staff hours. Institutions minimize scheduling errors and rework costs. Cloud-based platforms reduce IT infrastructure spending. Predictive scheduling improves space and faculty utilization. Management gains real-time visibility into operations. Data analytics support better planning decisions. Cost optimization remains critical amid budget constraints. Schools seek solutions with faster return on investment. These efficiency benefits directly drive procurement decisions. Cost-focused adoption supports steady market growth.
Key Trends & Opportunities
Expansion of Cloud-Based and SaaS Models
Cloud-based scheduling platforms dominate new deployments. SaaS models offer subscription-based affordability. Institutions avoid large upfront investments. Vendors provide frequent feature updates seamlessly. Remote access supports distributed academic environments. Scalability suits both small schools and large universities. Cloud platforms enable faster implementation timelines. Integration with third-party education systems improves functionality. Data security standards continue to strengthen. Emerging markets adopt cloud solutions rapidly. Vendors expand regional cloud infrastructure. This trend creates strong recurring revenue opportunities. Cloud adoption remains a major growth avenue.
- For instance, Ellucian’s SaaS platforms operate on cloud infrastructure that supports more than 2,900 institutions and manages millions of scheduling transactions during peak enrollment periods each academic term.
AI-Driven Scheduling and Predictive Analytics
Artificial intelligence enhances scheduling precision. AI algorithms optimize timetables dynamically. Systems learn from historical enrollment data. Predictive analytics forecast class demand patterns. Institutions proactively allocate faculty and resources. AI reduces bottlenecks during peak enrollment periods. Automation improves decision-making accuracy. Advanced analytics support scenario planning. Vendors differentiate through intelligent features. Demand rises for smart scheduling capabilities. AI-driven tools create premium product opportunities. This trend reshapes competitive positioning.
Key Challenges
Data Security and Privacy Concerns
Data security remains a critical challenge. Academic systems handle sensitive student information. Institutions face strict data protection regulations. Cloud deployments raise concerns over data sovereignty. Breaches can damage institutional reputation. Compliance requirements vary by region. Smaller institutions lack strong cybersecurity resources. Vendors must invest heavily in security frameworks. Encryption and access controls increase system costs. Resistance slows adoption in conservative markets. Trust-building becomes essential for vendors. Security challenges continue to limit full-scale deployment.
Integration and Change Management Issues
System integration presents ongoing challenges. Institutions use multiple legacy platforms. Scheduling software must integrate seamlessly. Poor integration causes workflow disruptions. Data migration risks affect implementation timelines. Staff resistance slows adoption rates. Training requirements increase transition costs. Change management remains resource intensive. Customization needs vary widely across institutions. Vendors face long deployment cycles. Smaller schools struggle with technical readiness. These challenges moderate short-term market growth.
Regional Analysis
North America
North America represents the largest regional market, holding about 33.1% share in 2024. The market was valued at USD 1,406.85 million in 2018 and reached USD 3,253.14 million in 2024. It is projected to expand to USD 8,402.95 million by 2032, growing at a CAGR of 12.6%. Strong digital maturity across U.S. and Canadian institutions drives adoption. Universities prioritize cloud scheduling to manage complex curricula. High IT budgets support advanced integrations. Regulatory compliance and data security capabilities further strengthen regional demand and long-term market leadership.
Europe
Europe accounts for around 22.0% of the global market share in 2024. The regional market stood at USD 917.84 million in 2018 and expanded to USD 2,160.42 million in 2024. It is expected to reach USD 5,719.26 million by 2032, registering a CAGR of 12.9%. Growth is supported by education digitization policies across Western Europe. Universities focus on standardized academic planning tools. Cross-border student mobility increases scheduling complexity. Public funding programs accelerate software deployment across higher education and secondary education systems.
Asia Pacific
Asia Pacific holds approximately 26.9% market share, making it the fastest-growing region. The market was valued at USD 1,083.89 million in 2018 and grew to USD 2,647.36 million in 2024. It is forecast to reach USD 7,352.58 million by 2032, at a CAGR of 13.6%. Rapid enrollment growth fuels strong demand. Governments invest heavily in digital education infrastructure. Cloud-based platforms gain preference due to scalability. Expanding private universities and training institutes further support sustained regional growth momentum.
Latin America
Latin America captured about 11.0% of the global market share in 2024. The regional market size increased from USD 447.50 million in 2018 to USD 1,079.09 million in 2024. It is projected to reach USD 2,948.91 million by 2032, growing at a CAGR of 13.4%. Adoption rises as institutions modernize administrative systems. Cloud deployment supports cost-sensitive institutions. Government-led digital education initiatives encourage adoption. Expanding higher education access continues to create steady scheduling software demand.
Middle East
The Middle East represents nearly 4.8% of global market share in 2024. The market was valued at USD 198.43 million in 2018 and reached USD 475.13 million in 2024. It is expected to grow to USD 1,286.70 million by 2032, at a CAGR of 13.2%. National education modernization programs drive growth. Universities adopt digital platforms to support smart campus initiatives. International branch campuses increase scheduling complexity. Investment in cloud infrastructure supports broader software deployment.
Africa
Africa holds a smaller share of about 2.2% of the global market in 2024. The market size stood at USD 96.72 million in 2018 and increased to USD 219.02 million in 2024. It is projected to reach USD 548.82 million by 2032, growing at a CAGR of 12.1%. Adoption remains gradual due to budget constraints. Cloud-based solutions improve accessibility. Expanding tertiary education enrollment supports demand. International development programs also contribute to gradual digital transformation across academic institutions.
Market Segmentations:
By Deployment
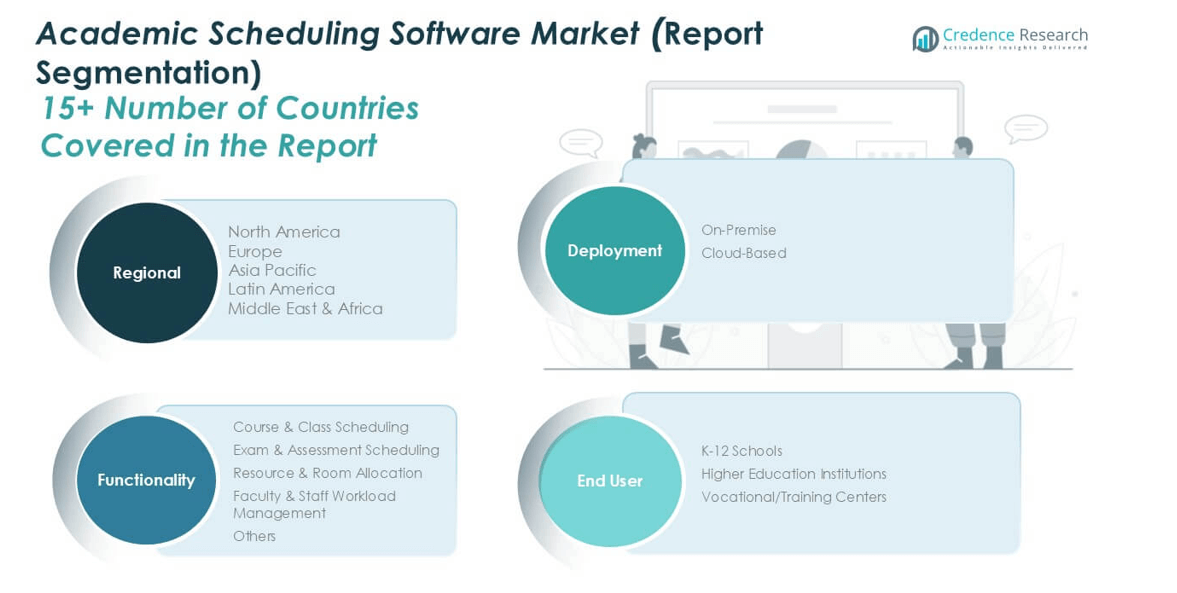
- On-Premise
- Cloud-Based
By Functionality
- Course & Class Scheduling
- Exam & Assessment Scheduling
- Resource & Room Allocation
- Faculty & Staff Workload Management
- Others
By End User
- K–12 Schools
- Higher Education Institutions
- Vocational/Training Centers
By Geography
- North America
- U.S.
- Canada
- Mexico
- Europe
- Germany
- France
- U.K.
- Italy
- Spain
- Rest of Europe
- Asia Pacific
- China
- Japan
- India
- South Korea
- South-east Asia
- Rest of Asia Pacific
- Latin America
- Brazil
- Argentina
- Rest of Latin America
- Middle East & Africa
- GCC Countries
- South Africa
- Rest of the Middle East and Africa
Competitive Landscape
The competitive landscape of the global academic scheduling software market remains moderately fragmented, with a mix of established vendors and emerging technology providers. Leading companies compete through cloud-first platforms, advanced automation, and strong integration capabilities with student information and learning management systems. Vendors focus on usability, scalability, and compliance to meet diverse institutional needs. Strategic partnerships with education technology providers strengthen market positioning. Product differentiation increasingly relies on AI-driven scheduling, analytics, and workflow automation. Vendors also emphasize customer support and implementation services to retain clients. Regional expansion and subscription-based pricing models support recurring revenue growth. Continuous feature enhancement and platform modernization remain key competitive priorities.
Key Player Analysis
- Ad Astra
- Accruent
- October Resolutions Ltd
- Modern Campus USA Inc.
- Coursedog Inc.
- VirtoSoftware, Inc.
- Civitas Learning Inc.
- Arlo
- Creatrix Campus
Recent Developments
- In Aug 2025, Accruent published a brochure for EMS + Ellucian SIS integration, focusing on unified campus scheduling and real-time updates.
- In Sep 2025, Accruent announced Accruent Insights 2025 event spotlighting future tech trends and connected solutions (not scheduling specific but relevant to product direction).
- In 2024, one of the key providers of web-based & on-demand solutions for higher education, CollegeNET, Inc., launched the 2024 Social Mobility Index (SMI). The SMI selects USA universities and colleges according to their ability to enroll students from low-income backgrounds and graduate them to secure good-paying jobs. The 2024 SMI includes 1,205 four-year institutions
Report Coverage
The research report offers an in-depth analysis based on Deployment, Functionality, End-User and Geography. It details leading market players, providing an overview of their business, product offerings, investments, revenue streams, and key applications. Additionally, the report includes insights into the competitive environment, SWOT analysis, current market trends, as well as the primary drivers and constraints. Furthermore, it discusses various factors that have driven market expansion in recent years. The report also explores market dynamics, regulatory scenarios, and technological advancements that are shaping the industry. It assesses the impact of external factors and global economic changes on market growth. Lastly, it provides strategic recommendations for new entrants and established companies to navigate the complexities of the market.
Future Outlook
- Cloud-based platforms will remain the preferred deployment model across institutions worldwide.
- Artificial intelligence will increasingly support automated and conflict-free timetable creation.
- Integration with learning management and student information systems will deepen.
- Demand from higher education institutions will continue to dominate overall adoption.
- K–12 schools will increase usage through district-level digital planning initiatives.
- Data analytics will guide enrollment forecasting and resource optimization decisions.
- Vendors will expand subscription and modular pricing models.
- Cybersecurity and compliance features will gain higher investment priority.
- Emerging markets will show faster adoption as digital education expands.
- Continuous software upgrades will focus on usability and workflow automation.
Request a Free Sample
Fill in your details and we'll send you a free sample report.
- Sample data tables & charts
- Research methodology
Market Dynamics
Rapid Digital Transformation in Education
Institutions are accelerating the shift from manual to automated scheduling platforms to improve accuracy, speed, and transparency. This digital transformation is supported by government funding and policy initiatives, driving widespread adoption of academic scheduling software.
Increasing Enrollment and Program Complexity
Rising student numbers and the proliferation of diverse academic programs create complex scheduling needs that manual systems cannot efficiently handle. Scheduling software automates timetable generation and resource allocation, supporting institutions in managing large, multi-campus operations.
Operational Efficiency and Cost Optimization
Academic scheduling software reduces administrative workload, minimizes errors, and optimizes resource utilization, leading to significant cost savings. Cloud-based solutions further lower IT infrastructure costs and provide faster returns on investment, making them attractive to budget-conscious institutions.
Expansion of Cloud-Based and SaaS Models
Cloud-based and SaaS deployment models offer scalability, lower upfront costs, and seamless integration with other educational systems. These benefits drive rapid adoption, especially in emerging markets and among institutions seeking flexible, subscription-based solutions.
AI-Driven Scheduling and Predictive Analytics
The integration of artificial intelligence and predictive analytics enables dynamic, conflict-free scheduling and data-driven decision-making. Institutions benefit from improved planning, scenario analysis, and proactive resource allocation, fueling demand for advanced scheduling solutions.
Need a Custom Version of This Report?
Tailor the scope, geography, or segments to your exact requirements.
- Custom geography or segment scope
- Direct access to our analyst team
Frequently Asked Questions
What is the projected growth of the academic scheduling software market?
At what Compound Annual Growth Rate is the Global Academic Scheduling Software market projected to grow between 2024 and 2032?
What factors are driving the demand for academic scheduling software?
Which region holds the largest share of the academic scheduling software market?
Which region is expected to experience the highest growth in the academic scheduling software market?
How will cloud-based solutions impact the academic scheduling software market?
Table of Content
Chapter 1 Market Segmentation
- 1.1 Segmentation Framework
- 1.1.1 Product and Service Classification
- 1.1.2 Application and End-Use Classification
- 1.1.3 Technology and Solution Classification
- 1.1.4 Customer and Distribution Channel Classification
- 1.1.5 Geographic Segmentation
- 1.1.6 Market Segment Definitions and Boundaries
- 1.2 By End User
- 1.2.1 K–12 Schools
- 1.2.2 Higher Education Institutions
- 1.2.3 Vocational/Training Centers
- 1.3 By Deployment
- 1.3.1 On-Premise
- 1.3.2 Cloud-Based
- 1.4 By Functionality
- 1.4.1 Course & Class Scheduling
- 1.4.2 Exam & Assessment Scheduling
- 1.4.3 Resource & Room Allocation
- 1.4.4 Faculty & Staff Workload Management
- 1.4.5 Others
Chapter 2 Introduction
- 2.1 Report Objectives and Scope
- 2.2 Product Definition and Industry Terminology
- 2.3 Market Inclusions and Exclusions
- 2.4 Research Process
- 2.4.1 Primary Research and Expert Interviews
- 2.4.2 Secondary Research and Source Review
- 2.4.3 Top-Down and Bottom-Up Estimation
- 2.4.4 Data Triangulation and Verification
- 2.5 Market Size Measurement Basis
- 2.5.1 2024: USD 9,834.2 million → 2032: USD 26,259.2 million
- 2.6 Historical and Forecast Reference Periods
- 2.6.1 Base Year: 2024
- 2.6.2 Forecast Period: 2024-2032
- 2.7 Research Assumptions and Limitations
Chapter 3 Executive Summary
- 3.1 Market Snapshot and Key Findings
- 3.2 Base-Year Market Size, 2024
- 3.3 Forecast Market Size, 2032
- 3.4 Revenue and Volume Growth Outlook
- 3.5 Key Demand and Supply Indicators
- 3.6 Leading Market Segments
- 3.7 Fastest-Growing Market Opportunities
- 3.8 Regional Performance Highlights
- 3.9 Technology and Industry Transformation
- 3.10 Competitive Landscape Summary
- 3.11 Analyst View and Strategic Implications
Chapter 4 Global Academic Scheduling Software Market Trends and Developments
- 4.1 Historical Industry Development
- 4.2 Recent Market Trends and Developments
- 4.3 Demand and Customer Behavior Trends
- 4.4 Technology and Product Innovation
- 4.5 Artificial Intelligence, Automation and Digitalization
- 4.6 Local Manufacturing and Supply Chain Realignment
- 4.7 Industry Partnerships, Mergers and Acquisitions
- 4.8 Sustainability and Circular Economy Developments
- 4.9 Government and Private Sector Investment Trends
- 4.10 Emerging Business Models and Commercialization
- 4.11 Industry Developments and Announcements
Chapter 5 Global Academic Scheduling Software Market Supply and Demand Analysis
- 5.1 Demand Trend and Consumption Analysis
- 5.2 Demand Forecast, 2024-2032
- 5.3 Supply Chain Structure and Procurement Trends
- 5.4 Supply-Demand Gap and Bottlenecks
- 5.5 Import Dependence and Sourcing Structure
- 5.6 Regional Supply and Demand Concentration
Chapter 6 Global Academic Scheduling Software Market Pricing Analysis
- 6.1 Pricing Structure and Measurement
- 6.2 Historical Pricing Trends
- 6.3 Pricing Outlook, 2024-2032
- 6.4 Pricing by Product and Market Segment
- 6.5 Geographic Pricing Differences
- 6.6 Key Input, Energy, Labor and Logistics Costs
- 6.7 Contract Pricing and Purchasing Models
- 6.8 Pricing Sensitivity and Competitive Positioning
- 6.9 Price, Margin and Profitability Implications
Chapter 7 Global Academic Scheduling Software Market Dynamics
- 7.1 Market Growth Drivers
- 7.1.1 Demand-Side Drivers
- 7.1.2 Technology and Innovation Drivers
- 7.1.3 Infrastructure and Investment Drivers
- 7.1.4 Regulatory and Policy Drivers
- 7.2 Market Restraints
- 7.2.1 Cost and Affordability Constraints
- 7.2.2 Technology and Adoption Barriers
- 7.2.3 Supply Chain and Operational Constraints
- 7.3 Market Challenges
- 7.3.1 Competitive Pressure and Margin Erosion
- 7.3.2 Skills, Infrastructure and Implementation Gaps
- 7.4 Emerging Market Opportunities
- 7.5 Market Dynamics Impact and Time-Horizon Assessment
Chapter 8 Global Academic Scheduling Software Value Chain Analysis
- 8.1 Industry Value Chain Overview
- 8.2 Upstream Suppliers and Critical Inputs
- 8.3 Technology and Component Providers
- 8.4 Manufacturing or Service Delivery
- 8.5 Distribution, Channel Partners and Integrators
- 8.6 Downstream Applications and End Users
- 8.7 Value Addition and Profit Pools
- 8.8 Vertical Integration and Outsourcing
- 8.9 Supplier Concentration and Risk
- 8.10 Supply Chain Localization and Resilience
Chapter 9 Global Academic Scheduling Software Market Regulations and Policies
- 9.1 Relevant Laws, Standards and Compliance Frameworks
- 9.2 Product, Service, Safety and Quality Requirements
- 9.3 Government Policies, Incentives and Subsidies
- 9.4 Imports, Exports and Trade Barriers
- 9.5 Public Procurement and Local Content Requirements
- 9.6 Data Protection, AI and Cybersecurity Compliance
- 9.7 Upcoming Policy Changes and Market Implications
Chapter 10 Global Academic Scheduling Software Market Hotspots and Opportunities
- 10.1 Market Opportunity Mapping and Growth Hotspots
- 10.2 High-Growth Applications and Customer Groups
- 10.3 Underserved Markets and White-Space Opportunities
- 10.4 Emerging Technology and Product Opportunities
- 10.5 New Capacity and Investment Hotspots
- 10.6 Market Entry and Expansion Opportunities
- 10.7 Distribution and Partnership Opportunities
- 10.8 Near-Term and Long-Term Commercial Potential
- 10.9 Opportunity Attractiveness and Execution Risks
Chapter 11 Global Academic Scheduling Software Market Outlook, 2024-2032
- 11.1 Market Size and Analysis
- 11.1.1 Revenue (Market Measurement: 2024: USD 9,834.2 million → 2032: USD 26,259.2 million)
- 11.1.2 Historical Market Size
- 11.1.3 Base-Year Market Size, 2024
- 11.2 Market Forecast, 2024-2032
- 11.2.1 Revenue Forecast to 2032
- 11.2.2 CAGR and Year-on-Year Growth
- 11.2.3 Incremental Revenue Opportunity
- 11.3 Forecast Assumptions and Scenario Analysis
- 11.3.1 Base-Case Forecast
- 11.3.2 Optimistic and Conservative Scenarios
- 11.3.3 Technology, Pricing and Policy Sensitivities
- 11.4 Market Attractiveness and Growth Outlook
Chapter 12 Global Academic Scheduling Software Market Segmentation and Outlook
- 12.1 Segmentation Summary and Market Shares, 2024
- 12.2 Largest and Fastest-Growing Segments
- 12.3 By End User - Market Size and Forecast, 2024-2032
- 12.3.1 Segment Definition and Scope
- 12.3.2 Historical Market Size
- 12.3.3 Revenue Forecast, 2024-2032
- 12.3.4 Base-Year Market Share, 2024
- 12.3.5 Segment CAGR and Growth Drivers
- 12.3.6 Subsegment Market Size and Forecast
- 12.3.6.1 K–12 Schools
- 12.3.6.2 Higher Education Institutions
- 12.3.6.3 Vocational/Training Centers
- 12.3.7 Subsegment Pricing and Adoption Trends
- 12.3.8 Leading Suppliers and Competition
- 12.3.9 Regional Demand and Opportunities
- 12.4 By Deployment - Market Size and Forecast, 2024-2032
- 12.4.1 Segment Definition and Scope
- 12.4.2 Historical Market Size
- 12.4.3 Revenue Forecast, 2024-2032
- 12.4.4 Base-Year Market Share, 2024
- 12.4.5 Segment CAGR and Growth Drivers
- 12.4.6 Subsegment Market Size and Forecast
- 12.4.6.1 On-Premise
- 12.4.6.2 Cloud-Based
- 12.4.7 Subsegment Pricing and Adoption Trends
- 12.4.8 Leading Suppliers and Competition
- 12.4.9 Regional Demand and Opportunities
- 12.5 By Functionality - Market Size and Forecast, 2024-2032
- 12.5.1 Segment Definition and Scope
- 12.5.2 Historical Market Size
- 12.5.3 Revenue Forecast, 2024-2032
- 12.5.4 Base-Year Market Share, 2024
- 12.5.5 Segment CAGR and Growth Drivers
- 12.5.6 Subsegment Market Size and Forecast
- 12.5.6.1 Course & Class Scheduling
- 12.5.6.2 Exam & Assessment Scheduling
- 12.5.6.3 Resource & Room Allocation
- 12.5.6.4 Faculty & Staff Workload Management
- 12.5.6.5 Others
- 12.5.7 Subsegment Pricing and Adoption Trends
- 12.5.8 Leading Suppliers and Competition
- 12.5.9 Regional Demand and Opportunities
- 12.6 Segment Growth Comparison
- 12.7 Segment Attractiveness and Priority Matrix
Chapter 13 Global Academic Scheduling Software End-Use and Application Market Outlook
- 13.1 End-Use Industry and Customer Demand Structure
- 13.2 Leading Applications and Customer Groups
- 13.3 End-Use Market Size, Share and Forecast
- 13.4 Major End-Use Industry Deep Dives
- 13.4.1 Customer Requirements and Use Cases
- 13.4.2 Demand and Replacement Cycles
- 13.4.3 Technical and Regulatory Considerations
- 13.4.4 Purchasing and Procurement Models
- 13.4.5 Leading Vendors and Distribution Channels
- 13.4.6 Forecast and Commercial Opportunities
- 13.5 Emerging Applications and Cross-Segment Demand
- 13.6 End-Use Industry Investment Priorities
Chapter 14 Global Academic Scheduling Software Geographic Market Outlook, 2024-2032
- 14.1 Regional Market Size and Share, 2024
- 14.2 Regional Market Forecast, 2024-2032
- 14.3 Regional Pricing, Production and Demand Differences
- 14.4 North America
- 14.4.1 United States
- 14.4.2 Canada
- 14.4.3 Mexico
- 14.5 Europe
- 14.5.1 Germany
- 14.5.2 France
- 14.5.3 Italy
- 14.5.4 United Kingdom
- 14.5.5 Spain
- 14.5.6 Poland
- 14.5.7 Russia
- 14.5.8 Netherlands
- 14.5.9 Belgium
- 14.5.10 Sweden
- 14.5.11 Denmark
- 14.5.12 Norway
- 14.5.13 Rest of Europe
- 14.6 Asia Pacific
- 14.6.1 China
- 14.6.2 India
- 14.6.3 Japan
- 14.6.4 South Korea
- 14.6.5 Thailand
- 14.6.6 Indonesia
- 14.6.7 Vietnam
- 14.6.8 Malaysia
- 14.6.9 Australia
- 14.6.10 Rest of Asia Pacific
- 14.7 Latin America
- 14.7.1 Brazil
- 14.7.2 Argentina
- 14.7.3 Colombia
- 14.7.4 Chile
- 14.7.5 Rest of Latin America
- 14.8 Middle East
- 14.8.1 Saudi Arabia
- 14.8.2 United Arab Emirates
- 14.8.3 Turkey
- 14.8.4 Israel
- 14.8.5 Iran
- 14.8.6 Rest of the Middle East
- 14.9 Africa
- 14.9.1 South Africa
- 14.9.2 Egypt
- 14.9.3 Nigeria
- 14.9.4 Morocco
- 14.9.5 Rest of Africa
- 14.10 Regional Investment, Policy and Supply Chain Differences
- 14.11 Regional Competitive Landscape
- 14.12 Geographic Growth Hotspots
Chapter 15 Global Academic Scheduling Software Technology, Innovation and Sustainability Outlook
- 15.1 Technology Landscape and Maturity
- 15.2 Product, Process and Service Innovation
- 15.3 AI, Automation and Digital Tools in the Industry
- 15.4 Technology Adoption and Performance Benchmarking
- 15.5 Innovation Pipeline and R&D Investment
- 15.6 Patent and Intellectual Property Trends
- 15.7 Energy Efficiency and Resource Management
- 15.8 Sustainability, Recycling and Circularity
- 15.9 Technology Roadmap, 2024-2032
- 15.10 Risks of Obsolescence and Technology Substitution
Chapter 16 Global Academic Scheduling Software Market Key Strategic Imperatives
- 16.1 Growth and Market Entry Priorities
- 16.2 High-Return Products and Segments
- 16.3 Pricing, Profitability and Cost Optimization
- 16.4 Technology Investment and Product Differentiation
- 16.5 Supply Chain Localization and Resilience
- 16.6 Distribution and Customer Acquisition
- 16.7 Partnership, Acquisition and Capacity Strategy
- 16.8 Regional Expansion Priorities
- 16.9 Short-, Medium- and Long-Term Actions
Chapter 17 Competition Outlook
- 17.1 Industry Competition Characteristics
- 17.2 Market Structure and Concentration
- 17.3 Market Share and Competitive Positioning, 2024
- 17.4 Company-Wise Revenue and Product Benchmarking
- 17.5 Production and Service Capacity Benchmarking
- 17.6 Technology, Pricing and Differentiation
- 17.7 Regional Footprint and Distribution Strength
- 17.8 Mergers, Acquisitions and Strategic Alliances
- 17.9 New Entrants and Competitive Threats
- 17.10 Porter's Five Forces and Industry Attractiveness
- 17.11 Competitive Outlook, 2024-2032
Chapter 18 Company Profiles
- 18.1 Company Coverage and Selection Criteria
- 18.2 Ad Astra
- 18.2.1 Business Description
- 18.2.2 Company Ownership and Geographic Presence
- 18.2.3 Product and Service Portfolio
- 18.2.4 Manufacturing and Operating Footprint
- 18.2.5 Financial Performance and Investment
- 18.2.6 Market Share and Competitive Position
- 18.2.7 Technology and Innovation Capabilities
- 18.2.8 Strategic Alliances or Partnerships
- 18.2.9 Recent Developments
- 18.2.10 Growth Strategy and Outlook
- 18.3 Accruent
- 18.4 October Resolutions Ltd
- 18.5 Modern Campus USA Inc.
- 18.6 Coursedog Inc.
- 18.7 VirtoSoftware, Inc.
- 18.8 Civitas Learning Inc.
- 18.9 Arlo
- 18.10 Creatrix Campus
- 18.11 CollegeNET, Inc.
- 18.12 Other Relevant Market Participants
Note: Every listed company is profiled on the structure shown under the first company. The company list is preliminary and may change based on research findings, market developments, data availability and client requirements.
Chapter 19 Disclaimer
- 19.1 Research and Forecast Disclaimer
- 19.2 Data Source and Estimation Limitations
Note: The depth of individual sections depends on data availability for this market. Volume, capacity, trade and other unit-based metrics are included where applicable.