
| REPORT ATTRIBUTE | DETAILS |
|---|---|
| Historical Period | 2019-2022 |
| Base Year | 2023 |
| Forecast Period | 2024-2032 |
| Reverse Vending Machine Market Size 2024 | USD 461.2 Million |
| Reverse Vending Machine Market, CAGR | 5.7 % |
| Reverse Vending Machine Market Size 2032 | USD 718.6 Million |
Market Overview:
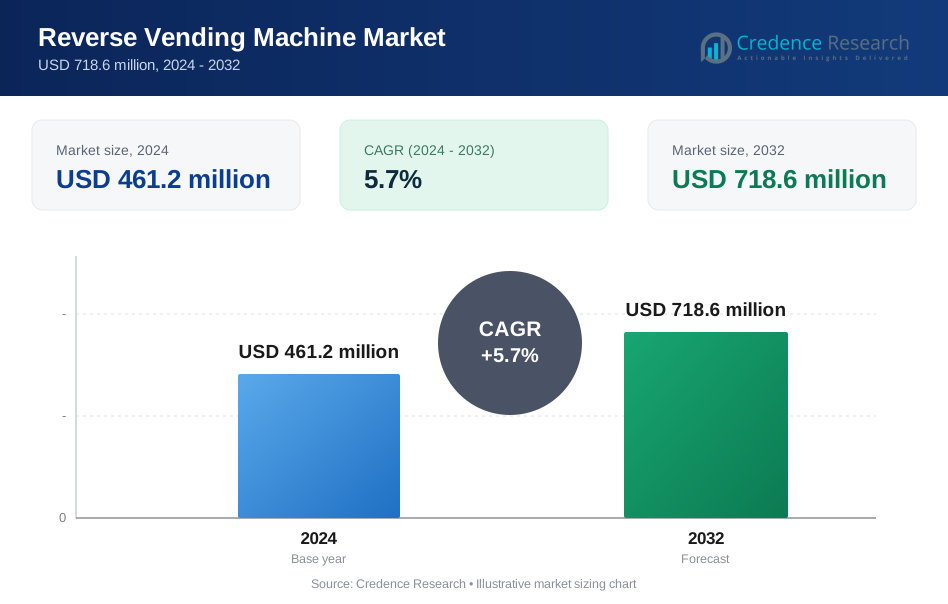
The Reverse Vending Machine Market is projected to grow from USD 461.2 million in 2024 to an estimated USD 718.6 million by 2032, with a compound annual growth rate (CAGR) of 5.7 % from 2024 to 2032.
Several key factors are fueling the market's expansion. The growing need for efficient recycling systems, particularly in urban areas, is a significant driver. Governments and organizations are increasingly investing in reverse vending machines to facilitate the collection of recyclable materials, reduce litter, and promote sustainable consumption. Additionally, advancements in technology are enhancing the functionality and user experience of these machines, making them more appealing to consumers.
Regionally, North America holds the largest share of the Reverse Vending Machine Market, primarily due to stringent recycling regulations and a high level of public awareness regarding environmental issues. Europe follows closely, with many countries leading the way in implementing innovative waste management solutions and promoting recycling initiatives. The Asia-Pacific region is anticipated to witness substantial growth during the forecast period, driven by rapid urbanization, increasing population density, and growing government initiatives aimed at improving recycling rates and waste management infrastructure. Emerging economies in this region are expected to present significant opportunities for market players as they adopt more sustainable practices in waste management.
Market Drivers:
Growing Environmental Awareness:
The increasing global concern over plastic waste and environmental sustainability is a significant driver for the reverse vending machine (RVM) market. As consumers become more environmentally conscious, they actively seek solutions that promote recycling and reduce waste. Government initiatives and international agreements aimed at minimizing plastic usage further bolster this trend. According to the United Nations Environment Programme (UNEP), global plastic production is projected to double by 2030, prompting a pressing need for efficient recycling systems. This heightened awareness is compelling businesses to invest in innovative recycling solutions, including reverse vending machines. For Instance, Tomra Systems, a leading provider of reverse vending machines, has installed over 80,000 machines globally, with a significant portion in Europe. In countries like Norway, Germany, and Sweden, reverse vending machines have become a common part of the recycling infrastructure. In Norway alone, 97% of all beverage containers are returned via reverse vending machines.
Government Policies and Regulations:
Government policies and regulations are critical drivers of the reverse vending machine market. Many countries are implementing stringent regulations on plastic waste management and recycling to combat environmental degradation. These regulations often include deposit return schemes (DRS), which incentivize consumers to return their bottles and cans for recycling. According to the European Commission, the adoption of DRS can lead to a recycling rate of up to 90% for beverage containers. The implementation of these policies is further supported by research from institutions like the World Bank, which advocates for effective waste management practices. Such regulatory frameworks create a favorable environment for the deployment of reverse vending machines, as municipalities and retailers seek to comply with recycling mandates. For Instance, California has deployed over 8,000 reverse vending machines throughout the state as part of its broader initiative to improve recycling rates. The state’s government allocated USD 16.6 million in 2021 to expand its reverse vending infrastructure in an effort to meet higher recycling goals and reduce litter.
Technological Advancements:
Technological innovation is reshaping the reverse vending machine market, enhancing efficiency and user experience. Advances in sensor technology, artificial intelligence, and data analytics are making RVMs more sophisticated and user-friendly. These machines can now accurately identify and sort various materials, making the recycling process more efficient. For example, Australia has significantly increased the number of reverse vending machines in recent years. As of 2023, the state of New South Wales alone had over 1,000 machines installed, contributing to an increase in beverage container recovery rates. The Return and Earn program in New South Wales have led to over 3 billion containers being returned since its launch.
Increasing Corporate Social Responsibility (CSR):
The rising emphasis on corporate social responsibility (CSR) among businesses is another key driver for the reverse vending machine market. Companies are increasingly recognizing the importance of sustainable practices, both for ethical reasons and to enhance their brand image. By investing in reverse vending machines, businesses can demonstrate their commitment to environmental stewardship and contribute to a circular economy. Research by the International Monetary Fund (IMF) indicates that companies that adopt sustainable practices often see a significant boost in consumer loyalty and brand reputation. As a result, many corporations are integrating RVMs into their sustainability initiatives, leading to increased demand for these machines. The focus on CSR is expected to grow, further propelling the reverse vending machine market forward. The reverse vending machine market is poised for substantial growth, driven by factors such as increasing environmental awareness, supportive government policies, technological advancements, and heightened corporate social responsibility. As stakeholders continue to prioritize sustainability and efficient waste management, the adoption of reverse vending machines is expected to accelerate. By embracing these trends, businesses and governments can work collaboratively towards a more sustainable future.
Market Trends:
Expansion of Smart Technology Integration:
The integration of smart technology in reverse vending machines is a prominent trend shaping the market. Innovations such as IoT connectivity, advanced analytics, and mobile app integration are transforming how these machines operate and interact with users. Smart RVMs can collect and analyze data on consumer behavior, recycling patterns, and machine performance, enabling operators to optimize their operations effectively. Research from the World Bank highlights that implementing smart technology in waste management can significantly enhance recycling rates and reduce operational costs. As businesses recognize the potential for improved efficiency and customer engagement, the adoption of smart RVMs is expected to grow. Companies are increasingly leveraging these technologies to offer seamless user experiences, such as instant rewards for recyclables through mobile apps, further encouraging consumer participation in recycling initiatives. For Instance, In China, there has been a significant push for smart recycling systems, including reverse vending machines, with the government introducing initiatives like the “Green Recycling Program.” As of 2023, 500 reverse vending machines were installed across major cities, contributing to a larger goal of deploying 10,000 machines in the next five years. The machines aim to address waste management in densely populated urban centers.
Rise of Consumer Engagement Strategies:
Another key trend in the reverse vending machine market is the emphasis on consumer engagement strategies. Companies are actively seeking innovative ways to encourage public participation in recycling efforts. Initiatives such as loyalty programs, educational campaigns, and community events are being implemented to increase awareness and usage of RVMs. Research conducted by the International Monetary Fund (IMF) shows that engaging consumers in recycling efforts can lead to significant increases in return rates. By making recycling more interactive and rewarding, companies can foster a culture of sustainability within communities. Retailers are partnering with local governments to create incentive programs that reward consumers for returning recyclables, thus promoting higher participation rates in deposit return schemes. For Instance, Revolution Recycling in North America has reported that its reverse vending machines collected over 200 million containers in 2022, contributing to a growing demand for advanced recycling technology. Their installations are primarily in urban areas with high foot traffic, such as shopping malls and transit stations.
Market Challenge Analysis:
Cost of Implementation and Maintenance:
One of the primary challenges facing the reverse vending machine market is the high cost of implementation and maintenance. While the initial investment in RVM technology can be substantial, ongoing operational expenses can also add significant financial pressure on businesses and municipalities. This includes costs related to machine installation, maintenance, software updates, and regular servicing to ensure machines remain functional and user-friendly. For many smaller retailers or local governments, these financial constraints can deter them from investing in reverse vending machines, limiting their participation in recycling initiatives. Furthermore, the cost challenge is exacerbated by the need for continuous technology upgrades to keep pace with advancements in smart technology and consumer expectations. As features like IoT connectivity and data analytics become standard, businesses may find themselves facing an additional burden of integrating these technologies into existing systems. According to research by the International Monetary Fund (IMF), addressing these financial barriers is crucial for enhancing the effectiveness of recycling programs and promoting wider adoption of RVMs across various sectors.
Consumer Participation and Behavior:
Another significant challenge for the reverse vending machine market is achieving consistent consumer participation and changing recycling behavior. Despite the growing awareness of environmental issues, many consumers still lack motivation or understanding of how to engage with recycling initiatives effectively. Factors such as convenience, accessibility, and perceived value play a critical role in whether individuals choose to use RVMs. If machines are not conveniently located or if the rewards for recycling are not compelling enough, participation rates may remain low, undermining the intended benefits of these systems. Moreover, behavioural factors such as habit and awareness can further complicate efforts to drive consumer engagement. Studies indicate that even when RVMs are available, a significant portion of the population may overlook their usage due to entrenched recycling habits or a lack of education about the benefits of participating in deposit return schemes. To address these challenges, businesses and governments must invest in robust educational campaigns and promotional strategies that clearly communicate the value of recycling and incentivize consumer participation. Engaging the public through interactive initiatives and rewards programs can foster a more sustainable recycling culture and improve the effectiveness of reverse vending machines in promoting environmental responsibility.
Market Segmentation Analysis:
By Type
The Reverse Vending Machine Market can be segmented into different types, including standalone machines and integrated systems. Standalone machines are typically deployed in high-traffic areas such as retail locations, while integrated systems are often part of larger waste management infrastructures, including municipal recycling programs. The increasing adoption of standalone machines is driven by their convenience and ease of use, encouraging more consumers to recycle.
By Technology
Technological advancements play a significant role in the Reverse Vending Machine Market, with key segments including RFID-enabled machines, sensor-based machines, and traditional machines. RFID-enabled machines offer enhanced tracking capabilities and improved user interaction, while sensor-based machines utilize advanced technologies to detect and sort recyclable materials accurately. Traditional machines, though still prevalent, are gradually being replaced by more sophisticated options that provide better efficiency and user engagement.
By End-User
The end-user segmentation of the Reverse Vending Machine Market includes retail, public sector, and commercial establishments. Retail environments, such as supermarkets and convenience stores, are significant users, as they encourage customers to return bottles and cans. The public sector also plays a crucial role, with municipalities deploying these machines to promote recycling efforts. Commercial establishments, including businesses and corporate offices, are increasingly adopting reverse vending machines to enhance their sustainability initiatives and engage employees in eco-friendly practices.
Segmentation:
Based on Type:
- Standalone Machines
- Integrated Systems
Based on Technology:
- RFID-Enabled Machines
- Sensor-Based Machines
- Traditional Machines
Based on End-User:
- Retail
- Public Sector
- Commercial Establishments
Based on Region:
- North America
- U.S.
- Canada
- Mexico
- Europe
- Germany
- France
- U.K.
- Italy
- Spain
- Rest of Europe
- Asia Pacific
- China
- Japan
- India
- South Korea
- South-east Asia
- Rest of Asia Pacific
- Latin America
- Brazil
- Argentina
- Rest of Latin America
- Middle East & Africa
- GCC Countries
- South Africa
- Rest of the Middle East and Africa
Regional Analysis:
North America (35%)
North America holds the largest market share in the Reverse Vending Machine Market, accounting for approximately 35% of the global market. This dominance can be attributed to the region's stringent recycling regulations and a high level of public awareness regarding environmental issues. The United States and Canada have implemented various policies that promote recycling initiatives, making reverse vending machines an integral part of waste management strategies. In the U.S., cities are increasingly deploying these machines in public spaces, such as parks and shopping centers, to encourage consumer participation in recycling programs. Retailers are also adopting reverse vending machines as part of their sustainability efforts, creating a win-win situation by reducing waste while attracting eco-conscious customers. Additionally, advancements in technology have made these machines more user-friendly and efficient, further driving their adoption. The region's strong infrastructure for waste management and recycling, coupled with the increasing involvement of private companies in developing innovative solutions, positions North America as a leader in the reverse vending machine sector. Furthermore, the presence of key players and ongoing investments in research and development are likely to foster continued growth in this market.
Europe (30%)
Europe is another significant player in the Reverse Vending Machine Market, holding a market share of around 30%. Countries such as Germany, Sweden, and the Netherlands are at the forefront of recycling initiatives, implementing effective policies that incentivize consumers to return recyclable materials. The European Union has set ambitious recycling targets, which has further propelled the deployment of reverse vending machines across the continent. Germany, in particular, has a well-established system for bottle and can return, significantly increasing the efficiency of recycling processes. Many retailers and municipalities have embraced reverse vending technology, integrating it into their waste management strategies to achieve higher recycling rates. The focus on the circular economy in Europe has also contributed to the growth of this market, with businesses increasingly seeking sustainable solutions that reduce environmental impact. Moreover, technological innovations in Europe, such as RFID-enabled machines and advanced sorting technologies, have improved the functionality and effectiveness of reverse vending machines. These advancements not only enhance user experience but also provide valuable data for optimizing recycling programs. As sustainability becomes a core focus for both consumers and businesses, the demand for reverse vending machines is expected to rise.
Asia-Pacific (25%)
The Asia-Pacific region is poised for significant growth in the Reverse Vending Machine Market, currently holding approximately 25% of the market share. The rapid urbanization and increasing population density in countries like China and India present unique challenges and opportunities for waste management. Governments in this region are recognizing the need for improved recycling systems, leading to heightened investments in reverse vending technology. China, in particular, has initiated several campaigns to promote recycling and reduce waste. The introduction of reverse vending machines in urban areas is part of a broader strategy to enhance environmental sustainability. Additionally, as public awareness regarding recycling grows, there is an increasing demand for user-friendly solutions that facilitate the process, making reverse vending machines an appealing option. India is also witnessing a surge in interest in reverse vending machines, particularly in metropolitan areas where waste management issues are prevalent. Initiatives by both governmental and non-governmental organizations are encouraging the adoption of these machines to foster a culture of recycling. Furthermore, technological advancements are paving the way for innovative solutions that can cater to the diverse needs of the region. As environmental regulations tighten and consumer preferences shift towards sustainable practices, the Asia-Pacific region is expected to experience rapid growth in the Reverse Vending Machine Market in the coming years. The combination of government initiatives, increasing public awareness, and technological advancements will play a crucial role in shaping the future of this market in the region.
Key Player Analysis:
- Aco Recycling
- Ake Environmental Technologies
- Diebold Nixdorf
- Endlos Innovations Private Limited
- Envipco Holding N.V.
- Kansmacker International
- RVM Systems AS
- Sielaff GmbH & Co. KG
- Tomra Systems ASA
- Teraoka Seiko Co. Ltd.
- Trautwein
- Veolia
- Zeleno
Competitive Analysis:
The competitive landscape of the reverse vending machine (RVM) market is characterized by a mix of established players and emerging innovators. Major companies like Tomra Systems ASA and EcoATM dominate the market, leveraging advanced technology and extensive distribution networks to offer high-quality, user-friendly machines. Tomra, for instance, has a strong reputation for its cutting-edge RVMs, which are equipped with smart features that enhance user experience and operational efficiency. Meanwhile, newer entrants are challenging the status quo by focusing on niche markets and developing compact solutions tailored for smaller retailers, such as the TOMRA M1, which addresses the needs of convenience stores. Additionally, partnerships between corporations and governments are becoming increasingly prevalent, driving the deployment of RVMs in public spaces. However, despite the competitive advantages of these established companies, the market is not without its challenges. The high costs associated with RVM installation and maintenance can deter potential entrants, while fluctuating consumer engagement poses ongoing hurdles. As sustainability becomes a priority for businesses and consumers alike, companies that can successfully integrate technology, foster consumer participation, and offer compelling value propositions are likely to emerge as leaders in this evolving market. The focus on innovation, supported by governmental regulations and public awareness campaigns, will play a critical role in shaping competitive dynamics in the reverse vending machine sector.
Recent Developments:
- In March 2023, Alpla-Werke Alwin Lehner GmbH & Co KG, a global leader in innovative plastic packaging solutions, acquired a stake in Plastic Bank, a Canadian organization focused on reducing plastic waste and promoting recycling in developing countries.
- In August 2022, Tomra Systems ASA, a leader in reverse vending technology, launched the TOMRA M1, the market's smallest three-material reverse vending machine. Occupying just 0.62 square meters, the TOMRA M1 is ideal for smaller retailers seeking to engage in deposit return schemes and promote recycling. This compact machine is specifically designed to meet the needs of convenience and small stores, facilitating their participation in sustainability initiatives.
Market Concentration & Characteristics:
The reverse vending machine (RVM) market exhibits moderate concentration, with a handful of key players dominating the landscape while also allowing for the entry of smaller, innovative companies. Major firms like Tomra Systems ASA and SUEZ are at the forefront, leveraging their extensive experience and established technologies to capture significant market share. These companies typically offer a range of advanced RVM solutions that incorporate smart technology, enabling efficient sorting and recycling processes. The market is characterized by a growing emphasis on sustainability, with many manufacturers focusing on enhancing the user experience and improving operational efficiency through IoT connectivity and data analytics. However, the presence of niche players is also notable, as these companies often target specific segments, such as convenience stores or educational institutions, with tailored solutions that meet unique needs. Furthermore, the market is influenced by regulatory frameworks that promote recycling initiatives, creating opportunities for collaboration between RVM manufacturers and local governments. This dynamic environment fosters innovation, leading to the development of compact, user-friendly machines that encourage consumer participation. Overall, while the market is concentrated around a few dominant players, the ongoing push for sustainability and technological advancement allows for diverse characteristics and growth opportunities within the sector.
Report Coverage:
The reverse vending machine (RVM) market is witnessing significant growth, driven by increasing environmental awareness and the push for sustainable waste management solutions. RVMs facilitate the automated collection and recycling of beverage containers, including plastic bottles and aluminum cans, encouraging consumers to participate in recycling efforts. The market is propelled by various factors, such as stringent government regulations aimed at reducing landfill waste and promoting circular economy practices. Additionally, advancements in technology have led to more efficient and user-friendly RVM designs, enhancing the consumer experience and boosting adoption rates. Key players in the market are investing in research and development to improve machine functionality and integrate smart features, such as mobile app connectivity and real-time data tracking. Regions like North America and Europe are currently leading in market share, largely due to established recycling frameworks and consumer awareness campaigns. However, the Asia-Pacific region is emerging as a rapidly growing market, spurred by urbanization and increasing emphasis on waste management solutions. The competitive landscape includes partnerships between manufacturers and municipalities, aiming to expand the deployment of RVMs in public spaces, retail environments, and educational institutions. Overall, the RVM market is poised for robust growth, driven by the dual imperatives of sustainability and technological innovation, ultimately contributing to the reduction of plastic waste and promoting responsible consumer behavior.
Future Outlook:
- The Reverse Vending Machine market will continue to expand as governments and private organizations focus on enhancing recycling systems and reducing waste
- Technological advancements, such as IoT integration and smart sensors, will make reverse vending machines more efficient, user-friendly, and cost-effective for operators.
- Increased urbanization and rising consumer awareness of environmental sustainability will drive greater adoption of reverse vending machines in cities worldwide.
- Growing regulatory pressure on industries to meet higher recycling targets will boost the installation of reverse vending machines, particularly in regions with stringent environmental laws.
- The development of more advanced machine features, like multi-container recognition and AI-driven sorting capabilities, will improve operational efficiency and user experience.
- As emerging economies prioritize waste management infrastructure, reverse vending machines will gain significant traction in regions such as Asia-Pacific and Latin America.
- Public-private partnerships will play a crucial role in accelerating the adoption of reverse vending machines, especially in areas with limited recycling facilities.
- The expansion of reverse vending machines in high-traffic areas, such as shopping malls, transportation hubs, and stadiums, will increase convenience and accessibility for users.
- With the growing focus on circular economies, reverse vending machines will align with broader sustainability goals, fostering greater material recovery and resource reuse.
- The market will witness rising investments from both established players and new entrants, further enhancing innovation and competition in the industry.
Request a Free Sample
Fill in your details and we'll send you a free sample report.
- Sample data tables & charts
- Research methodology
Need a Custom Version of This Report?
Tailor the scope, geography, or segments to your exact requirements.
- Custom geography or segment scope
- Direct access to our analyst team
Frequently Asked Questions
What is the projected growth of the Reverse Vending Machine Market from 2024 to 2032?
What factors are driving the growth of the Reverse Vending Machine Market?
How are reverse vending machines contributing to sustainability?
Which regions are expected to lead the Reverse Vending Machine Market?
Why is the Asia-Pacific region expected to experience significant growth in the Reverse Vending Machine Market?
Table of Content
Chapter 1. Report Introduction
- 1.1 Report Description & Purpose
- 1.1.1 Report Title & Market Definition
- 1.1.2 Unique Selling Propositions (USP) & Key Differentiators
- 1.1.3 Value Proposition for Stakeholders
- 1.2 Research Objectives
- 1.2.1 Market Sizing Objectives (Volume & Revenue)
- 1.2.2 Segmentation Objectives
- 1.2.3 Competitive Intelligence Objectives
- 1.2.4 Forecast & Scenario Objectives
- 1.3 Report Scope
- 1.3.1 Reverse Vending Machine Scope – Types & Subtypes Covered
- 1.3.2 Geographic Scope – Regions & Countries Covered
- 1.3.3 Historical Period, Base Year & Forecast Period (2024; forecast to 2032)
- 1.3.4 Inclusions & Exclusions
- 1.4 HS Code & Classification Framework
- 1.5 Currency, Units & Pricing Basis
- 1.6 Target Stakeholders
- 1.7 Limitations & Assumptions
Chapter 2. Executive Summary
- 2.1 Global Reverse Vending Machine Market Snapshot
- 2.1.1 Market Size – Historical (2024) & Forecast (2024-2032) (2024: USD 461.2 million → 2032: USD 718.6 million)
- 2.1.2 Volume & Revenue – Global Totals
- 2.1.3 Key Market Highlights – Top Five Facts
- 2.2 Reverse Vending Machine Market Segmentation Snapshot
- 2.2.1 Market Split by Region – 2024 vs. 2032
- 2.3 Competitive Snapshot
- 2.3.1 Top 10 Players by Revenue Share – 2024
- 2.3.2 Top 10 Players by Volume Share – 2024
- 2.3.3 Recent Strategic Developments (18-Month Summary)
- 2.4 Key Investment Highlights & Strategic Conclusions
Chapter 3. Reverse Vending Machine Market Dynamics & Industry Analysis
- 3.1 Market Overview & Context
- 3.1.1 Reverse Vending Machine Market Position in the Broader Automotive Value Chain
- 3.1.2 OEM vs. Replacement Market Dynamics
- 3.1.3 Market Maturity & Development Stage by Region
- 3.2 Reverse Vending Machine Market Drivers
- 3.3 Reverse Vending Machine Market Restraints & Challenges
- 3.4 Reverse Vending Machine Market Opportunities
- 3.5 Porter's Five Forces Analysis
- 3.5.1 Threat of New Entrants
- 3.5.2 Bargaining Power of Suppliers
- 3.5.3 Bargaining Power of Buyers
- 3.5.4 Threat of Substitutes
- 3.5.5 Competitive Rivalry – Intensity Assessment
- 3.6 Reverse Vending Machine Value Chain Analysis
- 3.6.1 Upstream – Raw Material/Input Suppliers
- 3.6.1.1 Raw Material/Input 1
- 3.6.1.2 Raw Material/Input 2
- 3.6.1.3 Raw Material/Input 3
- 3.6.2 Midstream – Production/Manufacturing/Service Delivery
- 3.6.2.1 Production/Process Overview
- 3.6.2.2 Key Facility Locations & Capacity by Manufacturer
- 3.6.3 Downstream – Distribution & End Consumer
- 3.6.3.1 Primary Channel – B2B/OEM
- 3.6.3.2 Secondary Channels – Dealer, Retail, Online, Direct
- 3.6.4 Value Chain Profitability Analysis
- 3.6.1 Upstream – Raw Material/Input Suppliers
- 3.7 PESTEL Analysis
- 3.7.1 Political Factors
- 3.7.2 Economic Factors
- 3.7.3 Social Factors
- 3.7.4 Technological Factors
- 3.7.5 Environmental Factors
- 3.7.6 Legal Factors
- 3.8 Reverse Vending Machine Supply Chain Analysis
- 3.8.1 Raw Material/Input Supply Risk Assessment
- 3.8.2 Manufacturing Concentration Risk (Geographic Exposure)
- 3.8.3 Trade Disruption Impact Analysis
- 3.9 Regulatory & Policy Landscape
Note: The regulatory and policy landscape section covers regulations based on their applicability to the market, Reverse Vending Machine category, geography, and scope of the study. Only regulatory frameworks with a material impact on operations, compliance, trade, sustainability, or market access are analyzed in detail.
Chapter 4. Key Investment Pockets & Opportunity Analysis
- 4.1 Reverse Vending Machine Market Attractiveness Analysis
- 4.1.1 By Region – Investment Attractiveness Matrix (Volume × CAGR)
- 4.2 Absolute Revenue Growth Opportunity
- 4.2.1 By Region – Absolute USD Growth Through 2032
- 4.3 Incremental Volume Opportunity
- 4.3.1 By Region – Incremental Volume Through 2032
- 4.3.2 Segment – Incremental Volume
- 4.4 Emerging Submarket Opportunity Deep Dive (Subject to Applicability)
- 4.5 Emerging Market Opportunity Scorecards
- 4.5.1 United States
- 4.5.2 Europe
- 4.5.3 Asia
- 4.5.4 Middle East & Africa
Note: Emerging Market Opportunity Scorecards will be included based on relevance and strategic importance. Regions listed are indicative and may vary depending on data availability and market dynamics.
Chapter 5. Reverse Vending Machine Import-Export Analysis & Trade Flows
- 5.1 Global Trade Overview
- 5.1.1 Global Export Value by Country (2024)
- 5.1.2 Global Export Volume by Country (2024)
- 5.1.3 Global Import Value by Country (2024)
- 5.1.4 Global Import Volume by Country (2024)
- 5.1.5 Net Trade Balance by Country (2024)
- 5.2 Export Analysis – Segment
- 5.2.1 Type 1 (HS Code)
- 5.2.2 Type 2 (HS Code)
- 5.2.3 Type 3 (HS Code)
- 5.2.4 Type 4 (HS Code)
- 5.2.5 Type 5 (HS Code)
- 5.3 Import Analysis – Segment
- 5.3.1 Type 1 (HS Code)
- 5.3.2 Type 2 (HS Code)
- 5.3.3 Type 3 (HS Code)
- 5.3.4 Type 4 (HS Code)
- 5.3.5 Type 5 (HS Code)
- 5.4 Average Unit Trade Prices
- 5.4.1 Average Export Price – Segment & Country
- 5.4.2 Average Import Price – Segment & Source Country
- 5.4.3 Price Trends (2024)
- 5.5 Key Trade Route Analysis
- 5.5.1 Trade Route 1
- 5.5.2 Trade Route 2
- 5.5.3 Trade Route 3
- 5.5.4 Trade Route 4
- 5.5.5 Trade Route 5
- 5.6 Trade Policy Impact Assessment
- 5.6.1 US Anti-Dumping & Section 301 Tariffs
- 5.6.2 EU Customs Union Impact
- 5.6.3 Major Free Trade Agreements
- 5.6.4 USMCA Rules of Origin
Note: Trade policy analysis will be included only where relevant to the Reverse Vending Machine market.
Chapter 6. Competitive Landscape & Company Benchmarking
- 6.1 Reverse Vending Machine Market Concentration & Structure
- 6.1.1 Herfindahl-Hirschman Index (HHI) – vs. 2024
- 6.1.2 Tier 1, Tier 2 & Tier 3 Market Structure
- 6.1.3 Global, Regional & Local Player Dynamics
- 6.2 Reverse Vending Machine Market Share Analysis – 2024
- 6.2.1 Global Revenue Share by Company
- 6.2.2 Global Volume Share by Company
- 6.2.3 Regional Revenue Share
- 6.2.4 Market Share Evolution ( vs. 2024)
- 6.2.5 OEM Segment Share by Company
- 6.2.6 Replacement Segment Share by Company
- 6.3 Production/Delivery Capacity & Facility Analysis
- 6.3.1 Global Installed Capacity
- 6.3.2 Capacity Utilization Rates
- 6.3.3 Production/Output Volume
- 6.3.4 Facility Locations & Capacity Map
- 6.3.5 Planned Capacity Additions
- 6.4 Reverse Vending Machine Competitive Benchmarking Matrix
- 6.4.1 Revenue, Volume, CAGR & Profitability Comparison
- 6.4.2 Channel Revenue Mix
- 6.4.3 Geographic Revenue Exposure
- 6.4.4 R&D Intensity
- 6.4.5 Sustainability Maturity
- 6.5 Strategic Developments in Reverse Vending Machine (Last 24 Months)
- 6.5.1 Mergers, Acquisitions & Divestments
- 6.5.2 New Reverse Vending Machine Launches
- 6.5.3 Facility Expansions
- 6.5.4 Strategic Alliances, Joint Ventures & Partnerships
- 6.5.5 Distribution Expansion & Market Entry
- 6.5.6 Sustainability & ESG Initiatives
- 6.6 Competitive Strategy Mapping
- 6.6.1 Leader, Challenger, Follower & Niche Classification
- 6.6.2 Pricing Strategy Comparison
- 6.6.3 Channel Strategy Matrix
Note: Strategic developments are included based on their materiality and the availability of reliable information.
Chapter 7. Global Reverse Vending Machine Market – By Distribution Channel
- 7.1 Segment Overview
- 7.1.1 Volume & Revenue Split by Channel (2024 & 2032)
- 7.1.2 Channel Mix Evolution (2024-2032)
Chapter 8. Regional Market Analysis – Global Overview
- 8.1 Global Regional Overview
- 8.1.1 Regional Volume Share
- 8.1.2 Regional Revenue Share
- 8.1.3 Regional Volume by Region
- 8.1.4 Regional Revenue by Region
- 8.1.5 Regional Forecast Through 2032
- 8.2 Cross-Regional Segment Analysis
- 8.2.1 By Distribution Channel
- 8.2.2 By Brand/Price Tier
Chapter 9. North America Reverse Vending Machine Market
- 9.1 United States
- 9.2 Canada
- 9.3 Mexico
Chapter 10. Europe Reverse Vending Machine Market
- 10.1 Germany
- 10.2 France
- 10.3 Italy
- 10.4 United Kingdom
- 10.5 Spain
- 10.6 Poland
- 10.7 Russia
- 10.8 Netherlands
- 10.9 Belgium
- 10.10 Sweden
- 10.11 Denmark
- 10.12 Norway
- 10.13 Rest of Europe
Chapter 11. Asia Pacific Reverse Vending Machine Market
- 11.1 China
- 11.2 India
- 11.3 Japan
- 11.4 South Korea
- 11.5 Thailand
- 11.6 Indonesia
- 11.7 Vietnam
- 11.8 Malaysia
- 11.9 Australia
- 11.10 Rest of Asia Pacific
Chapter 12. Latin America Reverse Vending Machine Market
- 12.1 Brazil
- 12.2 Argentina
- 12.3 Colombia
- 12.4 Chile
- 12.5 Rest of Latin America
Chapter 13. Middle East Reverse Vending Machine Market
- 13.1 Saudi Arabia
- 13.2 United Arab Emirates
- 13.3 Turkey
- 13.4 Israel
- 13.5 Iran
- 13.6 Rest of the Middle East
Chapter 14. Africa Reverse Vending Machine Market
- 14.1 South Africa
- 14.2 Egypt
- 14.3 Nigeria
- 14.4 Morocco
- 14.5 Rest of Africa
Chapter 15. Reverse Vending Machine Company Profiles
- 15.1 [Company 01]
- 15.1.1 Company Overview
- 15.1.2 Key Management Personnel
- 15.1.3 Products & Services Portfolio
- 15.1.4 Financial Performance
- 15.1.5 Key Market Focus & Geographic Presence
- 15.1.6 Recent Developments & Strategic Initiatives
Note: The company profile list is preliminary and may change based on research findings, market developments, data availability, and client requirements.
Chapter 16. Appendices
- Appendix A – List of Abbreviations & Acronyms
- Appendix B – Industry Classification Code Reference – Full Series
- Appendix C – Production & Capacity Data Tables
- Appendix D – End-Use & Demand Base Tables
- Appendix E – Consumption & Replacement Rate Assumptions
- Appendix F – ASP Reference Tables
- Appendix G – Manufacturing & Facility Database
- Appendix H – Import-Export Data Tables
- Appendix I – Regulatory Summary Tables
- Appendix J – Primary Research Participant List (Anonymized)
- Appendix K – Primary Research Questionnaire Framework
- Appendix L – Data Sources & Bibliography
- Appendix M – Market Size Divergence & Source Comparison
Chapter 17. Research Methodology
- 17.1 Research Framework & Philosophy
- 17.2 Secondary Research – Sources, Hierarchy & Data Extraction
- 17.3 Data Modeling – Bottom-Up & Top-Down Market Sizing
- 17.4 Primary Research – Stakeholder Framework, LOI & Sample Sizes
- 17.5 Forecast Methodology – Regression, Scenario & Sensitivity Analysis
- 17.6 Quality Control – Four-Layer Validation Framework
- 17.7 Limitations & Standard Assumptions
- 17.8 Disclaimer
