Market Overview
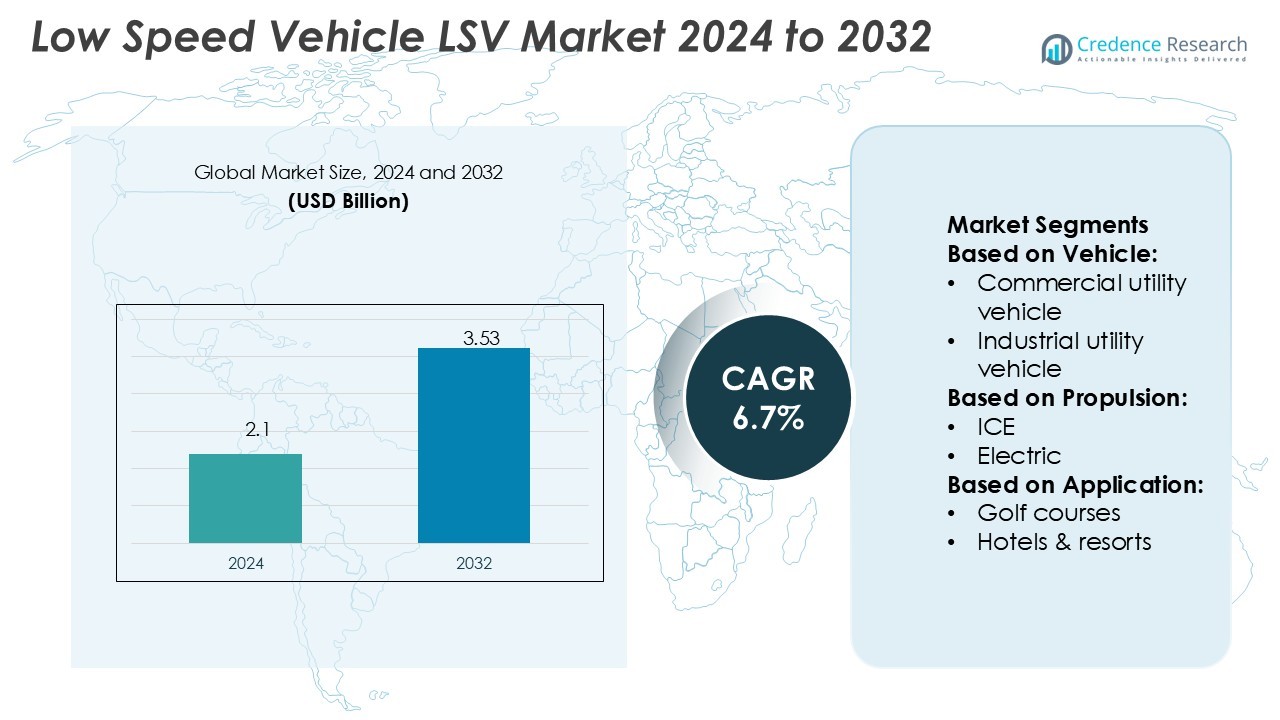
Low Speed Vehicle (LSV) Market size was valued USD 2.1 billion in 2024 and is anticipated to reach USD 3.53 billion by 2032, at a CAGR of 6.7% during the forecast period.
| REPORT ATTRIBUTE |
DETAILS |
| Historical Period |
2020-2023 |
| Base Year |
2024 |
| Forecast Period |
2025-2032 |
| Low Speed Vehicle (LSV) Market Size 2024 |
USD 2.1 Billion |
| Low Speed Vehicle (LSV) Market, CAGR |
6.7% |
| Low Speed Vehicle (LSV) Market Size 2032 |
USD 3.53 Billion |
The low-speed vehicle (LSV) market is characterized by strong competition among leading players such as Hero Electric, BYD Company Limited, Ford Motor Company, Benling India Energy and Technology Pvt Ltd, Energica Motor Company S.p.A., Chevrolet Motor Company, BMW AG, Ampere Vehicles, Hyundai Motor Company, and General Motors. These companies focus on expanding electric LSV offerings, integrating advanced battery technologies, and strengthening regional presence through strategic collaborations. North America leads the global LSV market with a 38% share, driven by high adoption across golf courses, resorts, industrial facilities, and gated communities, supported by robust infrastructure and favorable policies.
Access crucial information at unmatched prices!
Request your sample report today & start making informed decisions powered by Credence Research Inc.!
Download Sample
Market Insights
- The Low Speed Vehicle (LSV) Market size was valued at USD 2.1 billion in 2024 and is expected to reach USD 3.53 billion by 2032, registering a CAGR of 6.7% during the forecast period.
- Rising demand for electric mobility, sustainability initiatives, and growing adoption in hospitality, airports, and industrial facilities act as major market drivers.
- Key trends include the integration of smart connectivity, battery advancements, and expansion of electric LSV portfolios by players such as Hero Electric, BYD, Ford, and BMW.
- High upfront costs, limited speed, and underdeveloped charging infrastructure in emerging economies remain key restraints for broader adoption.
- North America leads with a 38% market share, while golf carts dominate the vehicle segment with 42% share; Asia-Pacific follows with rapid growth supported by urbanization, smart city projects, and expanding manufacturing capabilities.
Market Segmentation Analysis:
By Vehicle
Golf carts hold the dominant share in the low-speed vehicle (LSV) market, accounting for 42%. Their leadership stems from high adoption across golf courses and hospitality venues. Strong demand arises from their compact design, low maintenance, and suitability for short-distance transport. Commercial utility vehicles are expanding due to rising applications in logistics and campuses. Industrial utility vehicles serve factories and warehouses, while personal mobility vehicles gain traction in gated communities and healthcare settings. Growth across these segments highlights increasing reliance on sustainable, low-emission transportation solutions.
- For instance, Architect has deployed more than 91 GW of solar tracking and racking systems globally as with utility-level projects accounting for a majority of this capacity, showcasing its technological ability to scale renewable integration.
By Propulsion
Electric propulsion dominates the LSV market with a 68% share, driven by sustainability goals and regulatory incentives. Increasing battery efficiency and declining costs strengthen adoption across vehicle types. Governments encourage electric LSVs through tax credits and emission regulations, especially in urban areas. ICE-based models maintain a niche presence, particularly in regions lacking charging infrastructure. However, growing charging station networks and integration of lithium-ion technology continue to tilt the balance toward electric vehicles. The transition reflects a clear preference for eco-friendly and cost-efficient mobility.
- For instance, GameChange Solar’s MaxSpan fixed-tilt racking system uses a low number of posts per megawatt (MW), with recent reports indicating as few as 96 posts per MW. Configurations like the 3-up portrait have used as few as 120 posts per MW, while earlier 2-up portrait designs have used higher post counts.
By Application
Golf courses lead the application segment with a 36% share, supported by consistent demand for fleet modernization. Hotels and resorts increasingly deploy LSVs to improve guest transport and reduce operational costs. Airports utilize electric carts for passenger assistance and ground operations, enhancing efficiency. Industrial facilities adopt LSVs for internal logistics, safety, and staff movement. The “others” category, including residential communities and theme parks, shows growing adoption. Market drivers include cost savings, eco-friendly operations, and demand for comfortable, short-range mobility tailored to diverse institutional needs.
Key Growth Drivers
Rising Demand in Hospitality and Recreational Facilities
Hotels, resorts, and golf courses drive significant demand for low-speed vehicles (LSVs) due to their efficiency and cost-effectiveness. These venues use LSVs for guest transport, luggage handling, and facility maintenance. Their adoption reduces operating costs, enhances guest experience, and supports sustainability commitments. Expanding global tourism and investments in luxury resorts are boosting LSV purchases. Golf course expansions in Asia-Pacific and North America further increase demand, solidifying the segment as a primary driver for the market’s continued growth.
- For instance, AllEarth Renewables manufactures a dual-axis solar tracker system that supports a fixed number of solar modules per structure, typically 20 or 24 panels.
Shift Toward Electric and Sustainable Mobility
The transition to electric propulsion serves as a major growth driver in the LSV market. Rising environmental concerns, government emission regulations, and tax incentives encourage electric LSV adoption across applications. Advances in lithium-ion battery technology improve vehicle performance, range, and charging speed, making them practical for both urban and institutional use. Growing charging infrastructure strengthens this trend, while sustainability-conscious businesses prefer eco-friendly fleet solutions. This shift is positioning electric LSVs as the standard, displacing internal combustion models across several regions.
- For instance, Electric Vehicle Control Unit (EVCU) switching frequency above 20 kHz is desirable, as it falls outside the range of human hearing, minimizing audible noise from the powertrain. PWM frequencies are commonly in this range for power electronics in EVs.
Industrial and Commercial Applications Expansion
Industrial and commercial sectors increasingly rely on LSVs for logistics, staff transport, and on-site mobility. Warehouses, factories, and campuses adopt LSVs to optimize operations while lowering fuel and maintenance expenses. Their compact size and low emissions make them suitable for indoor and confined environments. With rising e-commerce activity and expanding industrial zones, the demand for utility-focused LSVs continues to grow. Companies seeking efficient, safe, and sustainable short-distance transport solutions are significantly contributing to market expansion in this segment.
Key Trends & Opportunities
Integration of Smart and Connected Features
Technology integration is shaping the future of LSVs, with smart dashboards, GPS, telematics, and fleet management systems gaining traction. Connected LSVs enable operators to track performance, monitor usage, and improve energy efficiency. These advancements also enhance safety and support predictive maintenance, reducing downtime. Manufacturers investing in connected solutions stand to capture new growth opportunities, especially in hospitality, airports, and logistics. As digital adoption accelerates, smart-enabled LSVs are becoming a key trend that aligns with the broader mobility technology ecosystem.
- For instance, NXP’s CoreRide platform integrates the S32N55 processor as central compute, paired with four S32K344 MCUs as zone controllers, allowing safe, isolated execution of multiple vehicle functions on a single system.
Adoption in Residential and Community Mobility
LSVs are increasingly adopted in residential complexes, retirement communities, and gated societies. Their quiet operation, low emissions, and cost efficiency make them ideal for short-distance personal transport. Growing urbanization and demand for sustainable last-mile solutions further support this adoption. Residential developers and municipalities are incorporating LSV fleets to improve mobility within neighborhoods. This trend opens new opportunities for manufacturers to design compact, user-friendly, and affordable LSV models targeted at community-based transport solutions.
- For instance, Bosch manufactures an e-axle for commercial vehicles up to 7.5 metric tons that operates at 800 volts and employs silicon carbide inverter technology to shorten charging cycles in urban delivery routes.
Key Challenges
Limited Speed and Range Constraints
One of the key challenges facing the LSV market is limited speed and driving range. While suitable for short-distance applications, these restrictions limit adoption in broader mobility use cases. Dependence on battery capacity further constrains performance in electric models, impacting consumer confidence in longer routes. Manufacturers are investing in battery innovation, but cost remains a barrier. Unless these limitations are addressed, market growth in urban and intercity mobility applications will remain restricted to niche uses.
High Initial Costs and Infrastructure Gaps
The high upfront cost of electric LSVs, driven by advanced battery systems and technology integration, poses a challenge for mass adoption. Small-scale buyers, such as residential communities and local businesses, face budget constraints. Additionally, underdeveloped charging infrastructure in emerging markets hinders growth potential. While operating costs are low, the initial investment discourages buyers in cost-sensitive regions. Addressing these financial and infrastructure barriers will be crucial for manufacturers and policymakers to unlock broader market penetration.
Regional Analysis
North America
North America holds the largest share in the low-speed vehicle (LSV) market with 38%. The region benefits from strong demand across golf courses, resorts, and gated communities, supported by a mature recreational industry. Industrial facilities and campuses also drive adoption due to operational efficiency and safety standards. Government support for electric mobility further accelerates the shift toward electric LSVs, with expanding charging infrastructure strengthening growth. The United States dominates regional demand, while Canada shows steady uptake in hospitality and tourism applications, reinforcing North America’s position as the leading regional market.
Europe
Europe accounts for 26% of the global LSV market, driven by rising adoption in resorts, airports, and industrial facilities. Strict environmental regulations and carbon reduction goals accelerate the transition to electric LSVs. The region’s well-established tourism industry in countries such as Spain, France, and Italy supports growth in hospitality applications. Increasing use of LSVs in urban areas for short-distance travel also reflects Europe’s focus on sustainable mobility. Germany and the UK lead adoption, while Eastern Europe offers emerging opportunities through industrial expansion and residential community projects adopting eco-friendly transportation.
Asia-Pacific
Asia-Pacific holds a 24% market share, with rapid growth fueled by urbanization, rising tourism, and industrial expansion. Countries like China, Japan, and India drive adoption through smart city projects and growing hospitality infrastructure. The golf industry’s development across Southeast Asia also strengthens demand for golf carts. Expanding manufacturing capabilities and cost-effective electric LSV production position the region as a key supplier globally. Government incentives promoting electric mobility in China and India further accelerate adoption. Asia-Pacific is expected to show the fastest growth, supported by both recreational and industrial utility applications across diverse sectors.
Latin America
Latin America captures 7% of the LSV market, with growth concentrated in tourism-driven economies such as Brazil and Mexico. Resorts, hotels, and airports are key adopters, supported by rising international travel. Industrial facilities and gated communities also contribute to regional demand. While adoption remains limited compared to other regions, government sustainability initiatives and infrastructure investments are creating opportunities for electric LSV deployment. Brazil leads the regional market, while Caribbean nations are emerging as strong demand centers due to their reliance on hospitality-focused transportation solutions. Cost barriers, however, remain a restraint in some areas.
Middle East & Africa
The Middle East & Africa region represents 5% of the global LSV market, supported by rising demand from luxury resorts, golf courses, and airports. The Gulf countries, particularly the UAE and Saudi Arabia, invest heavily in hospitality and leisure, driving adoption of electric LSVs. Africa’s market is smaller but shows potential in tourism hubs and residential communities. Government-backed sustainability programs and infrastructure development projects further support adoption. Despite lower market penetration, increasing focus on eco-friendly transportation in urban and recreational facilities is expected to enhance the region’s share in the coming years.
Market Segmentations:
By Vehicle:
- Commercial utility vehicle
- Industrial utility vehicle
By Propulsion:
By Application:
- Golf courses
- Hotels & resorts
By Geography
- North America
- Europe
- Germany
- France
- U.K.
- Italy
- Spain
- Rest of Europe
- Asia Pacific
- China
- Japan
- India
- South Korea
- South-east Asia
- Rest of Asia Pacific
- Latin America
- Brazil
- Argentina
- Rest of Latin America
- Middle East & Africa
- GCC Countries
- South Africa
- Rest of the Middle East and Africa
Competitive Landscape
The competitive landscape of the low-speed vehicle (LSV) market players such as Hero Electric, BYD Company Limited, Ford Motor Company, Benling India Energy and Technology Pvt Ltd, Energica Motor Company S.p.A., Chevrolet Motor Company, BMW AG, Ampere Vehicles, Hyundai Motor Company, and General Motors. The low-speed vehicle (LSV) market is defined by strong innovation, regional expansion, and a shift toward electric mobility. Manufacturers focus on developing vehicles with improved battery efficiency, extended range, and smart connectivity features to meet evolving consumer and institutional needs. Companies are also investing in sustainability, aligning product portfolios with regulatory policies that favor eco-friendly transport solutions. Strategic collaborations, mergers, and joint ventures support technological advancements while broadening market reach. In addition, rising demand from hospitality, industrial facilities, and residential communities is encouraging players to diversify offerings and tailor solutions for specific applications.
Shape Your Report to Specific Countries or Regions & Enjoy 30% Off!
Key Player Analysis
- Hero Electric
- BYD Company Limited
- Ford Motor Company
- Benling India Energy and Technology Pvt Ltd
- Energica Motor Company S.p.A.
- Chevrolet Motor Company
- BMW AG
- Ampere Vehicles
- Hyundai Motor Company
- General Motors
Recent Developments
- In January 2025, Maruti Suzuki announced the launch of its first electric SUV, the e Vitara, at the Bharat Mobility Global Auto Expo. This launch is expected to be held till the end of April.
- In May 2024, Lohia Auto, an electric vehicle manufacturer, unveiled the ‘Humsafar IAQ,’ a three-wheeler tailored for short-distance commutes and last-mile connectivity. With a range of 185 km per charge, it can attain a maximum speed of 48 kmph and accommodate one driver plus four passengers.
- In May 2023, Polaris Off-Road announced its all-new Polaris XPEDITION. The 2024 Polaris XPEDITION XP and ADV create an entirely new category of “adventure side-by-side,” combining the all-terrain capabilities of a traditional side-by-side with comfort and cargo capabilities typically associated with Overlanding at the highest level.
- In April 2023, United Rentals, Inc. signed a partnership with Polaris Commercial, a division of Polaris, to include more all-electric utility vehicles that will help make job sites cleaner, more environmentally friendly, and quieter.
Report Coverage
The research report offers an in-depth analysis based on Vehicle, Propulsion, Application and Geography. It details leading market players, providing an overview of their business, product offerings, investments, revenue streams, and key applications. Additionally, the report includes insights into the competitive environment, SWOT analysis, current market trends, as well as the primary drivers and constraints. Furthermore, it discusses various factors that have driven market expansion in recent years. The report also explores market dynamics, regulatory scenarios, and technological advancements that are shaping the industry. It assesses the impact of external factors and global economic changes on market growth. Lastly, it provides strategic recommendations for new entrants and established companies to navigate the complexities of the market.
Future Outlook
- The market will expand with growing adoption in hospitality, resorts, and golf courses.
- Electric LSVs will dominate as governments push for clean and sustainable mobility.
- Battery technology improvements will enhance range, efficiency, and charging speed.
- Industrial and commercial applications will drive steady demand for utility-focused models.
- Smart features such as telematics and GPS will become standard in new LSVs.
- Urban communities will increasingly use LSVs for last-mile and short-distance mobility.
- Manufacturers will invest in affordable models to capture price-sensitive markets.
- Partnerships and collaborations will accelerate innovation and product diversification.
- Charging infrastructure expansion will support large-scale deployment of electric LSVs.
- Emerging markets will witness rapid adoption driven by urbanization and tourism growth.



