Market Overview
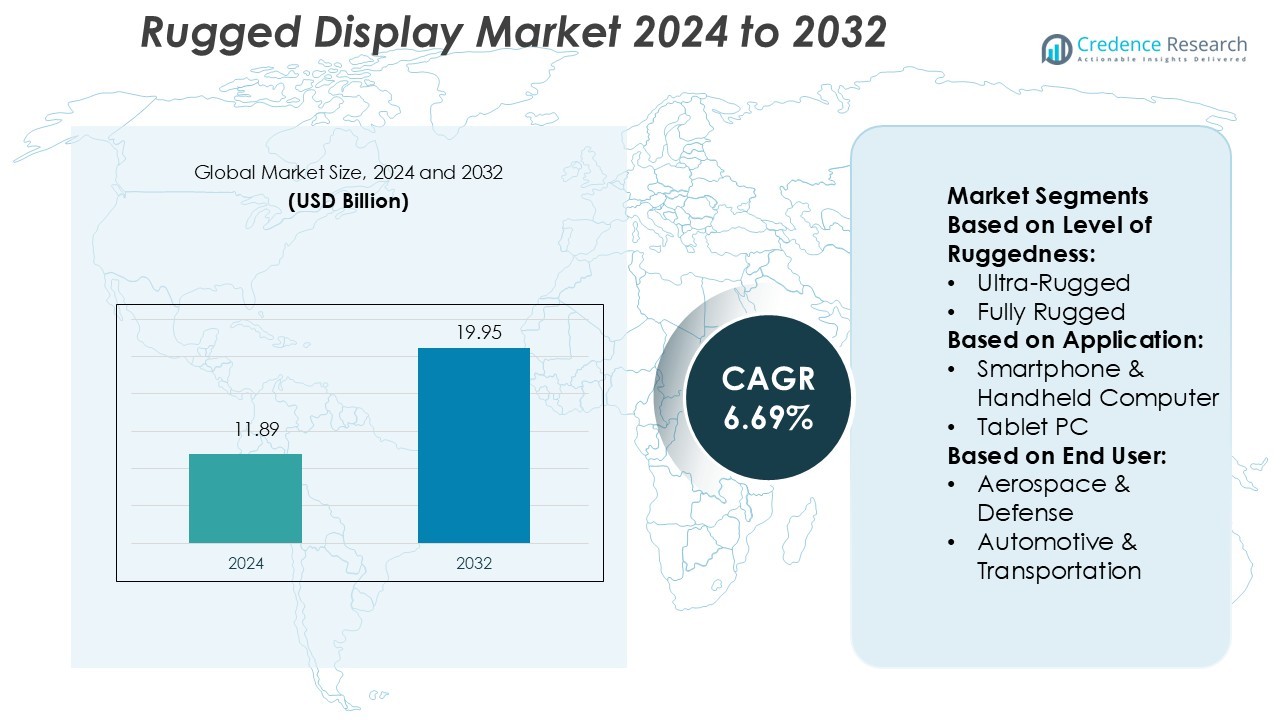
Rugged Display Market size was valued USD 11.89 billion in 2024 and is anticipated to reach USD 19.95 billion by 2032, at a CAGR of 6.69% during the forecast period.
| REPORT ATTRIBUTE |
DETAILS |
| Historical Period |
2020-2023 |
| Base Year |
2024 |
| Forecast Period |
2025-2032 |
| Rugged Display Market Size 2024 |
USD 11.89 Billion |
| Rugged Display Market, CAGR |
6.69% |
| Rugged Display Market Size 2032 |
USD 19.95 Billion |
The rugged display market is led by major players such as Panasonic Corporation, General Dynamics Corp., Sharp Corporation, AU Optronics Corp., Getac Technology Corp., Zebra Technologies Corp., LG Display Co., Ltd., BOE Technology Group Co., Ltd., Innolux Corporation, and Samsung Electronics Co., Ltd. These companies focus on developing high-performance, durable display solutions for mission-critical applications across defense, aerospace, industrial, and public safety sectors. Advanced display technology, product customization, and strong global distribution networks strengthen their competitive edge. North America leads the market with a 36% share, supported by strong defense spending, industrial automation, and widespread adoption of rugged mobility solutions.
Access crucial information at unmatched prices!
Request your sample report today & start making informed decisions powered by Credence Research Inc.!
Download Sample
Market Insights
- The rugged display market size was valued at USD 11.89 billion in 2024 and is projected to reach USD 19.95 billion by 2032, growing at a CAGR of 6.69% during the forecast period.
- Strong demand from defense, aerospace, and industrial sectors is driving market growth through high adoption of durable and mission-critical display solutions.
- Integration of advanced display technologies, IoT connectivity, and product customization is shaping market trends and strengthening competitive positions.
- High costs and integration challenges remain key restraints, particularly in price-sensitive industries and regions with limited technological infrastructure.
- North America leads the market with a 36% share, followed by Europe at 27% and Asia Pacific at 22%, while ultra-rugged displays hold the dominant segment share due to their widespread use in harsh operational environments.
Market Segmentation Analysis:
By Level of Ruggedness
Ultra-rugged displays dominate the market with the highest share, driven by their robust build and extreme environment tolerance. These displays offer superior resistance to shock, vibration, water, and temperature variations. They are widely used in defense, industrial, and critical field operations. Fully rugged and semi-rugged categories follow due to their adoption in less demanding environments like logistics and commercial transport. The rising need for mission-critical data access in remote locations strengthens demand for ultra-rugged devices, making them the preferred choice for high-performance applications.
- For instance, Panasonic Corporation’s TOUGHBOOK 40 is officially certified to meet MIL-STD-810H standards. This is a military standard covering a wide range of ruggedness tests, including drops, shocks, and vibrations.
By Application
Panel PC and mission-critical displays lead the market with the largest share, supported by their deployment in defense, aerospace, and heavy industrial operations. These systems deliver stable performance under harsh conditions and integrate advanced touch and processing capabilities. Rugged smartphones and tablets also show strong growth due to increased field mobility. Vehicle-mounted computers and avionics displays cater to specialized operational needs. The rising adoption of automation and connected systems across industries drives further demand for panel PC and mission-critical display solutions.
- For instance, Sharp’s PN-M752 large-format display offers a 75″ screen size with a native resolution of 3840 × 2160 pixels, brightness of 550 cd/m², 24/7 operation, and USB-C input support.
By End-user
Aerospace and defense represent the dominant end-user segment, supported by their high reliance on rugged displays for command, control, and mission operations. These displays are essential for critical communications, navigation, and situational awareness in extreme conditions. Industrial applications follow closely due to their use in manufacturing, oil and gas, and construction. Government, public safety, and healthcare sectors are increasing adoption for real-time monitoring and secure operations. High reliability, advanced functionality, and environmental endurance make rugged displays indispensable across defense and industrial domains.
Key Growth Drivers
Rising Demand for Mission-Critical Applications
The rugged display market grows strongly due to increasing use in mission-critical operations across defense, aerospace, and industrial sectors. These displays deliver reliable performance in extreme environments, ensuring uninterrupted operations during combat missions, field operations, and remote monitoring. Their durability against shock, water, and temperature variations boosts deployment in demanding applications. Government modernization programs and defense investments accelerate adoption. Industries also prefer rugged solutions to minimize downtime, enhance operational efficiency, and support real-time decision-making in critical and hazardous settings.
- For instance, AUO’s wide-temperature LCD technology is explicitly designed to resist operation from -20 °C to +70 °C. Some of their specific industrial and automotive panels have even wider operating ranges, such as -30 °C to +85 °C.
Expansion of Industrial Automation
Industrial automation is driving higher adoption of rugged displays for controlling and monitoring production lines. Factories, oil and gas facilities, and logistics operations rely on these displays to provide clear data visibility under harsh operating conditions. Rugged panel PCs, handheld devices, and vehicle-mounted systems support precise tracking and control functions. Increasing investments in smart factories and digital infrastructure fuel this growth. The strong focus on uninterrupted operations and worker safety creates sustained demand for rugged display systems across industrial environments.
- For instance, Getac’s Getac S410 G5 notebook features a 14-inch Full HD display with a brightness of 1,000 nits and supports glove, rain, and wet-touch operations.
Growth of Mobility Solutions in Field Operations
Growing mobile workforce and remote operations increase the need for rugged smartphones, tablets, and panel PCs. These displays support field personnel in sectors like defense, energy, mining, and transportation. Their advanced connectivity, high brightness, and touch-screen features ensure reliable performance outdoors. Field teams rely on these devices for data access, communication, and navigation. Companies invest in rugged mobility to enhance productivity, safety, and operational continuity in unpredictable conditions, further fueling market expansion across regions with growing field-based activities.
Key Trends & Opportunities
Integration of Advanced Display Technologies
The adoption of high-resolution, sunlight-readable, and touch-sensitive screens is transforming the rugged display landscape. Manufacturers are integrating OLED and advanced LCD technologies to improve clarity and durability. Enhanced brightness and low power consumption make these displays suitable for outdoor and mission-critical use. Demand is also rising for multi-touch and glove-compatible interfaces. This shift creates opportunities for companies to offer advanced rugged solutions for aerospace, military, and industrial use cases, aligning with the growing need for superior visual performance.
- For instance, Zebra’s ET80 Rugged Tablet features a 12-inch 3:2 aspect ratio QHD display at 2160 × 1440 pixels, rated at 800 nits brightness for outdoor readability, and supports glove-touch, wet-touch and stylus input.
IoT and Connectivity Expansion
The growing integration of IoT and wireless connectivity enhances the functionality of rugged displays. Real-time data sharing between devices and central systems improves operational efficiency. Industries use connected rugged devices for remote monitoring, predictive maintenance, and location tracking. This trend creates new opportunities for vendors to offer smart rugged systems with integrated sensors and communication modules. Connectivity-driven solutions are especially gaining traction in defense, logistics, and energy sectors, where uninterrupted, secure data transmission is essential for operations.
- For instance, Samsung officially lists the Galaxy Tab Active5’s display as having up to 600 nits of brightness. This, combined with an enhanced outdoor visibility feature called Vision Booster, ensures clear readability in bright outdoor settings.
Rising Adoption in Public Safety and Healthcare
Public safety agencies and healthcare providers are increasingly deploying rugged displays for emergency response and mobile operations. These devices enable field communication, patient monitoring, and real-time coordination. Rugged tablets and panel PCs are preferred for their durability and performance in unpredictable conditions. Government investments in digital health and smart city projects further boost this demand. This expansion creates new market opportunities for rugged display manufacturers to develop application-specific, connected, and high-reliability solutions.
Key Challenges
High Product Cost and Maintenance
Rugged displays involve advanced components and specialized manufacturing processes, which increase costs compared to consumer-grade devices. High initial investments limit adoption in cost-sensitive sectors such as small enterprises and developing regions. Maintenance costs are also higher due to specialized parts and servicing requirements. This cost barrier restrains market growth despite the clear operational benefits, pushing vendors to focus on affordable solutions and scalable deployment models to widen their customer base.
Technological Integration and Compatibility Issues
Many industries face challenges in integrating rugged displays with legacy systems and existing IT infrastructure. Compatibility issues with software, communication protocols, or sensor networks often delay deployments. Upgrading entire systems to support rugged devices adds complexity and costs. These challenges can reduce operational efficiency and slow market adoption. To overcome this, manufacturers need to offer flexible, interoperable solutions that support seamless integration with modern and legacy environments across multiple industries.
Regional Analysis
North America
North America holds the largest market share of 36% in the rugged display market. The region benefits from strong demand in aerospace, defense, and industrial automation. Government defense programs and rapid adoption of advanced technologies drive steady growth. Companies invest in rugged panel PCs, handheld devices, and mission-critical display systems to enhance operational performance. High defense budgets, a well-established industrial base, and advanced manufacturing infrastructure support wider deployment. Growing mobility solutions in public safety and logistics sectors further strengthen the region’s leadership position in the global rugged display market.
Europe
Europe accounts for a 27% share of the rugged display market, supported by rising investments in defense modernization and industrial digitization. Countries such as Germany, France, and the U.K. lead deployments in aerospace, transportation, and manufacturing sectors. The region places strong emphasis on operational safety, equipment reliability, and field efficiency. Advancements in automotive technologies and smart manufacturing drive the demand for rugged tablets and panel PCs. Ongoing military programs and digital infrastructure investments further boost market adoption, strengthening Europe’s position as a key contributor to global revenue.
Asia Pacific
Asia Pacific holds a 22% share of the rugged display market and is the fastest-growing region. Strong industrial expansion in China, India, Japan, and South Korea fuels demand for rugged display systems across manufacturing, defense, and transportation. Government investments in military infrastructure and smart cities also support market growth. Local manufacturers are increasing production capacity, improving cost competitiveness and availability. Expanding logistics and construction activities further enhance the adoption of rugged handhelds and vehicle-mounted displays, making Asia Pacific a major driver of future market growth.
Latin America
Latin America represents 8% of the rugged display market, driven by increasing adoption in defense, transportation, and energy sectors. Countries such as Brazil and Mexico are investing in infrastructure modernization and military communication systems. Industrial expansion, combined with growing logistics operations, is creating steady demand for rugged tablets and panel PCs. While the region faces cost-related adoption barriers, improving connectivity and public safety initiatives are opening new opportunities. Increased involvement of global manufacturers is expected to boost the region’s rugged display deployment in the coming years.
Middle East & Africa
The Middle East & Africa account for a 7% share of the rugged display market. Defense and oil and gas industries are the primary growth drivers in this region. Governments are investing in rugged technologies for security operations, field monitoring, and industrial safety. Countries such as the UAE, Saudi Arabia, and South Africa are expanding smart infrastructure projects, increasing demand for rugged handhelds and mission-critical systems. Though adoption is slower compared to other regions, rising digital transformation efforts are expected to accelerate market penetration in the near future.
Market Segmentations:
By Level of Ruggedness:
- Ultra-Rugged
- Fully Rugged
By Application:
- Smartphone & Handheld Computer
- Tablet PC
By End User:
- Aerospace & Defense
- Automotive & Transportation
By Geography
- North America
- Europe
- Germany
- France
- U.K.
- Italy
- Spain
- Rest of Europe
- Asia Pacific
- China
- Japan
- India
- South Korea
- South-east Asia
- Rest of Asia Pacific
- Latin America
- Brazil
- Argentina
- Rest of Latin America
- Middle East & Africa
- GCC Countries
- South Africa
- Rest of the Middle East and Africa
Competitive Landscape
The rugged display market is shaped by strong competition among leading players including Panasonic Corporation, General Dynamics Corp., Sharp Corporation, AU Optronics Corp., Getac Technology Corp., Zebra Technologies Corp., LG Display Co., Ltd., BOE Technology Group Co., Ltd., Innolux Corporation, and Samsung Electronics Co., Ltd. The rugged display market is characterized by intense competition, rapid technological innovation, and growing specialization. Companies are focusing on developing advanced display technologies with superior durability, sunlight readability, and touch responsiveness to meet mission-critical operational needs. Strategic priorities include expanding product portfolios, integrating IoT capabilities, and enhancing connectivity for real-time data sharing. Manufacturers are investing in R&D to produce devices that can operate reliably in extreme environmental conditions. The market also sees increasing collaboration with defense, aerospace, transportation, and industrial sectors to address application-specific requirements. This strong focus on technology, performance, and reliability continues to shape the competitive landscape.
Key Player Analysis
- Panasonic Corporation
- General Dynamics Corp.
- Sharp Corporation
- AU Optronics Corp.
- Getac Technology Corp.
- Zebra Technologies Corp.
- LG Display Co., Ltd.
- BOE Technology Group Co., Ltd.
- Innolux Corporation
- Samsung Electronics Co., Ltd.
Recent Developments
- In June 2024, Panasonic Connect North America unveiled the enhanced TOUGHBOOK 40 Mk2, featuring Intel Core Ultra processors with up to 16 cores. The new model delivers up to 143% faster AI performance and 40% lower power consumption, benefiting law enforcement, federal agencies, and utility companies.
- In June 2024, LG Display began mass production of the industry’s first 13-inch Tandem OLED panel for laptops, offering double the lifespan, triple the brightness, and 40% reduced power consumption compared to conventional OLEDs. This innovative panel, featuring high resolution and enhanced touch sensitivity, is thinner, lighter, and ideal for high-performance IT devices, including AI laptops.
- In January 2024, BOE showcased cutting-edge display technologies, including smart automotive displays and over 50 innovative consumer electronics products in collaboration with global brands. BOE’s Automotive Ultra Large-Size Oxide Cockpit won the 2023-2024 Innovative Display Product Gold Award
- In January 2023, Hydro Electronic Devices unveiled its latest user interface displays, bolstering the rugged display industry. Available in 5”, 7”, 12”, and 15” sizes, these displays feature 1000 nit IPS panels, optically bonded AR lenses, and IP67 sealing, supporting both in-cab and external applications.
Shape Your Report to Specific Countries or Regions & Enjoy 30% Off!
Report Coverage
The research report offers an in-depth analysis based on Level of Ruggedness, Application, End-User and Geography. It details leading market players, providing an overview of their business, product offerings, investments, revenue streams, and key applications. Additionally, the report includes insights into the competitive environment, SWOT analysis, current market trends, as well as the primary drivers and constraints. Furthermore, it discusses various factors that have driven market expansion in recent years. The report also explores market dynamics, regulatory scenarios, and technological advancements that are shaping the industry. It assesses the impact of external factors and global economic changes on market growth. Lastly, it provides strategic recommendations for new entrants and established companies to navigate the complexities of the market.
Future Outlook
- The market will see rising adoption of rugged displays in defense and aerospace applications.
- Integration of advanced display technologies will improve durability and visual clarity.
- Industrial automation expansion will increase demand for rugged panel PCs and handhelds.
- IoT and connectivity solutions will enhance real-time data exchange and system control.
- Public safety and healthcare sectors will increasingly adopt rugged mobile devices.
- Manufacturers will focus on lightweight, high-brightness, and low power consumption designs.
- Regional investments in infrastructure and security will drive market penetration.
- Strategic partnerships will accelerate product innovation and customization.
- Cost optimization will enable wider adoption in cost-sensitive industries.
- Emerging markets will become key growth drivers with rising digital transformation.


