
Market Overview
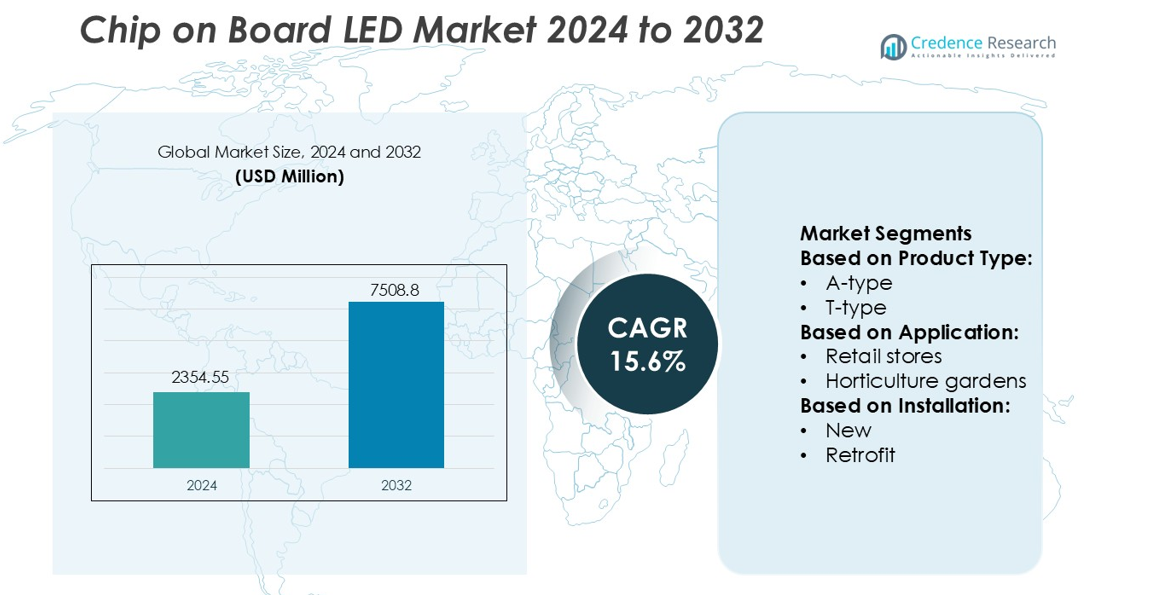
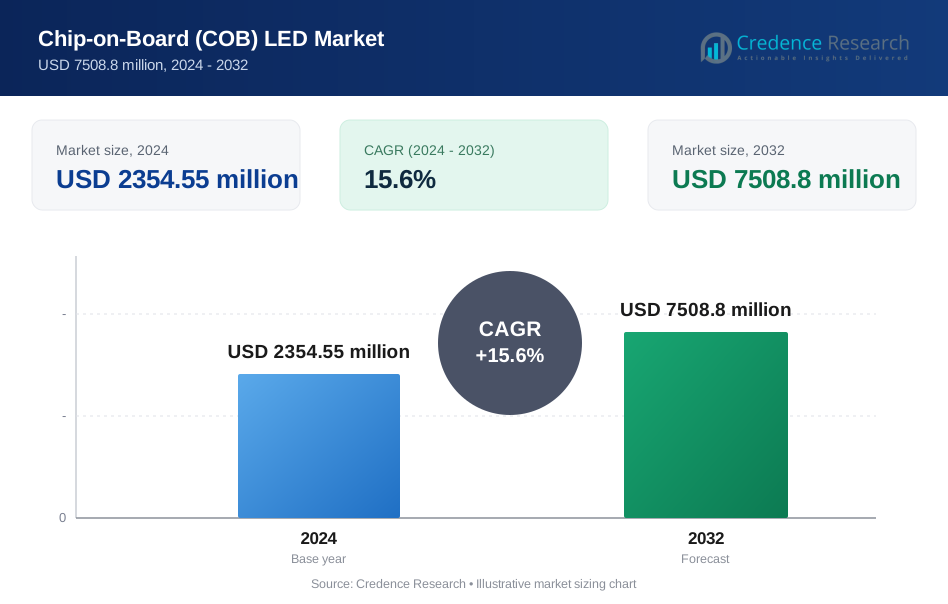
Chip on Board LED Market size was valued USD 2354.55 million in 2024 and is anticipated to reach USD 7508.8 million by 2032, at a CAGR of 15.6% during the forecast period.
| REPORT ATTRIBUTE | DETAILS |
|---|---|
| Historical Period | 2020-2023 |
| Base Year | 2024 |
| Forecast Period | 2025-2032 |
| Chip on Board LED Market Size 2024 | USD 2354.55 million |
| Chip on Board LED Market, CAGR | 15.6% |
| Chip on Board LED Market Size 2032 | USD 7508.8 million |
The Chip on Board (COB) LED market includes major participants such as Panasonic Corporation, Halonix Technologies Private Limited, Seoul Semiconductor Co., Ltd., Cree Lighting USA LLC, Nanoleaf, LSI Industries Inc., Dialight, Acuity Brands, Inc., Hubbell, and Savant Technologies LLC. These companies compete through advancements in high-lumen output, thermal efficiency, energy savings, and IoT-based lighting control. Product innovation focuses on smart lighting, architectural fixtures, outdoor installations, and compact automotive applications. Asia Pacific remains the dominant regional market, holding 38% share, supported by large-scale manufacturing, strong supply chains, and rapid adoption across commercial buildings, infrastructure, consumer electronics, and industrial facilities.
Market Insights
- The Chip on Board LED Market was valued at USD 2354.55 million in 2024 and is projected to reach USD 7508.8 million by 2032, growing at a CAGR of 15.6%.
- Demand grows due to longer operational life, high brightness, compact size, and the rising shift from traditional lighting to smart and energy-efficient solutions.
- Key players focus on high-lumen output, better heat control, wireless dimming, and IoT-based lighting, intensifying competitive innovation across commercial, outdoor, and automotive applications.
- High initial cost of COB modules and thermal management requirements act as restraints, especially for price-sensitive regions and small-scale buyers.
- Asia Pacific leads with 38% share, supported by strong manufacturing and electronics production, while luminaires represent the dominant segment due to large installations across commercial buildings, streets, malls, and smart infrastructure.
Market Segmentation Analysis:
By Product Type
Luminaires lead the Chip on Board (COB) LED market with the highest share due to strong adoption across commercial and residential spaces. Within luminaires, downlighting holds the dominant position because COB LEDs deliver high brightness, uniform illumination, and efficient thermal performance. Their compact structure supports slim fixture designs, which helps lighting brands target hotels, retail stores, offices, and public infrastructure projects. Demand rises further through smart lighting upgrades, decorative interior designs, and energy-efficiency mandates. Lamps such as A-type and T-type remain relevant in household replacements, but luminaires continue to outperform due to longer lifecycle, lower maintenance, and higher lumen output.
- For instance, Seoul Semiconductor’s “SunLike COB” series, such as part numbers within the SAWS1063A family (e.g., S4SM-1063xx9736-0B000G3S-00001), features a high color rendering index (CRI of 97 or higher) and a typical forward voltage of approximately 34.8 V when driven at the standard test current of around 0.29 A (290 mA).
By Application
Indoor lighting dominates the Chip on Board LED market and secures the largest share, driven by residential, commercial, office, and retail deployment. Downlights, panel lights, and track lights use COB LEDs to offer glare-free, uniform output and reduced heat generation. Commercial facilities prefer COB-based luminaires for product displays and focused beam control. Horticulture gardens also adopt COB LEDs because strong photosynthetic-active light enhances plant growth. Industrial units integrate them for warehouse and production hall illumination. Outdoor lighting, including streets, tunnels, and sports complexes, grows steadily, but indoor installations remain ahead due to renovation projects and rising smart home adoption.
- For instance, Dialight has deployed over a million industrial LED fixtures globally. Its Vigilant® High Bay luminaires, including models with up to 71,000 lumens at up to 155 lumens per watt, can achieve significant energy savings, with some applications reporting over 65% reduction in energy consumption compared to conventional lighting systems.
By Installation
New installations lead the Chip on Board LED market and hold the dominant share as construction of smart homes, commercial buildings, retail outlets, and industrial facilities increases. Developers select COB LEDs for long service life, easy integration with sensors, and high lumen efficiency. Hospitality and retail chains upgrade lighting to improve aesthetics, visibility, and energy savings. Retrofit projects also expand, especially in aging buildings and streetlight modernization programs. However, the pace of new construction and government guidelines for energy-efficient infrastructure allow new installations to stay ahead, supported by falling COB LED module costs and rapid fixture design innovation.
Key Growth Drivers
Rising Demand for High-Lumen Efficiency and Compact Lighting
Demand for compact, high-lumen lighting supports rapid COB LED adoption. Manufacturers focus on advanced chip-on-substrate designs, tight beam control, and improved heat transfer. COB modules provide strong color uniformity and brightness for retail, architectural, and industrial spaces. Energy efficiency rules and phase-outs of traditional lamps accelerate the shift. Automotive headlights, medical lighting, and commercial downlights prefer COB LEDs due to long lifespan and stable output. Growth continues as OEMs integrate COB modules with digital dimming and smart lighting controls.
- For instance, Hubbell’s Protecta X LED luminaire offers a system life exceeding 120,000 hours at 25 °C and claims 50% energy savings compared to fluorescent alternatives in field deployment.
Increasing Penetration of Smart and Connected Lighting Systems
Smart building projects fuel COB LED usage across offices, malls, and urban infrastructure. COB modules support IoT-enabled lighting with sensors, wireless controls, and automation. The segment benefits from rising adoption of human-centric lighting, daylight adaptation, and occupancy-based energy savings. Smart city plans emphasize LED streetlights with remote monitoring, fault alerts, and predictive maintenance. Manufacturers combine COB LEDs with Bluetooth Mesh, Zigbee, or Wi-Fi drivers to enhance functionality and lower operating costs. Rising retrofit activity also expands installations in old commercial properties.
- For instance, Aculux 5° Precision Spot delivers a high center beam candlepower (CBCP) of 32,000 from its 3-inch aperture. This high CBCP, combined with its ultra-narrow 5-degree beam, provides exceptional beam control for accent lighting in demanding environments, such as high-ceiling applications.
Growing Applications in Automotive and Industrial Lighting
Automotive OEMs adopt COB LEDs for low beam, high beam, and fog lamps due to strong lumen density and thermal stability. Compact modules enable sleek headlamp designs and enhanced road visibility. In factories and warehouses, COB high-bay fixtures improve illumination and lower maintenance. Industrial plants prefer COB-based floodlights for durability, vibration resistance, and long service life. Increasing EV production and autonomous vehicle development boost advanced lighting demand. Strong adoption across construction sites, airports, and sports arenas further accelerates market growth.
Key Trends & Opportunities
Rising Shift Toward Energy-Efficient and Sustainable Lighting
Global sustainability targets and energy-saving mandates drive LED replacement of halogen and HID lamps. COB systems reduce heat generation and power consumption, helping businesses cut electricity bills. Green building certifications favor LEDs due to lifespan and recyclable components. Lighting brands introduce eco-friendly substrates, lead-free designs, and modular fixtures. The trend creates opportunities for vendors offering low-carbon production, recyclable heat sinks, and smart-controlled energy tracking.
- For instance, LSI’s AirLink Blue system uses a Bluetooth mesh network has a maximum range of 150 feet between fixtures, ensuring reliable communication and scalability for large industrial applications.
Advancement in Thermal Management and Chip Packaging
Better heat dissipation enables higher lumen output and longer life. Manufacturers introduce ceramic substrates, copper-based PCBs, and vapor chamber cooling. Smaller chips with multi-emitter configurations enhance beam quality without increasing power draw. New phosphor coatings boost color accuracy for retail, studio, and healthcare applications. This trend encourages premium product launches and supports differentiated portfolios for lighting OEMs.
- For instance, Panasonic's circular plastics project has successfully resulted in the ability to recycle 17,000 tons of plastic per year via cascade recycling (recycling into different products) and 8,000 tons of plastic per year via horizontal recycling.
Growing Adoption of Human-Centric and Architectural Lighting
Premium homes, hotels, museums, and malls use COB LEDs for warm dimming, tunable white, and smooth color rendering. The technology enhances visual comfort, interior mood, and display aesthetics. Smart LEDs controlled via apps or voice assist boost customer appeal. Designers favor COB modules for glare-free spotlights and recessed downlights. The trend drives strong sales in luxury residential and hospitality lighting.
Key Challenges
High Cost of Advanced COB Modules and Drivers
Premium substrates, precise binning, and advanced thermal solutions increase production costs. Many price-sensitive buyers still prefer mid-power SMD LEDs. Smart COB fixtures require specialized drivers and control hardware, adding expense. In emerging markets, limited budgets slow transition to COB-based commercial lighting. Manufacturers aim to reduce costs through automation, mass production, and localized supply chains, but pricing remains a roadblock in large-scale retrofits.
Heat Concentration and Performance Degradation Risks
COB LEDs place multiple chips on a tight surface, increasing heat density. Poor thermal design can cause lumen drop, color shift, and shorter lifespan. Low-quality heat sinks or improper fixture design amplify the issue. Industrial and outdoor installations face higher failure risk without proper cooling. Vendors invest in ceramic boards, high-conductivity metals, and advanced optics, yet effective heat management remains a major engineering challenge for long-term reliability.
Regional Analysis
North America
North America holds 28% of the global COB LED market, driven by large commercial adoption and rapid replacement of legacy lighting. The United States leads due to rising smart city deployments, modernization of stadiums, and architectural lighting demand. Incentives for energy efficiency and sustainability accelerate sales across residential and industrial spaces. Strong presence of major lighting manufacturers and LED packaging companies supports continuous innovation in lumen output, heat dissipation, and color consistency. Commercial buildings, retail stores, and public infrastructure create a steady procurement pipeline. Expansion of IoT-based lighting control systems further increases COB LED integration in smart buildings.
Europe
Europe accounts for 25% of the global market, supported by strict energy-efficiency regulations, green building trends, and carbon-reduction mandates. Germany, the U.K., Italy, and France remain leading adopters, especially in retail, hospitality, and street lighting. Renovation of old lighting systems and expansion of commercial infrastructure keep demand stable. Lighting OEMs and semiconductor packaging companies in the region focus on premium and architectural-grade COB modules. Industrial and outdoor applications benefit from longer lifecycle and low maintenance. Growing smart city programs, EV charging infrastructure, railway stations, and airports maintain consumption of high-power COB lighting systems across Europe.
Asia Pacific
Asia Pacific dominates with 38% share, driven by strong manufacturing ecosystems, large-scale urban development, and high LED penetration in electronics. China, Japan, South Korea, and Taiwan serve as global manufacturing hubs for COB chips, substrates, drivers, and modules. Rapid construction of commercial complexes, smart factories, and public transport networks boosts installations. Consumer electronics brands adopt COB LEDs for backlighting, digital displays, and automotive lighting. Low-cost production and a robust supply chain improve export competitiveness. Government support for energy-saving lighting across streets, malls, and households fuels strong volume growth across developing economies in the region.
Latin America
Latin America holds 5% share of the COB LED market, driven by increasing adoption in commercial, public, and industrial lighting. Brazil and Mexico lead procurement due to smart city initiatives and modernization of airports, malls, and factories. Residential retrofitting grows gradually as consumers shift from halogen and fluorescent options to long-life LED systems. Price sensitivity and budget constraints slow adoption in certain markets, but partnerships with global LED brands improve affordability. Rising construction of retail spaces, hotels, and public infrastructure supports demand for high-brightness COB modules designed for outdoor and decorative lighting applications.
Middle East & Africa
The Middle East & Africa region represents 4% market share, supported by infrastructure expansion, tourism growth, and commercial real estate projects. UAE, Saudi Arabia, and Qatar adopt COB LEDs for premium architectural lighting in malls, hotels, stadiums, and smart city precincts. The technology performs well in high-temperature environments due to superior thermal efficiency and longer operational life. African markets grow steadily, led by urban development in South Africa, Kenya, and Nigeria. Increasing investments in airports, highways, and industrial parks provide opportunities for durable and energy-efficient lighting solutions.
Market Segmentations:
By Product Type:
- A-type
- T-type
By Application:
- Retail stores
- Horticulture gardens
By Installation:
- New
- Retrofit
By Geography
- North America
- U.S.
- Canada
- Mexico
- Europe
- Germany
- France
- U.K.
- Italy
- Spain
- Rest of Europe
- Asia Pacific
- China
- Japan
- India
- South Korea
- South-east Asia
- Rest of Asia Pacific
- Latin America
- Brazil
- Argentina
- Rest of Latin America
- Middle East & Africa
- GCC Countries
- South Africa
- Rest of the Middle East and Africa
Competitive Landscape
The competitive landscape of the Chip on Board (COB) LED market features major players such as Panasonic Corporation, Halonix Technologies Private Limited, Seoul Semiconductor Co., Ltd., Cree Lighting USA LLC, Nanoleaf, LSI Industries Inc., Dialight, Acuity Brands, Inc., Hubbell, and SAVANT TECHNOLOGIES LLC. The Chip on Board (COB) LED market is defined by continuous innovation in high-efficiency lighting modules, thermal management, and integrated control systems. Manufacturers focus on improving lumen output, color consistency, and heat dissipation to support demanding commercial, industrial, and architectural installations. Many companies are expanding portfolios to include smart, sensor-based, and IoT-enabled lighting that allows automation, remote monitoring, and energy optimization. Pricing remains competitive due to strong manufacturing capacity in Asia and rising global production. Market players also invest in mini-COB and micro-COB technology for compact fixtures, automotive lighting, and consumer electronics. Strategic partnerships with infrastructure developers, retail chains, and public agencies strengthen distribution, while sustainability drives adoption of recyclable materials and low-power consumption designs. Government regulations on energy efficiency further intensify competition, pushing suppliers to achieve longer operational life and enhanced performance. As smart city and commercial renovation projects expand worldwide, competitive rivalry is expected to increase.
Key Player Analysis
- Panasonic Corporation
- Halonix Technologies Private Limited
- Seoul Semiconductor Co., Ltd.
- Cree Lighting USA LLC
- Nanoleaf
- LSI Industries Inc.
- Dialight
- Acuity Brands, Inc.
- Hubbell
- SAVANT TECHNOLOGIES LLC
Recent Developments
- In February 2025, Cree LED launched the XLamp XP-L Photo Red S Line LEDs for horticulture it complements Cree LED’s COB portfolio strategy around application-optimized emitters used alongside COB modules in high-PAR luminaires.
- In October 2024, OSRAM, a leading provider of lighting technologies and solutions, announced the launch of a new LED lighting solution for outdoor and stadium applications. OSCONIQ® C 3030 provides exceptional intensity with thermal efficiency making it an attractive choice for several outdoor applications.
- In November 2024, CV28D LEDs with FusionBeam technology for signs/displays; although mid-power signage devices, this sat alongside Cree’s ongoing COB families for high-density lighting applications.
- In September 2024, FOHSE, a leading name in the horticulture science space, announced the launch of its PRO Series LED lighting technology. The new lighting technology is expected to revolutionize cannabis cultivation, and the product range features seven adjustable spectrum channels for all use cases
Report Coverage
The research report offers an in-depth analysis based on Product Type, Application, Installation and Geography. It details leading market players, providing an overview of their business, product offerings, investments, revenue streams, and key applications. Additionally, the report includes insights into the competitive environment, SWOT analysis, current market trends, as well as the primary drivers and constraints. Furthermore, it discusses various factors that have driven market expansion in recent years. The report also explores market dynamics, regulatory scenarios, and technological advancements that are shaping the industry. It assesses the impact of external factors and global economic changes on market growth. Lastly, it provides strategic recommendations for new entrants and established companies to navigate the complexities of the market.
Future Outlook
- The market will see wider adoption in smart homes, public infrastructure, and commercial spaces.
- Manufacturers will focus on improving heat management and lumen output for high-intensity applications.
- IoT-enabled lighting systems will gain strong traction across smart city projects.
- Mini-COB and micro-COB technologies will expand in automotive, displays, and compact fixtures.
- Demand for energy-efficient lighting will rise due to stricter global efficiency regulations.
- More companies will integrate wireless dimming, sensors, and automation into COB modules.
- Architectural and decorative lighting will adopt premium COB designs with better color rendering.
- Supply chain localization will increase as countries push domestic LED manufacturing.
- COB LEDs will replace traditional modules in stadiums, malls, airports, and industrial sites.
- Prices will continue to decline as production scales and packaging technology advances.
Request a Free Sample
Fill in your details and we'll send you a free sample report.
- Sample data tables & charts
- Research methodology
Need a Custom Version of This Report?
Tailor the scope, geography, or segments to your exact requirements.
- Custom geography or segment scope
- Direct access to our analyst team
Frequently Asked Questions
What is the current size of the global Chip-on-Board (COB) LED Market?
What is the expected growth rate of the Chip-on-Board (COB) LED Market between 2023 and 2030?
Which segment is leading the market share in terms of Applications?
What are the primary factors fueling the growth of the Chip on Board LED Market?
Which Thermal Management segment is expected to post the fastest growth rate during the forecast period?
Who are the leading companies in the Chip on Board LED Market?
Table of Content
Chapter 1. Report Introduction
- 1.1 Report Description & Purpose
- 1.1.1 Report Title & Market Definition
- 1.1.2 Unique Selling Propositions (USP) & Key Differentiators
- 1.1.3 Value Proposition for Stakeholders
- 1.2 Research Objectives
- 1.2.1 Market Sizing Objectives (Volume & Revenue) (Volume Where Applicable)
- 1.2.2 Segmentation Objectives
- 1.2.3 Competitive Intelligence Objectives
- 1.2.4 Forecast & Scenario Objectives
- 1.3 Report Scope
- 1.3.1 Chip-on-Board (COB) LED Scope – Segments & Subsegments Covered
- 1.3.2 Geographic Scope – Regions & Countries Covered
- 1.3.3 Historical Period, Base Year & Forecast Period (2024; forecast to 2032)
- 1.3.4 Inclusions & Exclusions
- 1.4 Industry Classification & Applicable Codes
- 1.5 Currency, Measurement Units & Valuation Basis
- 1.6 Target Stakeholders
- 1.7 Limitations & Assumptions
Chapter 2. Executive Summary
- 2.1 Global Chip-on-Board (COB) LED Market Snapshot
- 2.1.1 Market Size – Historical (2024) & Forecast (2024-2032) (2024: USD 2354.55 million → 2032: USD 7508.8 million)
- 2.1.2 Volume & Revenue – Global Totals (Volume Where Applicable)
- 2.1.3 Key Market Highlights – Top Five Facts
- 2.2 Chip-on-Board (COB) LED Market Segmentation Snapshot
- 2.2.1 Market Split by Region – 2024 vs. 2032
- 2.3 Competitive Snapshot
- 2.3.1 Top 10 Players by Revenue Share – 2024
- 2.3.2 Top 10 Players by Volume Share – 2024 (Volume Where Applicable)
- 2.3.3 Recent Strategic Developments (18-Month Summary)
- 2.4 Key Investment Highlights & Strategic Conclusions
Chapter 3. Chip-on-Board (COB) LED Market Dynamics & Industry Analysis
- 3.1 Market Overview & Context
- 3.1.1 Chip-on-Board (COB) LED Market Position in the Broader Industry Value Chain
- 3.1.2 Demand Structure & Purchasing Dynamics
- 3.1.3 Market Maturity & Development Stage by Region
- 3.2 Chip-on-Board (COB) LED Market Drivers
- 3.3 Chip-on-Board (COB) LED Market Restraints & Challenges
- 3.4 Chip-on-Board (COB) LED Market Opportunities
- 3.5 Porter's Five Forces Analysis
- 3.5.1 Threat of New Entrants
- 3.5.2 Bargaining Power of Suppliers
- 3.5.3 Bargaining Power of Buyers
- 3.5.4 Threat of Substitutes
- 3.5.5 Competitive Rivalry – Intensity Assessment
- 3.6 Chip-on-Board (COB) LED Value Chain Analysis
- 3.6.1 Upstream – Key Inputs, Resources & Suppliers
- 3.6.1.1 Key Input/Resource 1
- 3.6.1.2 Key Input/Resource 2
- 3.6.1.3 Key Input/Resource 3
- 3.6.2 Midstream – Core Operations & Value Creation
- 3.6.2.1 Operating Model & Process Overview
- 3.6.2.2 Key Operating Locations & Capabilities by Company
- 3.6.3 Downstream – Market Channels & End Users
- 3.6.3.1 Direct Sales & Customer Engagement Channels
- 3.6.3.2 Indirect Sales, Intermediaries & Partner Channels
- 3.6.4 Value Chain Profitability Analysis
- 3.6.1 Upstream – Key Inputs, Resources & Suppliers
- 3.7 PESTEL Analysis
- 3.7.1 Political Factors
- 3.7.2 Economic Factors
- 3.7.3 Social Factors
- 3.7.4 Technological Factors
- 3.7.5 Environmental Factors
- 3.7.6 Legal Factors
- 3.8 Chip-on-Board (COB) LED Supply Chain Analysis
- 3.8.1 Critical Input & Resource Availability Risk Assessment
- 3.8.2 Supplier & Operational Concentration Risk (Geographic Exposure)
- 3.8.3 Supply & Service Disruption Impact Analysis
- 3.9 Regulatory & Policy Landscape
Note: The regulatory and policy landscape section covers regulations based on their applicability to the market, Chip-on-Board (COB) LED category, geography, and scope of the study. Only regulatory frameworks with a material impact on operations, compliance, trade, sustainability, or market access are analyzed in detail.
Chapter 4. Key Investment Pockets & Opportunity Analysis
- 4.1 Chip-on-Board (COB) LED Market Attractiveness Analysis
- 4.1.1 By Region – Investment Attractiveness Matrix (Market Size × CAGR)
- 4.2 Absolute Revenue Growth Opportunity
- 4.2.1 By Region – Absolute Revenue Growth Through 2032
- 4.3 Incremental Demand Opportunity
- 4.3.1 By Region – Incremental Demand Through 2032
- 4.3.2 Segment – Incremental Demand
- 4.4 Emerging Submarket Opportunity Deep Dive (Subject to Applicability)
- 4.5 Priority Market Opportunity Scorecards
- 4.5.1 United States
- 4.5.2 Europe
- 4.5.3 Asia
- 4.5.4 Middle East & Africa
Note: Priority market opportunity scorecards reflect the geographic scope and strategic relevance of the study. Listed markets are indicative and may be adapted to the industry.
Chapter 5. Chip-on-Board (COB) LED Cross-Border Trade & Market Access Analysis
- 5.1 International Trade & Cross-Border Activity Overview
- 5.1.1 Global Export Value by Country (2024)
- 5.1.2 Global Export Volume by Country (2024) (Volume Where Applicable)
- 5.1.3 Global Import Value by Country (2024)
- 5.1.4 Global Import Volume by Country (2024) (Volume Where Applicable)
- 5.1.5 Net Trade Balance by Country (2024)
- 5.2 Export Analysis – Segment
- 5.2.1 Category 1 (Applicable Classification Code)
- 5.2.2 Category 2 (Applicable Classification Code)
- 5.2.3 Category 3 (Applicable Classification Code)
- 5.2.4 Category 4 (Applicable Classification Code)
- 5.2.5 Category 5 (Applicable Classification Code)
- 5.3 Import Analysis – Segment
- 5.3.1 Category 1 (Applicable Classification Code)
- 5.3.2 Category 2 (Applicable Classification Code)
- 5.3.3 Category 3 (Applicable Classification Code)
- 5.3.4 Category 4 (Applicable Classification Code)
- 5.3.5 Category 5 (Applicable Classification Code)
- 5.4 Cross-Border Pricing & Transaction Benchmarks
- 5.4.1 Export Pricing – Segment & Country
- 5.4.2 Import Pricing – Segment & Source Country
- 5.4.3 Price Trends (2024)
- 5.5 Key Cross-Border Trade & Delivery Routes
- 5.5.1 Cross-Border Trade/Delivery Route 1
- 5.5.2 Cross-Border Trade/Delivery Route 2
- 5.5.3 Cross-Border Trade/Delivery Route 3
- 5.5.4 Cross-Border Trade/Delivery Route 4
- 5.5.5 Cross-Border Trade/Delivery Route 5
- 5.6 Trade Policy & Market Access Impact Assessment
- 5.6.1 Tariff & Non-Tariff Barriers
- 5.6.2 Regional Trade & Economic Integration Frameworks
- 5.6.3 Bilateral & Multilateral Trade Agreements
- 5.6.4 Cross-Border Operating, Licensing & Localization Requirements
Note: This chapter applies where cross-border trade or delivery is relevant to Chip-on-Board (COB) LED. Goods, services, and digital offerings are assessed using applicable classifications and transaction measures. Import-export volumes, trade balances, and route analyses are included only where meaningful to the market.
Chapter 6. Competitive Landscape & Company Benchmarking
- 6.1 Chip-on-Board (COB) LED Market Concentration & Structure
- 6.1.1 Herfindahl-Hirschman Index (HHI) – vs. 2024
- 6.1.2 Leading, Mid-Sized & Emerging Player Structure
- 6.1.3 Global, Regional & Local Player Dynamics
- 6.2 Chip-on-Board (COB) LED Market Share Analysis – 2024
- 6.2.1 Global Revenue Share by Company
- 6.2.2 Global Volume Share by Company (Volume Where Applicable)
- 6.2.3 Regional Revenue Share
- 6.2.4 Market Share Evolution ( vs. 2024)
- 6.2.5 Company Market Share by Key Segment
- 6.2.6 Company Market Share by Customer Group
- 6.3 Operating Scale, Capacity & Infrastructure Analysis
- 6.3.1 Global Operating Scale & Supply Capacity
- 6.3.2 Resource Utilization & Operating Efficiency
- 6.3.3 Output, Service Delivery & Activity Metrics
- 6.3.4 Operating Footprint & Infrastructure Map
- 6.3.5 Planned Operational & Capacity Expansion
- 6.4 Chip-on-Board (COB) LED Competitive Benchmarking Matrix
- 6.4.1 Revenue, Growth, Profitability & Operating Metric Comparison
- 6.4.2 Channel Revenue Mix
- 6.4.3 Geographic Revenue Exposure
- 6.4.4 R&D Intensity
- 6.4.5 Sustainability Maturity
- 6.5 Strategic Developments in Chip-on-Board (COB) LED (Last 24 Months)
- 6.5.1 Mergers, Acquisitions & Divestments
- 6.5.2 New Products, Services & Solutions in Chip-on-Board (COB) LED
- 6.5.3 Operational & Infrastructure Expansions
- 6.5.4 Strategic Alliances, Joint Ventures & Partnerships
- 6.5.5 Distribution Expansion & Market Entry
- 6.5.6 Sustainability & ESG Initiatives
- 6.6 Competitive Strategy Mapping
- 6.6.1 Leader, Challenger, Follower & Niche Classification
- 6.6.2 Pricing Strategy Comparison
- 6.6.3 Channel Strategy Matrix
Note: Strategic developments are included based on their materiality and the availability of reliable information.
Chapter 7. Global Chip-on-Board (COB) LED Market – By Sales & Delivery Channel
- 7.1 Segment Overview
- 7.1.1 Volume & Revenue Split by Channel (2024 & 2032) (Volume Where Applicable)
- 7.1.2 Channel Mix Evolution (2024-2032)
Chapter 8. Regional Market Analysis – Global Overview
- 8.1 Global Regional Overview
- 8.1.1 Regional Volume Share (Volume Where Applicable)
- 8.1.2 Regional Revenue Share
- 8.1.3 Regional Volume by Region (Volume Where Applicable)
- 8.1.4 Regional Revenue by Region
- 8.1.5 Regional Forecast Through 2032
- 8.2 Cross-Regional Segment Analysis
- 8.2.1 By Sales & Delivery Channel
- 8.2.2 By Competitive Positioning & Price Tier
Chapter 9. North America Chip-on-Board (COB) LED Market
- 9.1 United States
- 9.2 Canada
- 9.3 Mexico
Chapter 10. Europe Chip-on-Board (COB) LED Market
- 10.1 Germany
- 10.2 France
- 10.3 Italy
- 10.4 United Kingdom
- 10.5 Spain
- 10.6 Poland
- 10.7 Russia
- 10.8 Netherlands
- 10.9 Belgium
- 10.10 Sweden
- 10.11 Denmark
- 10.12 Norway
- 10.13 Rest of Europe
Chapter 11. Asia Pacific Chip-on-Board (COB) LED Market
- 11.1 China
- 11.2 India
- 11.3 Japan
- 11.4 South Korea
- 11.5 Thailand
- 11.6 Indonesia
- 11.7 Vietnam
- 11.8 Malaysia
- 11.9 Australia
- 11.10 Rest of Asia Pacific
Chapter 12. Latin America Chip-on-Board (COB) LED Market
- 12.1 Brazil
- 12.2 Argentina
- 12.3 Colombia
- 12.4 Chile
- 12.5 Rest of Latin America
Chapter 13. Middle East Chip-on-Board (COB) LED Market
- 13.1 Saudi Arabia
- 13.2 United Arab Emirates
- 13.3 Turkey
- 13.4 Israel
- 13.5 Iran
- 13.6 Rest of the Middle East
Chapter 14. Africa Chip-on-Board (COB) LED Market
- 14.1 South Africa
- 14.2 Egypt
- 14.3 Nigeria
- 14.4 Morocco
- 14.5 Rest of Africa
Chapter 15. Chip-on-Board (COB) LED Company Profiles
- 15.1 [Company 01]
- 15.1.1 Company Overview
- 15.1.2 Key Management Personnel
- 15.1.3 Products & Services Portfolio
- 15.1.4 Financial Performance
- 15.1.5 Key Market Focus & Geographic Presence
- 15.1.6 Recent Developments & Strategic Initiatives
Note: The company profile list is preliminary and may change based on research findings, market developments, data availability, and client requirements.
Chapter 16. Appendices
- Appendix A – List of Abbreviations & Acronyms
- Appendix B – Industry Classification Code Reference – Full Series
- Appendix C – Supply, Output & Operating Capacity Data Tables
- Appendix D – End-Use & Demand Base Tables
- Appendix E – Demand, Adoption & Usage Assumptions
- Appendix F – Pricing & Revenue Metric Reference Tables
- Appendix G – Company Operations & Infrastructure Database
- Appendix H – Cross-Border Trade & Activity Data Tables (Where Applicable)
- Appendix I – Regulatory Summary Tables
- Appendix J – Primary Research Participant List (Anonymized)
- Appendix K – Primary Research Questionnaire Framework
- Appendix L – Data Sources & Bibliography
- Appendix M – Market Size Divergence & Source Comparison
Chapter 17. Research Methodology
- 17.1 Research Framework & Philosophy
- 17.2 Secondary Research – Sources, Hierarchy & Data Extraction
- 17.3 Data Modeling – Bottom-Up & Top-Down Market Sizing
- 17.4 Primary Research – Stakeholder Framework, LOI & Sample Sizes
- 17.5 Forecast Methodology – Regression, Scenario & Sensitivity Analysis
- 17.6 Quality Control – Four-Layer Validation Framework
- 17.7 Limitations & Standard Assumptions
- 17.8 Disclaimer
