Market Overview
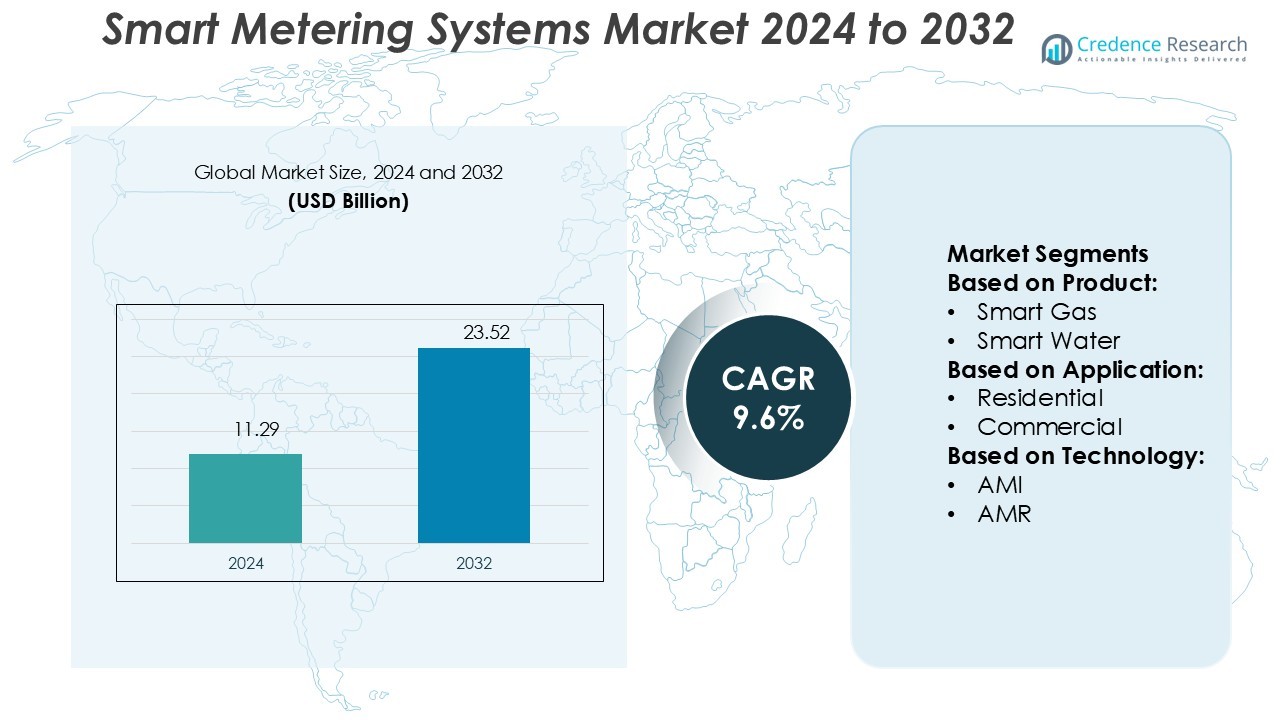
Smart Metering Systems Market size was valued USD 11.29 billion in 2024 and is anticipated to reach USD 23.52 billion by 2032, at a CAGR of 9.6% during the forecast period.
| REPORT ATTRIBUTE |
DETAILS |
| Historical Period |
2020-2023 |
| Base Year |
2024 |
| Forecast Period |
2025-2032 |
| Smart Metering Systems Market Size 2024 |
USD 11.29 Billion |
| Smart Metering Systems Market, CAGR |
9.6% |
| Smart Metering Systems Market Size 2032 |
USD 23.52 Billion |
The Smart Metering Systems Market is shaped by top players including Honeywell International, Inc., Aclara Technologies LLC, General Electric, ARAD Group, Itron, Inc., Chint Group, ABB, Badger Meter, Inc., AEM, and B Meters Metering Solutions. These companies compete by leveraging advanced metering infrastructure, IoT integration, and cloud-based platforms to enhance accuracy, connectivity, and efficiency across electricity, water, and gas applications. Innovation in predictive analytics, cybersecurity, and consumer engagement tools further strengthens their positions. Regionally, Asia-Pacific leads the market with a commanding 34% share, supported by large-scale government initiatives, rapid urbanization, and strong investments in renewable energy integration, positioning it as the fastest-growing region in the global landscape.
Access crucial information at unmatched prices!
Request your sample report today & start making informed decisions powered by Credence Research Inc.!
Download Sample
Market Insights
- The Smart Metering Systems Market size reached USD 11.29 billion in 2024 and is projected to hit USD 23.52 billion by 2032, expanding at a CAGR of 9.6%.
- Rising demand for energy efficiency, real-time monitoring, and regulatory mandates are driving adoption across electricity, water, and gas metering applications.
- Key players such as Honeywell International, Itron, ABB, and General Electric compete through innovations in AMI, IoT, cloud platforms, and predictive analytics, strengthening global presence.
- High installation and infrastructure costs, along with cybersecurity and data privacy concerns, remain major restraints for wider deployment.
- Asia-Pacific leads with 34% market share, while North America holds 32% and Europe captures 29%, with electricity metering emerging as the dominant segment supported by strong smart grid investments.
Market Segmentation Analysis:
By Product
In the smart metering systems market, smart electric meters dominate with the largest share, holding over 55% of the segment. Their adoption is driven by rising electricity demand, renewable energy integration, and grid modernization initiatives. Utilities prefer smart electric meters for real-time monitoring, efficient load management, and improved billing accuracy. Government mandates in developed markets and large-scale rollouts in emerging economies strengthen this position. In comparison, smart gas and smart water meters are growing steadily, supported by increasing focus on resource conservation and infrastructure upgrades in urban and industrial areas.
- For instance, Aclara won a major contract to supply 3.9 million smart meters to utilities serving parts of New York City, Westchester, and Orange & Rockland Counties, using its AclaraConnect™ RF network for two-way communications and remote outage detection.
By Application
The residential segment leads the smart metering systems market with more than 45% share, reflecting widespread deployment of electric and water meters in households. Key drivers include government-backed energy efficiency programs, consumer demand for usage transparency, and the need for accurate billing. Commercial and utility segments also show strong growth, particularly in industrial clusters and large-scale public infrastructure projects. Rising urbanization and smart city initiatives continue to accelerate adoption across non-residential sectors, but residential end-users remain the largest contributors due to high installation volume and cost-saving benefits.
- For instance, Itron’s Meter Integration Services have a proven track record, having been used for integrating over 40 million smart meters from more than 10 vendors and across 50 meter types.
By Technology
Advanced Metering Infrastructure (AMI) dominates the technology segment with over 60% share, surpassing Automated Meter Reading (AMR). AMI enables two-way communication, remote monitoring, and advanced analytics, offering utilities greater control over energy distribution and outage management. Its dominance is reinforced by large-scale smart grid deployments and increasing demand for data-driven energy management solutions. AMR remains relevant in regions with early-stage adoption, where cost efficiency is prioritized over advanced functionality. However, the shift toward AMI is expected to accelerate, driven by regulatory support and the growing need for integrated energy efficiency solutions.
Key Growth Drivers
Rising Demand for Energy Efficiency
The push for energy efficiency drives adoption of smart metering systems. Governments and utilities promote real-time monitoring to optimize consumption and reduce energy losses. These systems empower consumers with detailed insights, helping to lower bills and shift to sustainable usage. Policies supporting renewable integration also rely on advanced metering to balance supply and demand. Growing environmental awareness accelerates household and business adoption. The ability to reduce peak load and improve grid stability makes energy efficiency the strongest growth catalyst for smart metering systems globally.
- For instance, CHINT introduced a new DLMS GCP-compliant meter (CHS320) in collaboration with Itron, embedding Gen5 NIC connectivity and supporting multi-vendor interoperability across 40 million meters globally.
Government Regulations and Smart Grid Initiatives
Government mandates and investment in smart grid infrastructure fuel market growth. Many countries enforce strict policies for modernizing traditional grids to support renewable integration. Utilities implement smart meters to comply with national targets for carbon reduction and digitalization. Subsidies and funding further ease large-scale rollouts across residential, commercial, and utility sectors. For example, EU and U.S. programs actively support nationwide deployments, enhancing interoperability and security standards. Such regulations ensure widespread implementation, strengthening the market’s long-term expansion.
- For instance, ABB supports integration with over 300 third-party brands across smart meters, inverters, EV chargers, and energy storage devices.
Technological Advancements and IoT Integration
Advances in IoT, cloud analytics, and communication protocols boost adoption of smart metering systems. Modern meters now support automated meter reading (AMR) and advanced metering infrastructure (AMI) with enhanced accuracy and scalability. Utilities benefit from predictive maintenance and automated billing solutions, reducing operational costs. Integration with mobile apps improves consumer engagement through usage alerts and energy-saving recommendations. 5G and low-power wide-area networks (LPWAN) expand coverage for smart grids, enabling real-time data exchange. These innovations position smart metering as a central element in future energy ecosystems.
Key Trends & Opportunities
Shift Toward Renewable Energy Integration
The transition to renewable energy creates opportunities for smart metering systems. Distributed energy resources, such as solar rooftops and wind farms, require accurate data management for grid balancing. Smart meters enable two-way communication, supporting net metering and demand response programs. This trend encourages utilities to expand AMI deployment, ensuring seamless integration of intermittent energy sources. The growing global push toward carbon neutrality further strengthens this opportunity.
- For instance, Badger Meter’s ORION® Cellular endpoint delivers 15-minute interval usage data over LTE-M networks, eliminating the need for a utility-owned network. This technology is used for advanced water metering analytics, providing high-resolution data to water utilities.
Growing Adoption in Water and Gas Metering
Beyond electricity, smart metering systems in water and gas utilities are gaining momentum. Rising water scarcity pushes utilities to adopt smart water meters for leakage detection and conservation. Gas companies adopt smart meters to improve safety and reduce theft. These sectors offer untapped growth opportunities, as adoption rates lag behind electricity. Increased focus on resource management in developing economies will accelerate deployment.
- For instance, the company’s production exceeds 2.2 million meters per year, supplying more than 90 countries. Their product range includes a smart ultrasonic and digital meters, thermal energy meters, and remote reading systems via LoRaWAN or Wireless M-Bus.
Data Analytics and Consumer Engagement Opportunities
The surge in big data analytics offers utilities new revenue streams. Smart meters generate detailed consumption data, which can be monetized through value-added services. Utilities leverage analytics to segment customers, design dynamic pricing, and forecast demand patterns. Consumers benefit from personalized insights, loyalty programs, and energy-saving recommendations. This shift transforms smart metering from a utility tool into a customer-centric platform.
Key Challenges
High Installation and Infrastructure Costs
Smart metering projects require significant investment in devices, software, and communication networks. Developing economies face financial constraints, slowing rollout. Even in developed nations, cost recovery remains a concern for utilities and governments. Upfront costs for hardware and maintenance create resistance among stakeholders. Despite long-term savings, high capital expenditure remains a major barrier to widespread adoption.
Cybersecurity and Data Privacy Concerns
Smart metering systems handle sensitive consumption and billing data, raising cybersecurity challenges. Utilities must protect networks against hacking, fraud, and unauthorized access. Data privacy concerns also limit consumer trust, particularly in regions with weak regulatory frameworks. Breaches could disrupt billing, expose personal information, or destabilize energy distribution. Ensuring secure communication protocols and compliance with privacy laws is essential to sustain adoption.
Regional Analysis
North America
North America holds a 32% share of the smart metering systems market, driven by extensive government mandates and advanced grid infrastructure. The U.S. leads adoption through large-scale deployment programs supported by the Department of Energy and utility investments. Canada follows with strong integration of renewable sources requiring smart grid support. The region benefits from advanced communication networks and high consumer awareness, boosting AMI installations. Increasing demand for real-time monitoring, coupled with strong regulatory frameworks, sustains the region’s leadership. Continuous investment in smart city projects further strengthens adoption across residential and commercial segments.
Europe
Europe accounts for 29% of the global smart metering systems market, supported by strict EU regulations and climate goals. Countries like Italy, France, and the UK lead installations, while Germany is accelerating rollouts under its energy transition plan. The EU’s mandate for near-universal smart meter coverage by 2030 ensures long-term growth. Utilities in the region prioritize grid stability and renewable integration, driving AMI adoption. High consumer participation in demand response programs also supports growth. Continuous government incentives and advanced interoperability standards reinforce Europe’s strong position in the global market.
Asia-Pacific
Asia-Pacific dominates with a 34% share, driven by large-scale installations in China, Japan, South Korea, and India. China leads with massive rollouts supported by state-driven smart grid initiatives, while Japan emphasizes resilience through disaster-proof energy systems. India is scaling adoption under government-led modernization projects, supported by international funding. Rising urbanization and energy demand create strong growth potential across the region. Increasing renewable energy integration further accelerates adoption of AMI solutions. With its large population base and supportive policies, Asia-Pacific remains the fastest-growing region in the global smart metering systems market.
Latin America
Latin America captures a 3% share of the smart metering systems market, with Brazil and Mexico leading adoption. Government programs promoting energy efficiency and loss reduction are key growth drivers. Utilities face challenges with electricity theft and distribution inefficiencies, making smart meters an effective solution. International investments and pilot projects continue to expand across urban centers. However, high deployment costs and regulatory hurdles limit widespread adoption in smaller economies. Despite these challenges, increasing urbanization and modernization initiatives support steady growth, positioning Latin America as an emerging opportunity for market players.
Middle East & Africa
The Middle East & Africa region holds a 2% share, with gradual adoption driven by modernization projects in Gulf countries and South Africa. Governments in Saudi Arabia and the UAE invest in smart grid technologies to enhance energy efficiency and diversify from oil dependency. South Africa focuses on reducing electricity theft and improving grid reliability through pilot deployments. Limited financial resources and infrastructure gaps constrain large-scale rollouts in other African nations. However, rising renewable energy projects and smart city initiatives present growth opportunities, making the region a promising long-term market for smart metering systems.
Market Segmentations:
By Product:
By Application:
By Technology:
By Geography
- North America
- Europe
- Germany
- France
- U.K.
- Italy
- Spain
- Rest of Europe
- Asia Pacific
- China
- Japan
- India
- South Korea
- South-east Asia
- Rest of Asia Pacific
- Latin America
- Brazil
- Argentina
- Rest of Latin America
- Middle East & Africa
- GCC Countries
- South Africa
- Rest of the Middle East and Africa
Competitive Landscape
The competitive landscape of the Smart Metering Systems Market features prominent players such as Honeywell International, Inc., Aclara Technologies LLC, General Electric, ARAD Group, Itron, Inc., Chint Group, ABB, Badger Meter, Inc., AEM, and B Meters Metering Solutions. The competitive landscape of the Smart Metering Systems Market is characterized by strong innovation, strategic collaborations, and large-scale deployment initiatives across electricity, water, and gas metering segments. Companies focus heavily on integrating IoT, cloud platforms, and advanced analytics to deliver real-time monitoring, automated billing, and predictive maintenance solutions. Investments in smart grid infrastructure and renewable energy integration further intensify competition, with market participants prioritizing interoperability, security, and scalability. Growing demand for leak detection in water management, dynamic pricing in energy distribution, and theft reduction in utilities drives continuous product development. Regional expansion strategies, particularly in Asia-Pacific and Europe, highlight the push for wider adoption, while emerging economies present untapped growth opportunities. Overall, the market remains highly competitive, shaped by rapid technological advancements and increasing emphasis on energy efficiency.
Shape Your Report to Specific Countries or Regions & Enjoy 30% Off!
Key Player Analysis
Recent Developments
- In June 2025, Itron, Inc. signed a contract with Hellenic Electricity Distribution Network Operator (HEDNO) to deploy grid edge solutions in Greece. The project includes managing with Itron’s Meter Data Management system and overseeing nearly 1 million new narrowband-IoT smart meters from ZIV Automation via Utility IQ. Itron’s strong financial health supports this large-scale deployment.
- In March 2025, Netmore Group, a leading global operator of IoT networks, announced the availability of Metering-as-a-Service (MaaS) for water and gas utilities. Offering an option for utilities to redirect their focus from meter-related concerns to critical sustainability and efficiency issues, Netmore’s Metering-as-a-Service delivers a hassle-free, fully managed, turnkey AMI solution.
- In February 2025, LAISON launched a pilot project in Indonesia to upgrade existing mechanical water meters with its innovative Meter Interface Unit (MIU). LAISON Meter Interface Unit (MIU) is an innovative solution designed to retrofit traditional mechanical water meters with pulse outputs into a smart meter.
- In September 2024, Metron, the global leader in cellular-based smart metering and water intelligence, launched two exciting new products: WaterScope™ Utility, an advanced analytics app streamlining frontline operations across complex municipal water systems.
Report Coverage
The research report offers an in-depth analysis based on Product, Application, Technology and Geography. It details leading market players, providing an overview of their business, product offerings, investments, revenue streams, and key applications. Additionally, the report includes insights into the competitive environment, SWOT analysis, current market trends, as well as the primary drivers and constraints. Furthermore, it discusses various factors that have driven market expansion in recent years. The report also explores market dynamics, regulatory scenarios, and technological advancements that are shaping the industry. It assesses the impact of external factors and global economic changes on market growth. Lastly, it provides strategic recommendations for new entrants and established companies to navigate the complexities of the market.
Future Outlook
- The market will expand with rising adoption of advanced metering infrastructure across utilities.
- Integration of IoT and cloud platforms will enhance real-time data collection and analytics.
- Renewable energy growth will boost demand for two-way communication in smart meters.
- Governments will continue driving deployments through regulations and supportive policies.
- Consumer demand for energy efficiency will increase adoption in residential and commercial sectors.
- Cybersecurity solutions will gain importance to safeguard metering networks and data privacy.
- Smart water and gas metering adoption will accelerate in regions facing resource challenges.
- Emerging economies will create growth opportunities through modernization and urbanization initiatives.
- Mobile applications and digital platforms will improve consumer engagement and energy management.
- Partnerships between utilities and technology providers will strengthen large-scale deployment projects.


