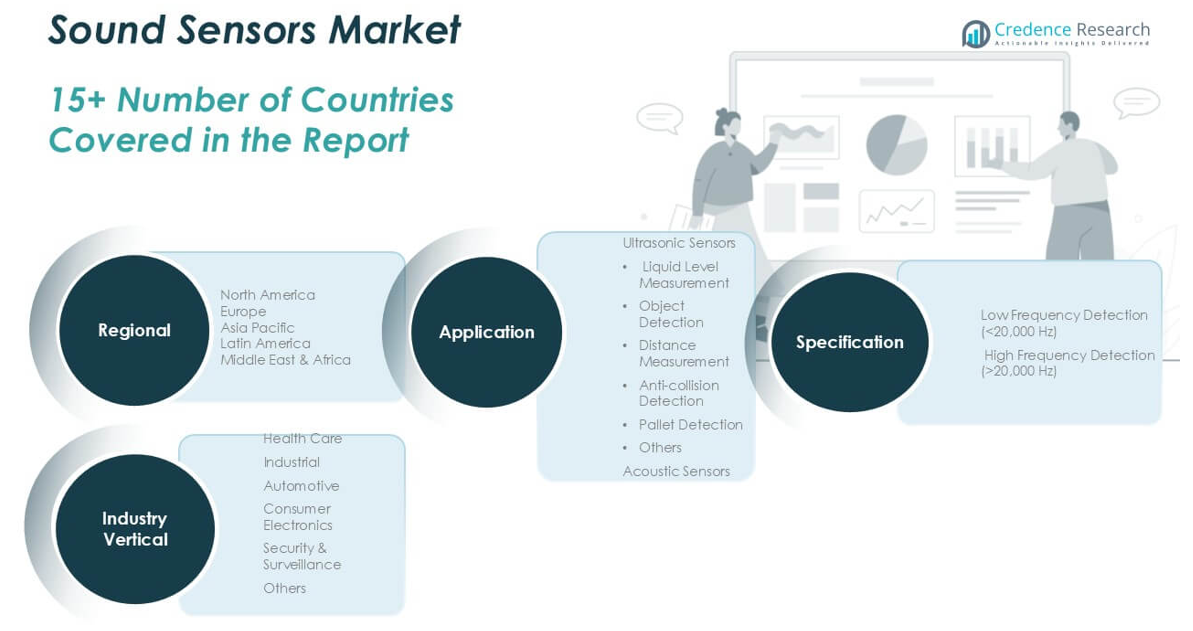
Sound Sensors Market By Type (Surface Acoustic Wave (SAW) Sensor, Bulk Acoustic Wave (BAW) Sensor), By Application (Automotive, Healthcare, Aerospace & Defense, Manufacturing & Processing, Consumer Electronics), By Sensing Parameters (Temperature, Torque, Pressure, Mass, Humidity, Viscosity, Chemical Vapor) – Growth, Share, Opportunities & Competitive Analysis, 2018 – 2026

Price: $3699

Published: | Report ID: 9426 | Report Format : PDF

Industry Outlook

Sound sensors are simple transducers that are used to measure physical parameters such as acoustics or surface vibrations. These sound sensors are also used to measure or sense different physical parameters such as pressure, temperature, humidity, viscosity, torque, mass, and chemical vapor. These sensors are extensive across several end-user applications and provide feedback to the centralized system. Based on the feedback, the centralized command system will undertake proportional action in order to maintain the sanity of the system. Consequently, sound sensors have become a critical part of any industry as well as domestic automation. Furthermore, rapid evolution in the telecommunications sector is also encouraging the demand for sound sensors.

Design Element 2

Access crucial information at unmatched prices!

Request your free sample report today & start making informed decisions powered by Credence Research!

Download Free Sample

CTA Design Element 3

Market Synopsis

The expansion of the automotive industry provided strong support for the growth of the sound sensor market.

Following the economic downturn, the automotive industry has emerged as one of the most robust sectors in terms of market growth. Consumers’ increasing purchasing power in Asia Pacific’s developing regions enabled automakers to introduce more sophisticated and advanced vehicles loaded with features. This certainly stimulated the demand for sound sensors in the automotive sector, and therefore, automotive applications emerged as the biggest consumers of sound sensors, among other applications. Healthcare is still in its early stages, but it is a strong contender for automotive applications. The use of sound sensors in medical and healthcare devices has been a common practice for the past few years, and the proliferation of sensors in future devices is helping healthcare applications gain top spots among other applications.

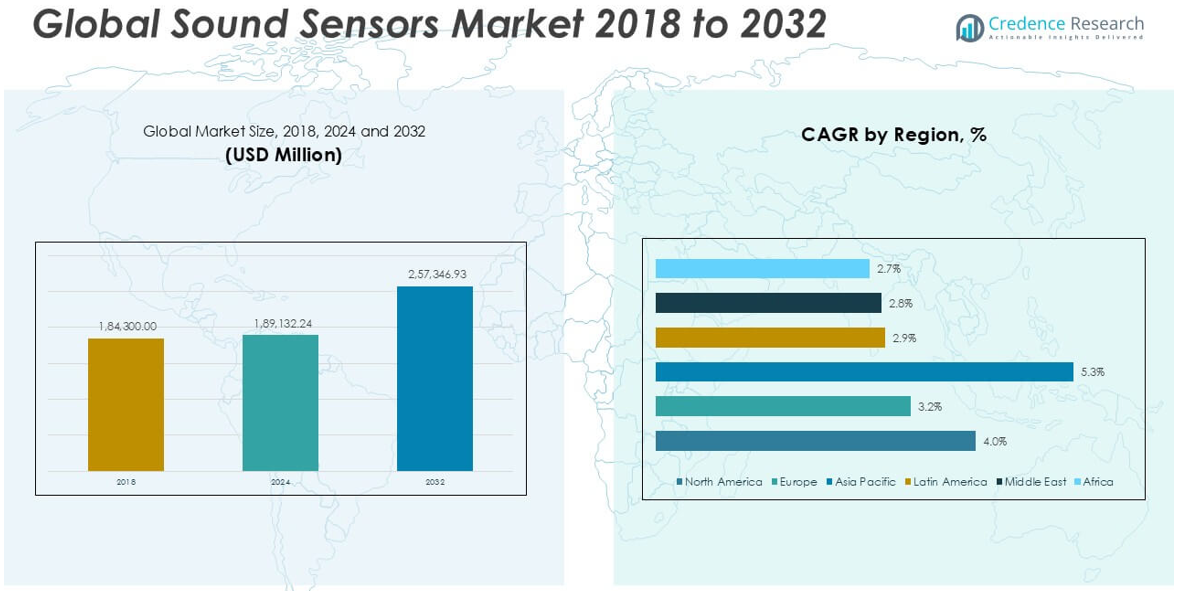
Asia Pacific is expected to overtake North America in the global sound sensor market.

At present, North America is at the center of global automation and smart devices, which has therefore encouraged the demand for sound sensors in this particular region. The region is home to some of the major sound sensor manufacturers and has a high acceptance rate for new technology. Consequently, North America emerged as the global leader in the sound sensor market. However, automation is changing the face of industrial manufacturing and processing and other end-user applications in the Asia Pacific.

Such radical changes are encouraging the demand for sound sensors in Asia and the Pacific. Furthermore, rising consumer economic capability and spending power have increased demand for smart devices, smart automotive, and consumer electronics. All these factors are contributing to the growing sound sensor market in Asia Pacific and are expected to overtake the market in North America during the forecast period from 2018 to 2026.

Shape Your Report to Specific Countries or Regions & Enjoy 30% Off!

Market Segmentation

Competitive Landscape

The research study covers some of the leading sound sensor manufacturers, including Honeywell International Inc., Epson Toyocom Corporation, Panasonic Corporation, Teledyne Microwave Solutions, API Technologies Corp., Boston Piezo-Optics Inc., Phonon Corporation, CTS Corporation, Vectron International, and CeramTec. The sound sensor market is highly fragmented, with several local as well as international players contributing to the overall market value. Major sound sensor manufacturers are coming up with business strategies in order to maintain their market position without compromising on their profit share.

Strategies such as the miniaturization of sound sensors and boosting the accuracy and precision of their products are top priorities for several international players. Furthermore, these companies’ primary strategy is to expand their geographical presence by entering developing markets. However, the simplicity of the device and low cost of production attracted several small companies to enter the market to claim their share. The market is expected to become highly competitive in the coming years.

1. Preface
1.1. Report Description
1.1.1. Purpose of the Report
1.1.2. Target Audience
1.1.3. USP and Key Offerings
1.2. Research Scope
1.3. Research Methodology
1.3.1. Phase I-Secondary Research
1.3.2. Phase II-Primary Research
1.3.3. Approach Adopted
1.3.4. Top-Down Approach
1.3.5. Bottom-Up Approach
1.3.6. Phase III-Expert Panel Review
1.3.7. Assumptions
1.4. Market Segmentation

2. Executive Summary
2.1. Global SS Market Snapshot
2.2. Global SS Market, by Type
2.3. Global SS Market, by Application
2.4. Global SS Market, by Sensing Parameters
2.5. Global SS Market, by Geography

3. Global Sound Sensors (SS) Market Analysis
3.1. Global SS Market Overview
3.2. Market Dynamics
3.2.1. Market Drivers
3.2.2. Market Challenges
3.3. See-Saw Analysis
3.3.1. Impact Analysis
3.4. Attractive Investment Proposition
3.5. Competitive Landscape
3.5.1. Market Positioning of Key Industry Participants
3.5.2. Major Strategies Adopted by Key Industry Participants

4. Global Sound Sensors (SS) Market Value, by Type, 2016 – 2026 (US$ Mn)
4.1. Overview
4.1.1. Global SS Market Value Share, by Type, 2017 & 2026 (Value %)
4.1.2. Global SS Market Value, by Type, 2016 – 2026 (US$ Mn)
4.2. Surface Acoustic Wave (SAW) sensor
4.2.1. Global Surface Acoustic Wave (SAW) SS Market, 2016 – 2026 (US$ Mn)
4.3. Bulk Acoustic Wave (BAW) Sensor
4.3.1. Global Bulk Acoustic Wave (BAW) SS Market, 2016 – 2026 (US$ Mn)

5. Global Sound Sensors (SS) Market Value, by Application, 2016 – 2026 (US$ Mn)
5.1. Overview
5.1.1. Global SS Market Value Share, by Application, 2017 & 2026 (Value %)
5.1.2. Global SS Market Value, by Application, 2016 – 2026 (US$ Mn)
5.2. Automotive
5.2.1. Global SS Market for Automotive, 2016 – 2026 (US$ Mn)
5.3. Healthcare
5.3.1. Global SS Market for Healthcare, 2016 – 2026 (US$ Mn)
5.4. Aerospace & Defense
5.4.1. Global SS Market for Aerospace & Defense, 2016 – 2026 (US$ Mn)
5.5. Manufacturing & Processing
5.5.1. Global SS Market Manufacturing & Processing, 2016 – 2026 (US$ Mn)
5.6. Consumer Electronics
5.6.1. Global SS Market Consumer Electronics, 2016 – 2026 (US$ Mn)

6. Global Sound Sensors (SS) Market Value, by Sensing Parameters, 2016 – 2026 (US$ Mn)
6.1. Overview
6.1.1. Global SS Market Value Share, by Sensing Parameters, 2017 & 2026 (Value %)
6.1.2. Global SS Market Value, by Sensing Parameters, 2016 – 2026 (US$ Mn)
6.2. Temperature
6.2.1. Global SS Market by Sensing Temperature, 2016 – 2026 (US$ Mn)
6.3. Torque
6.3.1. Global SS Market by Sensing Torque, 2016 – 2026 (US$ Mn)
6.4. Pressure
6.4.1. Global SS Market by Sensing Pressure, 2016 – 2026 (US$ Mn)
6.5. Mass
6.5.1. Global SS Market by Sensing Mass, 2016 – 2026 (US$ Mn)
6.6. Humidity
6.6.1. Global SS Market by Sensing Humidity, 2016 – 2026 (US$ Mn)
6.7. Viscosity
6.7.1. Global SS Market by Sensing Viscosity, 2016 – 2026 (US$ Mn)
6.8. Chemical Vapor
6.8.1. Global SS Market by Sensing Chemical Vapor, 2016 – 2026 (US$ Mn)

7. North America Sound Sensors (SS) Market Analysis, 2016 – 2026 (US$ Mn)
7.1. Overview
7.1.1. North America SS Market Value, 2016 – 2026, (US$ Mn)
7.2. North America SS Market, by Type, 2016 – 2026 (US$ Mn)
7.2.1. Comparative Analysis
7.3. North America SS Market, by Application, 2016 – 2026 (US$ Mn)
7.3.1. Comparative Analysis
7.4. North America SS Market, by Sensing Parameters, 2016 – 2026 (US$ Mn)
7.4.1. Comparative Analysis
7.5. North America SS Market Value, by Country, 2016 – 2026 (US$ Mn)
7.5.1. U.S.
7.5.1.1. U.S. SS Market, by Type, 2016 – 2026 (US$ Mn)
7.5.1.2. U.S. SS Market, by Application, 2016 – 2026 (US$ Mn)
7.5.1.3. U.S. SS Market, by Sensing Parameters, 2016 – 2026 (US$ Mn)
7.5.2. Canada
7.5.2.1. Canada SS Market, by Type, 2016 – 2026 (US$ Mn)
7.5.2.2. Canada SS Market, by Application, 2016 – 2026 (US$ Mn)
7.5.2.3. Canada SS Market, by Sensing Parameters, 2016 – 2026 (US$ Mn)

8. Europe Sound Sensors (SS) Market Analysis, 2016 – 2026 (US$ Mn)
8.1. Overview
8.1.1. Europe SS Market Value, 2016 – 2026, (US$ Mn)
8.2. Europe SS Market, by Type, 2016 – 2026 (US$ Mn)
8.2.1. Comparative Analysis
8.3. Europe SS Market, by Application, 2016 – 2026 (US$ Mn)
8.3.1. Comparative Analysis
8.4. Europe SS Market, by Sensing Parameters, 2016 – 2026 (US$ Mn)
8.4.1. Comparative Analysis
8.5. Europe SS Market Value, by Country, 2016 – 2026 (US$ Mn)
8.5.1. U.K.
8.5.1.1. U.K. SS Market, by Type, 2016 – 2026 (US$ Mn)
8.5.1.2. U.K. SS Market, by Application, 2016 – 2026 (US$ Mn)
8.5.1.3. U.K. SS Market, by Sensing Parameters, 2016 – 2026 (US$ Mn)
8.5.2. Germany
8.5.2.1. Germany SS Market, by Type, 2016 – 2026 (US$ Mn)
8.5.2.2. Germany SS Market, by Application, 2016 – 2026 (US$ Mn)
8.5.2.3. Germany SS Market, by Sensing Parameters, 2016 – 2026 (US$ Mn)
8.5.3. France
8.5.3.1. France SS Market, by Type, 2016 – 2026 (US$ Mn)
8.5.3.2. France SS Market, by Application, 2016 – 2026 (US$ Mn)
8.5.3.3. France SS Market, by Sensing Parameters, 2016 – 2026 (US$ Mn)
8.5.4. Rest of Europe
8.5.4.1. Rest of Europe SS Market, by Type, 2016 – 2026 (US$ Mn)
8.5.4.2. Rest of Europe SS Market, by Application, 2016 – 2026 (US$ Mn)
8.5.4.3. Rest of Europe SS Market, by Sensing Parameters, 2016 – 2026 (US$ Mn)

9. Asia Pacific Sound Sensors (SS) Market Analysis, 2016 – 2026 (US$ Mn)
9.1. Overview
9.1.1. Asia Pacific SS Market Value, 2016 – 2026, (US$ Mn)
9.2. Asia Pacific SS Market, by Type, 2016 – 2026 (US$ Mn)
9.2.1. Comparative Analysis
9.3. Asia Pacific SS Market, by Application, 2016 – 2026 (US$ Mn)
9.3.1. Comparative Analysis
9.4. Asia Pacific SS Market, by Sensing Parameters, 2016 – 2026 (US$ Mn)
9.4.1. Comparative Analysis
9.5. Asia Pacific SS Market Value, by Country, 2016 – 2026 (US$ Mn)
9.5.1. China
9.5.1.1. China SS Market, by Type, 2016 – 2026 (US$ Mn)
9.5.1.2. China SS Market, by Application, 2016 – 2026 (US$ Mn)
9.5.1.3. China SS Market, by Sensing Parameters, 2016 – 2026 (US$ Mn)
9.5.2. Japan
9.5.2.1. Japan SS Market, by Type, 2016 – 2026 (US$ Mn)
9.5.2.2. Japan SS Market, by Application, 2016 – 2026 (US$ Mn)
9.5.2.3. Japan SS Market, by Sensing Parameters, 2016 – 2026 (US$ Mn)
9.5.3. India
9.5.3.1. India SS Market, by Type, 2016 – 2026 (US$ Mn)
9.5.3.2. India SS Market, by Application, 2016 – 2026 (US$ Mn)
9.5.3.3. India SS Market, by Sensing Parameters, 2016 – 2026 (US$ Mn)
9.5.4. Rest of Asia Pacific
9.5.4.1. Rest of Asia Pacific SS Market, by Type, 2016 – 2026 (US$ Mn)
9.5.4.2. Rest of Asia Pacific SS Market, by Application, 2016 – 2026 (US$ Mn)
9.5.4.3. Rest of Asia Pacific SS Market, by Sensing Parameters, 2016 – 2026 (US$ Mn)

10. Rest of World (RoW) Sound Sensors (SS) Market Analysis, 2016 – 2026 (US$ Mn)
10.1. Overview
10.1.1. RoW SS Market Value, 2016 – 2026, (US$ Mn)
10.2. RoW SS Market, by Type, 2016 – 2026 (US$ Mn)
10.2.1. Comparative Analysis
10.3. RoW SS Market, by Application, 2016 – 2026 (US$ Mn)
10.3.1. Comparative Analysis
10.4. RoW SS Market, by Sensing Parameters, 2016 – 2026 (US$ Mn)
10.4.1. Comparative Analysis
10.5. RoW SS Market Value, by Country, 2016 – 2026 (US$ Mn)
10.5.1. Middle East & Africa
10.5.1.1. Middle East & Africa SS Market, by Type, 2016 – 2026 (US$ Mn)
10.5.1.2. Middle East & Africa SS Market, by Application, 2016 – 2026 (US$ Mn)
10.5.1.3. Middle East & Africa SS Market, by Sensing Parameters, 2016 – 2026 (US$ Mn)
10.5.2. Latin America
10.5.2.1. Latin America SS Market, by Type, 2016 – 2026 (US$ Mn)
10.5.2.2. Latin America SS Market, by Application, 2016 – 2026 (US$ Mn)
10.5.2.3. Latin America SS Market, by Sensing Parameters, 2016 – 2026 (US$ Mn)

11. Company Profiles
11.1. Honeywell International Inc.
11.2. Epson Toyocom Corporation
11.3. Panasonic Corporation
11.4. Teledyne Microwave Solutions
11.5. API Technologies Corp
11.6. Boston Piezo-optics INC.
11.7. Phonon Corporation
11.8. CTS Corporation
11.9. Vectron International
11.10. CeramTec

List of Figures

FIG. 1 Global Sound Sensors (SS): Market Segmentation
FIG. 2 Global SS Market: Research Methodology
FIG. 3 Top-Down and Bottom Up Approach
FIG. 4 Global SS Market Segmentation
FIG. 5 Global SS Market, by Type, 2017 (US$ Mn)
FIG. 6 Global SS Market, by Application, 2017 (US$ Mn)
FIG. 7 Global SS Market, by Sensing Parameters, 2017 (US$ Mn)
FIG. 8 Global SS Market, by Geography, 2017 (US$ Mn)
FIG. 9 Global SS Market Value, 2016 – 2026, (US$ Mn)
FIG. 10 See-Saw Analysis : Global SS Market
FIG. 11 Market Positioning of Key Industry Participants, 2017
FIG. 12 Global SS Market Value Contribution, by Type, 2017 & 2026 (Value %)
FIG. 13 Global Surface Acoustic Wave (SAW) sensor SS Market Value, 2016 – 2026, (US$ Mn)
FIG. 14 Global SS Market Value Contribution, by Application, 2017 & 2026 (Value %)
FIG. 15 Global SS Market Value for Automotive, 2016 – 2026, (US$ Mn)
FIG. 16 Global SS Market Value for Healthcare, 2016 – 2026, (US$ Mn)
FIG. 17 Global SS Market Value for Aerospace & Defense, 2016 – 2026, (US$ Mn)
FIG. 18 Global SS Market Value for Manufacturing & Processing, 2016 – 2026, (US$ Mn)
FIG. 19 Global SS Market Value for Consumer Electronics, 2016 – 2026, (US$ Mn)
FIG. 20 Global SS Market Value Contribution, by Sensing Parameters, 2017 & 2026 (Value %)
FIG. 21 Global SS Market Value Temperature Sensing, 2016 – 2026, (US$ Mn)
FIG. 22 Global SS Market Value by Torque Sensing, 2016 – 2026, (US$ Mn)
FIG. 23 Global SS Market Value by Pressure Sensing, 2016 – 2026, (US$ Mn)
FIG. 24 Global SS Market Value by Mass Sensing, 2016 – 2026, (US$ Mn)
FIG. 25 Global SS Market Value by Humidity Sensing, 2016 – 2026, (US$ Mn)
FIG. 26 Global SS Market Value by Viscosity Sensing, 2016 – 2026, (US$ Mn)
FIG. 27 Global SS Market Value by Chemical Vapor Sensing, 2016 – 2026, (US$ Mn)
FIG. 28 North America SS Market Value, 2016 – 2026, (US$ Mn)
FIG. 29 U.S. SS Market Value, 2016 – 2026, (US$ Mn)
FIG. 30 Canada SS Market Value, 2016 – 2026, (US$ Mn)
FIG. 31 Europe SS Market Value, 2016 – 2026, (US$ Mn)
FIG. 32 U.K. SS Market Value, 2016 – 2026, (US$ Mn)
FIG. 33 Germany SS Market Value, 2016 – 2026, (US$ Mn)
FIG. 34 France SS Market Value, 2016 – 2026, (US$ Mn)
FIG. 35 Rest of Europe SS Market Value, 2016 – 2026, (US$ Mn)
FIG. 36 Asia Pacific SS Market Value, 2016 – 2026, (US$ Mn)
FIG. 37 China SS Market Value, 2016 – 2026, (US$ Mn)
FIG. 38 Japan SS Market Value, 2016 – 2026, (US$ Mn)
FIG. 39 India SS Market Value, 2016 – 2026, (US$ Mn)
FIG. 40 Rest of Asia Pacific SS Market Value, 2016 – 2026, (US$ Mn)
FIG. 41 RoW SS Market Value, 2017– 2026, (US$ Mn)
FIG. 42 Middle East & Africa SS Market Value, 2017– 2026, (US$ Mn)
FIG. 43 Latin America SS Market Value, 2017– 2026, (US$ Mn)

List of Tables

TABLE 1 Market Snapshot: Global Sound Sensors (SS) Market
TABLE 2 Impact Indicators
TABLE 3 Impact Analysis of Drivers and Restraints
TABLE 4 North America SS Market Value, by Type, 2016 – 2026 (US$ Mn)
TABLE 5 North America SS Market Value, by Application, 2016 – 2026 (US$ Mn)
TABLE 5 North America SS Market Value, by Sensing Parameters, 2016 – 2026 (US$ Mn)
TABLE 6 North America SS Market Value, by Country, 2016 – 2026 (US$ Mn)
TABLE 7 U.S. SS Market Value, by Type, 2016 – 2026 (US$ Mn)
TABLE 8 U.S. SS Market Value, by Application, 2016 – 2026 (US$ Mn)
TABLE 9 U.S. SS Market Value, by Sensing Parameters, 2016 – 2026 (US$ Mn)
TABLE 10 Canada SS Market Value, by Type, 2016 – 2026 (US$ Mn)
TABLE 11 Canada SS Market Value, by Application, 2016 – 2026 (US$ Mn)
TABLE 12 Canada SS Market Value, by Sensing Parameters, 2016 – 2026 (US$ Mn)
TABLE 13 Europe SS Market Value, by Type, 2016 – 2026 (US$ Mn)
TABLE 14 Europe SS Market Value, by Application, 2016 – 2026 (US$ Mn)
TABLE 15 Europe SS Market Value, by Sensing Parameters, 2016 – 2026 (US$ Mn)
TABLE 16 Europe SS Market Value, by Country, 2016 – 2026 (US$ Mn)
TABLE 17 U.K. SS Market Value, by Type, 2016 – 2026 (US$ Mn)
TABLE 18 U.K. SS Market Value, by Application, 2016 – 2026 (US$ Mn)
TABLE 19 U.K. SS Market Value, by Sensing Parameters, 2016 – 2026 (US$ Mn)
TABLE 20 Germany SS Market Value, by Type, 2016 – 2026 (US$ Mn)
TABLE 21 Germany SS Market Value, by Application, 2016 – 2026 (US$ Mn)
TABLE 22 Germany SS Market Value, by Sensing Parameters, 2016 – 2026 (US$ Mn)
TABLE 23 France SS Market Value, by Type, 2016 – 2026 (US$ Mn)
TABLE 24 France SS Market Value, by Application, 2016 – 2026 (US$ Mn)
TABLE 25 France SS Market Value, by Sensing Parameters, 2016 – 2026 (US$ Mn)
TABLE 26 Rest of Europe SS Market Value, by Type, 2016 – 2026 (US$ Mn)
TABLE 27 Rest of Europe SS Market Value, by Application, 2016 – 2026 (US$ Mn)
TABLE 28 Rest of Europe SS Market Value, by Sensing Parameters, 2016 – 2026 (US$ Mn)
TABLE 29 Asia Pacific SS Market Value, by Type, 2016 – 2026 (US$ Mn)
TABLE 30 Asia Pacific SS Market Value, by Application, 2016 – 2026 (US$ Mn)
TABLE 31 Asia Pacific SS Market Value, by Sensing Parameters, 2016 – 2026 (US$ Mn)
TABLE 32 Asia Pacific SS Market Value, by Country, 2016 – 2026 (US$ Mn)
TABLE 33 China SS Market Value, by Type, 2016 – 2026 (US$ Mn)
TABLE 34 China SS Market Value, by Application, 2016 – 2026 (US$ Mn)
TABLE 35 China SS Market Value, by Sensing Parameters, 2016 – 2026 (US$ Mn)
TABLE 36 Japan SS Market Value, by Type, 2016 – 2026 (US$ Mn)
TABLE 37 Japan SS Market Value, by Application, 2016 – 2026 (US$ Mn)
TABLE 38 Japan SS Market Value, by Sensing Parameters, 2016 – 2026 (US$ Mn)
TABLE 39 India SS Market Value, by Type, 2016 – 2026 (US$ Mn)
TABLE 40 India SS Market Value, by Application, 2016 – 2026 (US$ Mn)
TABLE 41 India SS Market Value, by Application, 2016 – 2026 (US$ Mn)
TABLE 42 Rest of Asia Pacific SS Market Value, by Type, 2016 – 2026 (US$ Mn)
TABLE 43 Rest of Asia Pacific SS Market Value, by Application, 2016 – 2026 (US$ Mn)
TABLE 44 Rest of Asia Pacific SS Market Value, by Sensing Parameters, 2016 – 2026 (US$ Mn)
TABLE 45 Rest of World SS Market Value, by Type, 2016 – 2026 (US$ Mn)
TABLE 46 Rest of World SS Market Value, by Application, 2016 – 2026 (US$ Mn)
TABLE 47 Rest of World SS Market Value, by Sensing Parameters, 2016 – 2026 (US$ Mn)
TABLE 48 Rest of World SS Market Value, by Region, 2016 – 2026 (US$ Mn)
TABLE 49 Middle East & Africa SS Market Value, by Type, 2016 – 2026 (US$ Mn)
TABLE 50 Middle East & Africa SS Market Value, by Application, 2016 – 2026 (US$ Mn)
TABLE 51 Middle East & Africa SS Market Value, by Sensing Parameters, 2016 – 2026 (US$ Mn)
TABLE 52 Latin America SS Market Value, by Type, 2016 – 2026 (US$ Mn)
TABLE 53 Latin America SS Market Value, by Application, 2016 – 2026 (US$ Mn)
TABLE 54 Latin America SS Market Value, by Sensing Parameters, 2016 – 2026 (US$ Mn)
TABLE 55 Honeywell International Inc.: Company Snapshot (Company Details, Geographical Presence, Product Portfolio, Key Industries Served, Recent Developments)
TABLE 56 Epson Toyocom Corporation: Company Snapshot (Company Details, Geographical Presence, Product Portfolio, Key Industries Served, Recent Developments)
TABLE 57 Panasonic Corporation: Company Snapshot (Company Details, Geographical Presence, Product Portfolio, Key Industries Served, Recent Developments)
TABLE 58 Teledyne Microwave Solutions: Company Snapshot (Company Details, Geographical Presence, Product Portfolio, Key Industries Served, Recent Developments)
TABLE 59 API Technologies Corp: Company Snapshot (Company Details, Geographical Presence, Product Portfolio, Key Industries Served, Recent Developments)
TABLE 60 Boston Piezo-optics INC.: Company Snapshot (Company Details, Geographical Presence, Product Portfolio, Key Industries Served, Recent Developments)
TABLE 61 Phonon Corporation: Company Snapshot (Company Details, Geographical Presence, Product Portfolio, Key Industries Served, Recent Developments)
TABLE 62 CTS Corporation: Company Snapshot (Company Details, Geographical Presence, Product Portfolio, Key Industries Served, Recent Developments)
TABLE 63 Vectron International: Company Snapshot (Company Details, Geographical Presence, Product Portfolio, Key Industries Served, Recent Developments)
TABLE 64 CeramTec: Company Snapshot (Company Details, Geographical Presence, Product Portfolio, Key Industries Served, Recent Developments)

Frequently Asked Questions: 

What is the size of Sound Sensors Market?

The market for Sound Sensors Market is expected to reach XX Mn in 2026.

What is the Sound Sensors Market CAGR?

The Sound Sensors Market is expected to see significant CAGR growth over the coming years, at XX%.

What is the Forecast period considered for Sound Sensors Market?

The report is forecasted to 2018-2026.

What is the base year considered for Sound Sensors Market?

The base year of this report is 2017.

Who are the major players in this Market?

Honeywell International Inc.,Epson Toyocom Corporation,Panasonic Corporation,Teledyne Microwave Solutions,API Technologies Corp are some of the major players in the global market.

Endobronchial Ultrasound (EBUS) Biopsy Devices Market

Published:
Report ID: 4475

Endoscopic Ultrasound (EUS) Needles Market

Published:
Report ID: 4131

Artificial Intelligence in Ultrasound Imaging Market

Published:
Report ID: 54612

Endobronchial Ultrasound Biopsy Market

Published:
Report ID: 53458

High Intensity Focused Ultrasound Therapy Market

Published:
Report ID: 51248

Ultrasound Devices Market

Published:
Report ID: 10908

Ultrasound Conductivity Gels Market

Published:
Report ID: 45722

Soundproof Curtains Market

Published:
Report ID: 44612

Loudspeakers And Sound Bars Market

Published:
Report ID: 33338

Power Plant Simulators Market

Published:
Report ID: 10989

Encryption Software Market

Published:
Report ID: 4372

Business Intelligence & Analytics Software Market

Published:
Report ID: 3897

South Korea Micro Data Centers Market

Published:
Report ID: 58308

UK Micro Data Centers Market

Published:
Report ID: 58311

Japan Mega Data Centers Market

Published:
Report ID: 58290

Wavelength Division Multiplexers (WDM) Market

Published:
Report ID: 11653

Infrared Sensors Market

Published:
Report ID: 14071

Flake Ice Machine Market

Published:
Report ID: 4553

Educational Robots Market

Published:
Report ID: 4718

Digital Elevation Model (DEM) Market

Published:
Report ID: 4543

Automotive Night Vision Systems Market

Published:
Report ID: 1497

Purchase Options

The report comes as a view-only PDF document, optimized for individual clients. This version is recommended for personal digital use and does not allow printing.
$3699

To meet the needs of modern corporate teams, our report comes in two formats: a printable PDF and a data-rich Excel sheet. This package is optimized for internal analysis and multi-location access, making it an excellent choice for organizations with distributed workforce.
$4699

The report will be delivered in printable PDF format along with the report’s data Excel sheet. This license offers 100 Free Analyst hours where the client can utilize Credence Research Inc.’s research team. It is highly recommended for organizations seeking to execute short, customized research projects related to the scope of the purchased report.
$6699

Smallform of Sample request

Have a question?

User Profile

Don’t settle for less – trust Mitul to help you find the best solution.

Report delivery within 24 to 48 hours

– Other Info –

What people say?-

User Review

I am very impressed with the information in this report. The author clearly did their research when they came up with this product and it has already given me a lot of ideas.

Jana Schmidt
CEDAR CX Technologies

– Connect with us –

Phone

+91 6232 49 3207


support

24/7 Research Support


sales@credenceresearch.com

– Research Methodology –

Going beyond the basics: advanced techniques in research methodology

– Trusted By –

Pepshi, LG, Nestle
Motorola, Honeywell, Johnson and johnson
LG Chem, SIEMENS, Pfizer
Unilever, Samsonite, QIAGEN