
New colocation halls set airflow spending in South Africa
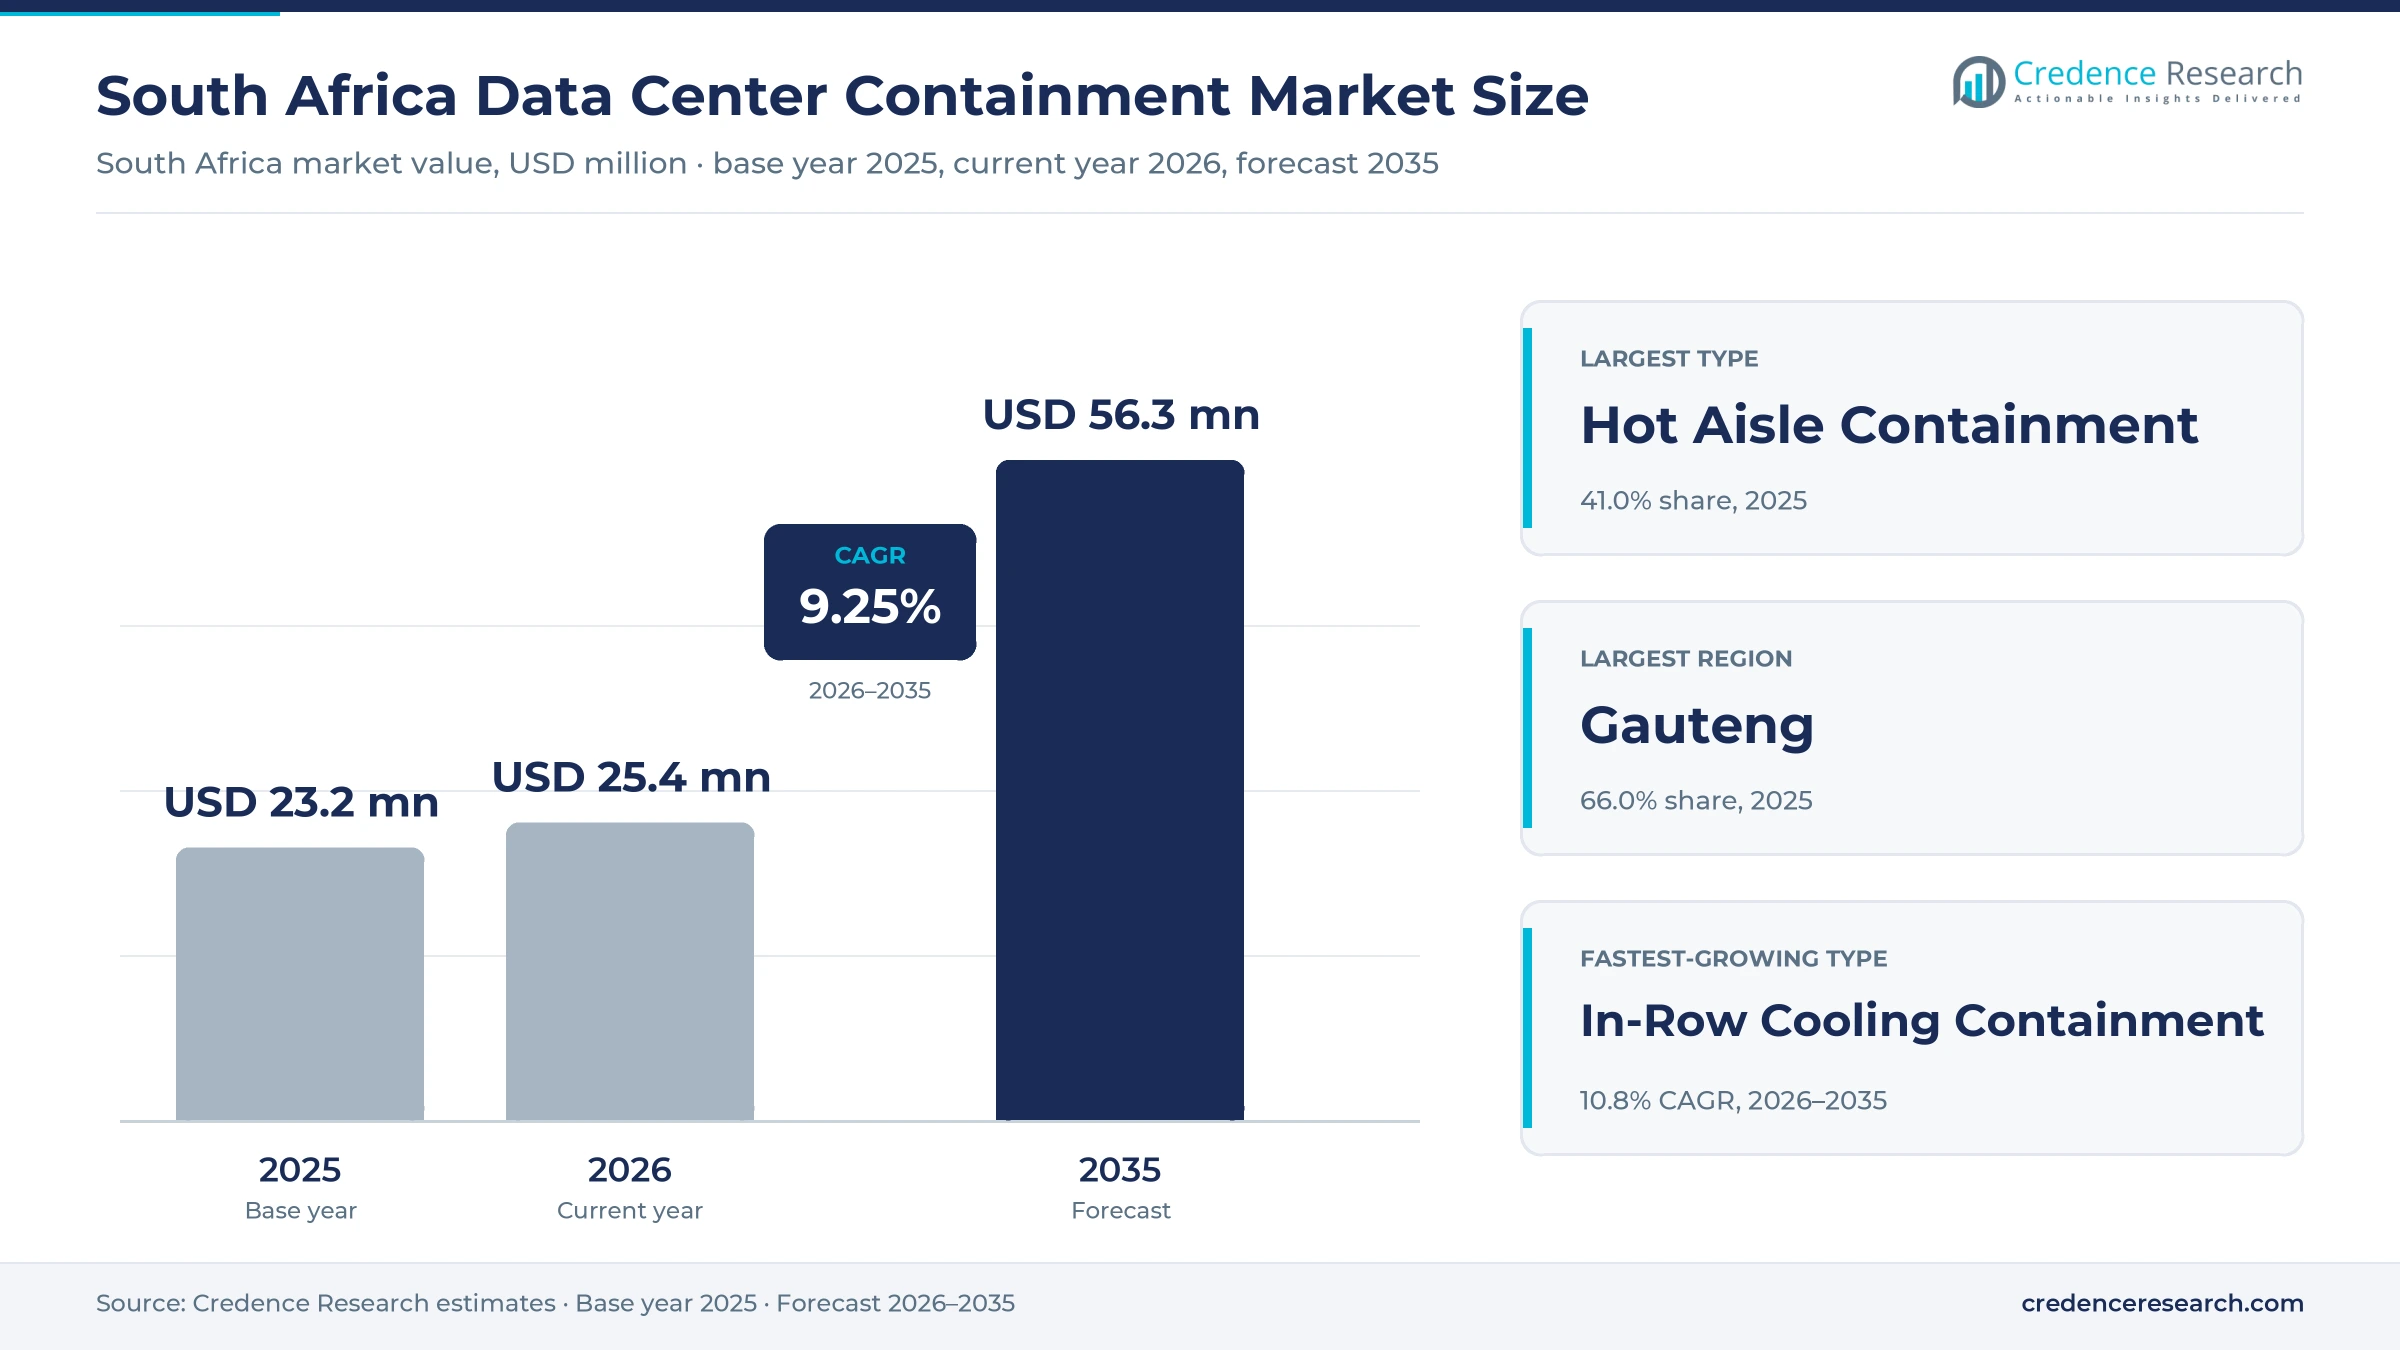
The South Africa data center containment market was valued at USD 23.2 million in 2025 and is projected to increase from USD 25.4 million in 2026 to USD 56.3 million by 2035, registering a CAGR of 9.25% during 2026–2035. Demand comes from colocation operators that fit out new data halls in 5 MW blocks, from cloud providers expanding Johannesburg and Cape Town regions, and from banks, insurers and government agencies that run their own server rooms. Gauteng held the largest regional share, 66.0% in 2025, because the Isando, Bredell, Midrand and Parklands campuses around Johannesburg host most installed IT load. Western Cape is the fastest-growing region, as hyperscale campuses planned near Cape Town add capacity. Rack densities are moving from about 5 kW toward 30 to 55 kW per cabinet for cloud and AI tenants, which shifts spending from simple door and roof kits toward sealed pods built around in-row and rear-door cooling.
Doors, roofs and blanking hardware make up the count
The market counts the value of physical airflow containment installed in South African data centers. It covers hot aisle and cold aisle enclosures, aisle doors and roof panels, rack-based chimney ducts, in-row cooling pods, blanking panels, brush strips and the installation work that seals each rack row so cooled air reaches the servers.
Cooling units, chillers, racks sold without containment and liquid cooling loops are excluded, although they decide which containment design a hall uses. Value moves from global rack and cooling makers through local integrators and electrical contractors to colocation operators, cloud providers and enterprise buyers.
South Africa Data Center Containment Market Insights
- The South Africa data center containment market rises from USD 23.2 million in 2025 to USD 56.3 million by 2035, a 9.25% CAGR during 2026–2035, as new halls open.
- Gauteng held 66.0% of 2025 value, because the Isando, Bredell, Midrand and Parklands campuses around Johannesburg host most installed IT load.
- Hot Aisle Containment held 41.0% of 2025 value, since large colocation halls seal exhaust air behind rack rows to run warmer inlet set points.
- Teraco completed its CT2 expansion in Cape Town in November 2025, adding 32 MW across eight data halls and lifting the site to 50 MW of IT load.
- Equinix bought R890 million of land in Johannesburg and Cape Town in 2026 for 160 MW of planned capacity on top of 172 MW under construction.
Hot aisle systems lead as in-row pods grow fastest
Hot aisle systems lead while in-row pods grow fastest
Based on containment type, the market is categorized into hot aisle containment, cold aisle containment, rack-based chimney containment and in-row cooling containment. Hot Aisle Containment led with 41.0% of 2025 value because ducting exhaust air away lets the rest of the hall run at a warmer inlet set point and capture free-cooling hours, and Africa Data Centres switches off refrigeration on about 180 Johannesburg days below 17 degrees Celsius, ITWeb reported, which works only when return air is sealed off. In-Row Cooling Containment grows fastest at 10.8% a year, as cloud tenants now take 30 to 50 kW racks, Teraco told ITWeb in July 2026, which exceeds what open aisles can cool evenly.
Colocation halls lead as hyperscale campuses grow faster
Based on data center type, the market is categorized into colocation data center, hyperscale data center, enterprise data center, cloud data center and others. Colocation Data Center led with 46.0% of 2025 value because multi-tenant operators fit out most new white space, and Equinix opened JN1 in Johannesburg in October 2024 with 700 cabinets and plans for 3,475 at full build. Hyperscale Data Center grows fastest at 10.6% a year, as Teraco's 30 MW JB5 building, built to hyperscale cloud requirements, houses its first at-scale GPU workloads, TechCentral reported in May 2025.
Modular kits lead while hybrid layouts grow fastest
Based on arrangement, the market is categorized into modular containment, rigid containment, hybrid containment and others. Modular Containment led with 44.0% of 2025 value because operators add halls in stages and need panels that move with each phase. Teraco delivered its JB4 expansion as six separate 5 MW halls, Teraco said in August 2025, so containment is ordered and fitted hall by hall rather than for a whole building at once. Hybrid Containment grows fastest at 10.5% a year, as operators pair rigid walls in base halls with modular panels in later phases, and Teraco's JB4 halls, built liquid-cooling-enabled while still serving air-cooled cloud racks, need enclosures that can be reconfigured as tenants change.
| Segment Group | Leading Sub-segment | Share, 2025 | Fastest-growing Sub-segment | CAGR, 2026–2035 |
|---|---|---|---|---|
| By Containment Type | Hot Aisle Containment | 41.0% | In-Row Cooling Containment | 10.8% |
| By Data Center Type | Colocation Data Center | 46.0% | Hyperscale Data Center | 10.6% |
| By Arrangement | Modular Containment | 44.0% | Hybrid Containment | 10.5% |
Rack positions and hall scope set containment prices
Containment in South Africa is priced per rack position or per contained row, and installation adds a large share on new halls because doors, roofs and fire-system interfaces must be fitted on site. Most hardware is imported, so rand moves pass into tender prices within a quarter. Large operators tender whole halls and push unit prices down, while enterprise rooms pay list prices for small orders. Suppliers earn the best margins on engineered pods for dense cabinets, where design work and sensors are bundled.
| Offer or input | Typical price or fee | Basis |
|---|---|---|
| Steel blanking panel, 3U, 19-inch rack | R489.19 each, excluding VAT | RS Components South Africa list, November 2026 |
| Hot or cold aisle kit per rack position | USD 1,000 to USD 2,000 installed | Credence Research estimate from list prices and installation inputs |
| Rack-based chimney duct per cabinet | USD 500 to USD 1,200 | Credence Research estimate from supplier price lists |
| Containment in a new colocation hall | USD 0.13 million to USD 0.34 million per MW of IT load | Credence Research estimate from 125 to 170 racks per MW |
Request a Free Sample
Fill in your details and we'll send you a free sample report.
- Sample data tables & charts
- Research methodology
Hall build-outs, cloud capital and tariffs lift demand
Colocation hall build-outs add contained white space
Each new colocation hall needs containment before tenants move in, so the pace of hall completions sets most annual demand. Teraco completed JB4 in August 2025, adding 30 MW across six halls of 5 MW each and lifting the building to 50 MW. It then finished CT2 in Cape Town in November 2025, adding 32 MW in eight halls, Teraco said, for a group critical load of 189 MW. Africa Data Centres reported about 25 MW of live IT load in South Africa and another 20 MW in production, ITWeb noted in November 2025. Each 5 MW hall creates containment demand for roughly 600 to 850 rack positions, on Credence Research estimates of 125 to 170 racks per MW, which rewards repeatable door and roof packages.
Cloud capital commitments widen the build pipeline
Cloud and interconnection investors are funding capacity well beyond current tenant demand, and every committed megawatt becomes contained white space within two to three years. Microsoft committed a further ZAR 5.4 billion in March 2025 to expand cloud and AI infrastructure through the end of 2027, Microsoft said, after ZAR 20.4 billion over the previous three years. Equinix bought R890 million of land covering 327,000 square meters for 160 MW of planned capacity, TechCentral reported in April 2026, on top of 172 MW already under construction. Cassava Technologies and STANLIB agreed in October 2025 to fund AI-ready halls at Africa Data Centres campuses. Suppliers with hyperscale design approvals gain most from this pipeline.
Electricity tariffs shorten containment payback periods
Higher grid tariffs raise the value of every kilowatt that containment saves in cooling, which turns retrofits from optional upgrades into budgeted projects. Eskom raised tariffs for direct customers by an average 12.74% from April 1, 2025, and municipal bulk prices by 11.32% from July 1, 2025, Eskom said. Cooling takes 30% to 40% of a data center's power use in South African halls, ITWeb noted in July 2026, well above the roughly 7% the International Energy Agency reports for efficient hyperscale sites. Every kilowatt of bypass air that containment stops therefore removes a larger rand cost each year, which helps colocation operators hold tenant power prices. Operators that pay municipal tariffs on top of Eskom bulk prices see the fastest payback on containment retrofits.
Data residency and uptime rules keep workloads local
National policy keeps public workloads inside South Africa and sets high resilience targets, which pulls government and regulated data into contained local halls. The National Data and Cloud Policy, gazetted on May 31, 2024, as Government Gazette No. 50741, requires data center infrastructure used by government entities to sit inside the country, ENSafrica noted. The same policy asks government-used facilities for fault-tolerant designs with at least 99.995% uptime and certification credentials. Microsoft runs its South African cloud regions from Johannesburg and Cape Town. Operators chasing state and banking tenants therefore specify sealed, monitored airflow, which supports demand for instrumented containment.
Denser racks push sealed pods and prefabricated halls
Denser racks shift buyers toward sealed pods
Operators are shifting from open hot and cold aisles toward sealed pods with in-row or rear-door cooling to handle denser cabinets. Teraco told ITWeb in July 2026 that racks were historically 1 to 3 kW for carriers and about 5 kW for enterprises, while its planned JB7 facility cools up to about 55 kW per cabinet with rear-door units on a raised floor. Africa Data Centres designs its Johannesburg JHB1 halls for up to 20 kW per rack with hot and cold aisle containment. Schneider Electric expects densities of about 30 kW per rack in modular buildings. Each step up in density raises containment value per rack, favoring suppliers of engineered pods over door kits.
Prefabricated halls arrive with containment built in
Operators and agencies are shifting toward prefabricated rooms that arrive with racks, cooling and containment integrated, which moves containment buying into a single package contract. Vertiv first deployed Parklands as a prefabricated Tier III data center, and Open Access Data Centres has standardized on Vertiv power, thermal and containment systems there, Vertiv said in May 2026. A South African government agency used a Vertiv room pre-built off site to meet a three-month window, and the main room was unavailable for 1.5 days in total with no official downtime, Vertiv reported in December 2025. Schneider Electric says its manufacturing hubs across the Middle East, Africa and Europe let modular units be assembled closer to buyers. Standalone containment installers lose share as integrated packages win more tenders.
Enterprise server rooms open a retrofit market
Enterprise and government server rooms are the clearest retrofit opening, because their cooling overhead is far higher than in new colocation halls. The International Energy Agency estimates that cooling uses about 7% of power in efficient hyperscale facilities but more than 30% in less efficient enterprise data centers, IEA analysis shows. The Vertiv agency project above covered a main room serving 1,700 staff, a typical scale for banks, insurers, mines and departments, and such rooms drive retrofit demand for 1U to 3U panels. Datacentrix offers data center design, site preparation and installation for such rooms. Blanking panels, brush strips and partial aisle doors can cut hot-air recirculation without a new building.
Western Cape campuses open room for new installers
Hyperscale campuses planned around Cape Town give containment suppliers a second regional market outside Gauteng. Cavaleros plans a 360 MW Cosmas Data City campus near Cape Town and a 200 MW campus north of Johannesburg, Daily Maverick reported in February 2026, while Teraco plans 60 MW more in Cape Town. Equinix is buying land in Cape Town, a new front for a company previously concentrated in Gauteng. These projects are plans rather than orders, so their timing remains uncertain. Installers with Western Cape crews can win site work that Johannesburg teams now travel to deliver, and local stock of doors and roof panels would shorten fit-out lead times for each new hall.
Grid limits, liquid cooling and buyer power cap margins
Grid supply limits could delay new halls
Containment orders follow hall commissioning, so any delay in grid connections pushes supplier revenue to later years. Eskom reported 441 days without load shedding by August 2026, SAnews said, yet analyst Chris Yelland told Daily Maverick in February 2026 that supply will probably be constrained by 2029 without new generation. Announced projects could lift IT load well above 1,200 MW. Suppliers that hold stock for planned halls are most exposed if utility connections slip.
Liquid cooling trims air containment per megawatt
Direct-to-chip and liquid-to-liquid cooling remove most heat at the server, which lowers the air containment needed per megawatt in AI halls. Teraco expects cabinets of 100 to 200 kW soon and says they will need liquid-to-liquid cooling, ITWeb reported in July 2026. Stulz says about 80% of its systems installed in Africa are still air-cooled, and its first liquid cooling request came from a major South African data center company. Makers of standard aisle door kits are most exposed as AI halls specify liquid loops.
Enterprise migration shrinks in-house server rooms
Enterprises moving workloads to colocation and public cloud close in-house rooms that once bought containment retrofits. Microsoft has spent ZAR 20.4 billion on South African cloud infrastructure over three years, and its local regions absorb workloads that banks and agencies once hosted on premises. The Vertiv agency project above shows that some public bodies still upgrade rooms of that size, yet such projects are small and one-off. Integrators that depend on enterprise retrofit work are most exposed as rooms consolidate.
Concentrated buyers press supplier prices
A small number of operators buy most containment, which gives them strong leverage over price and specifications. Teraco alone runs 189 MW of critical load across Isando, Bredell, Cape Town and Durban, and Daily Maverick described it in February 2026 as the largest operator in the country. Large buyers tender standard hall designs across several sites at once. Suppliers without a framework agreement with Teraco, Africa Data Centres or Equinix compete mainly for smaller enterprise rooms at lower volume.
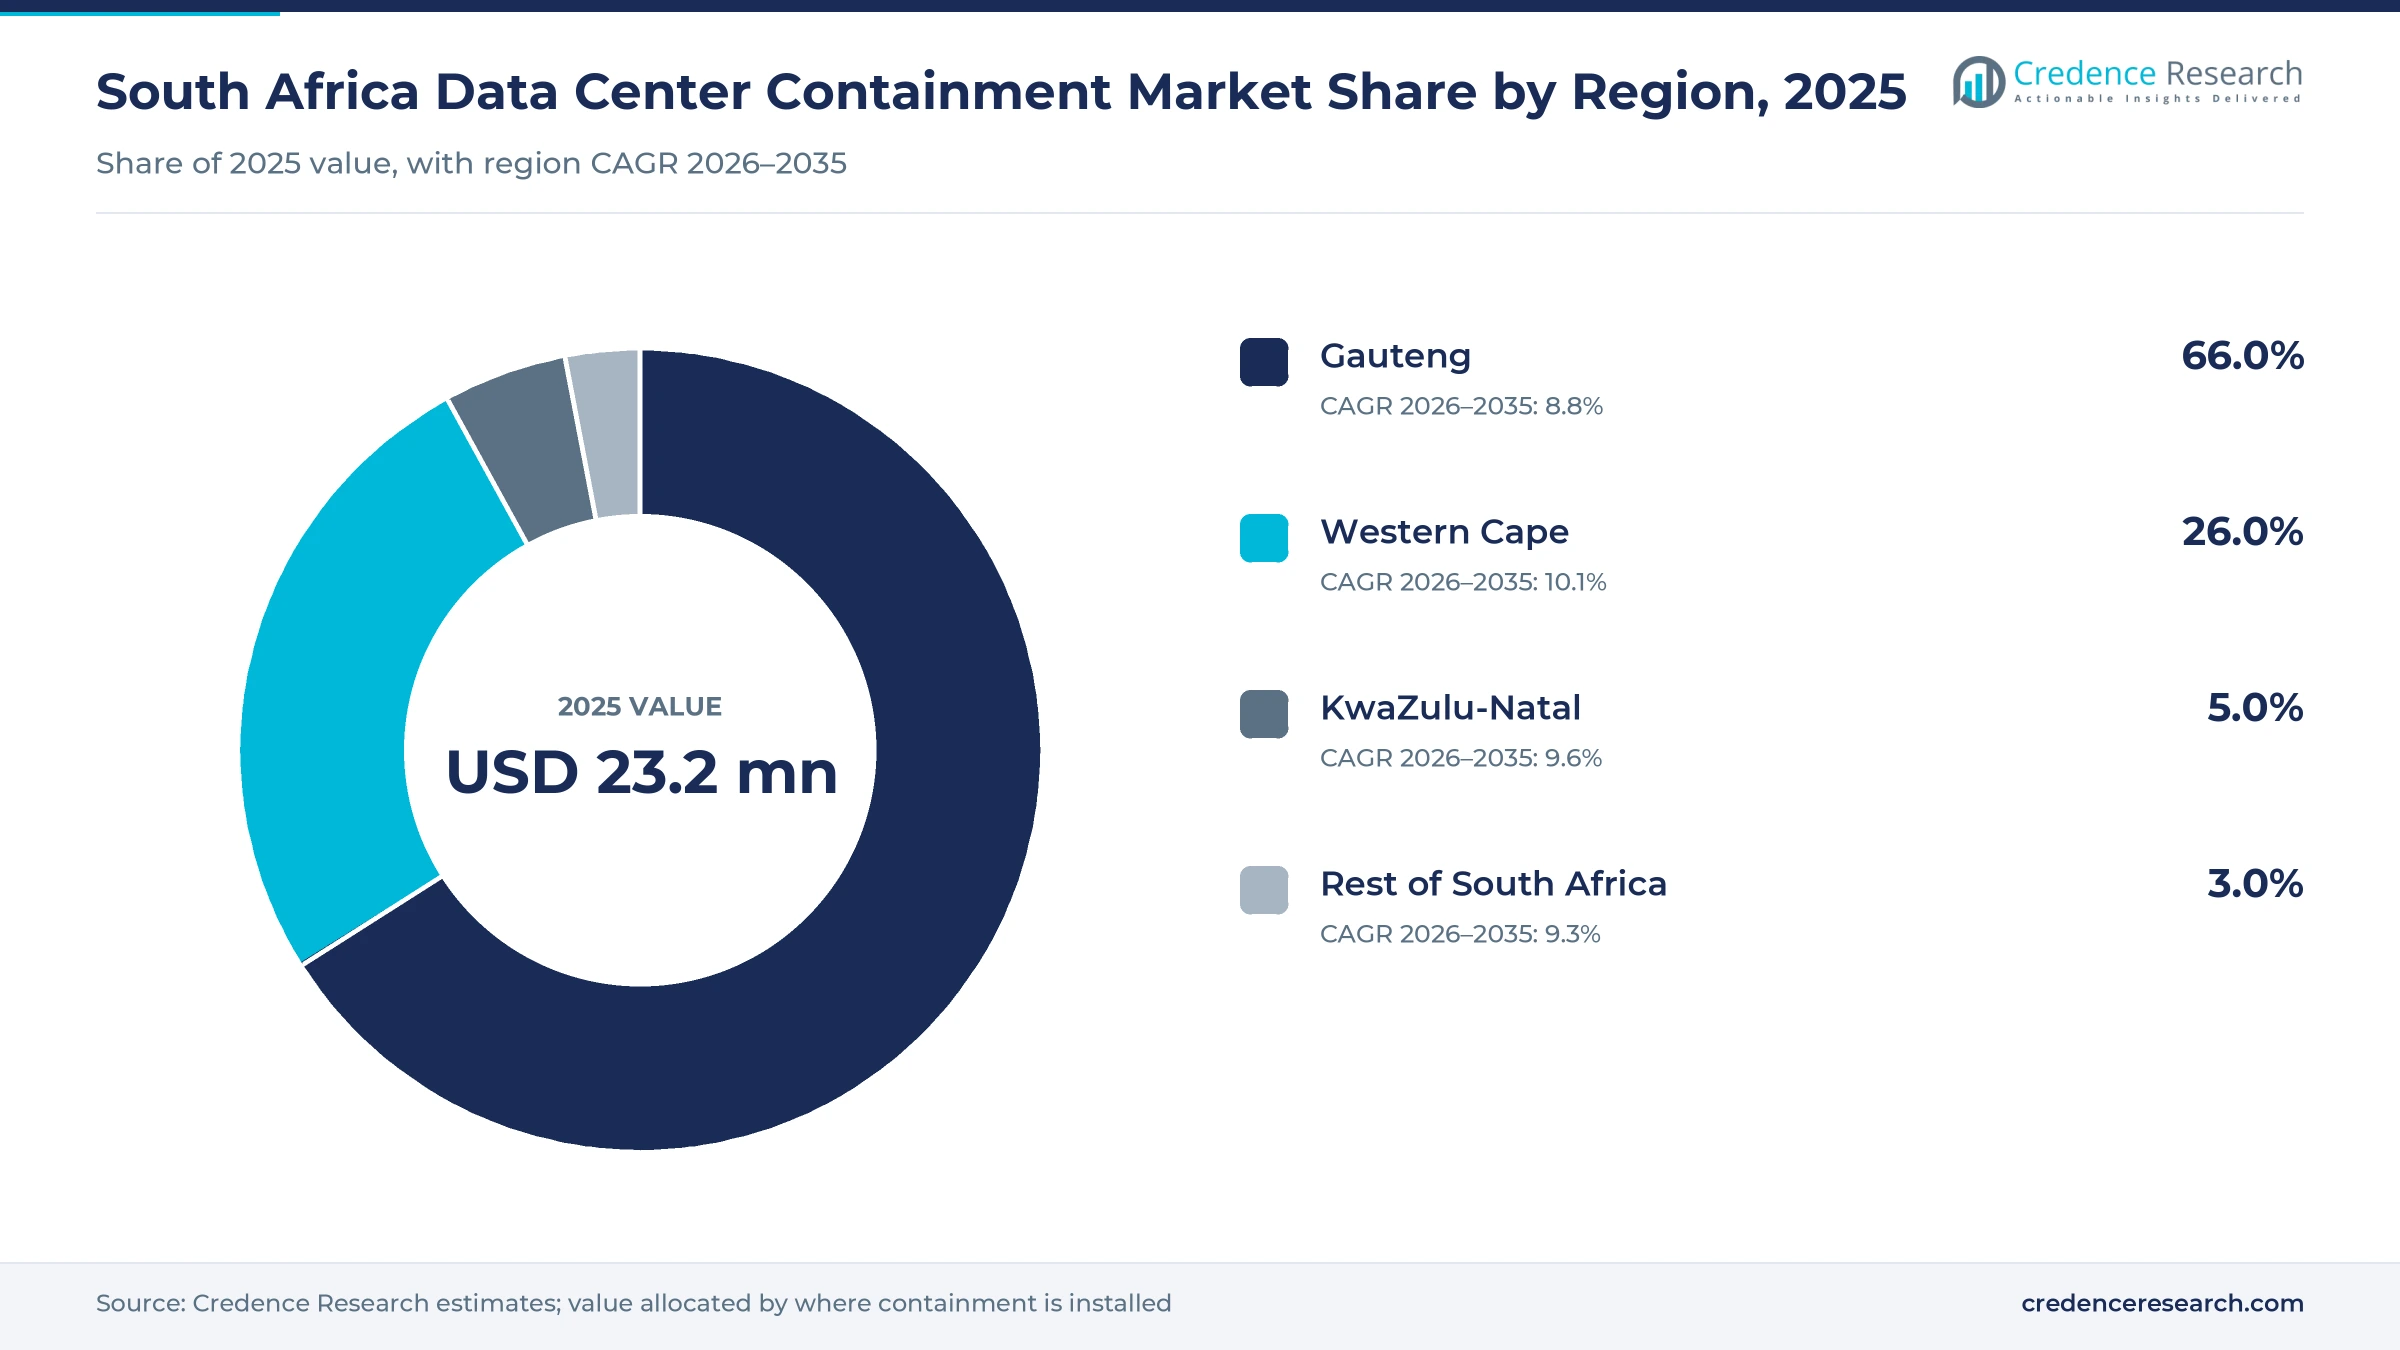
Gauteng buys most as Western Cape adds hyperscale halls
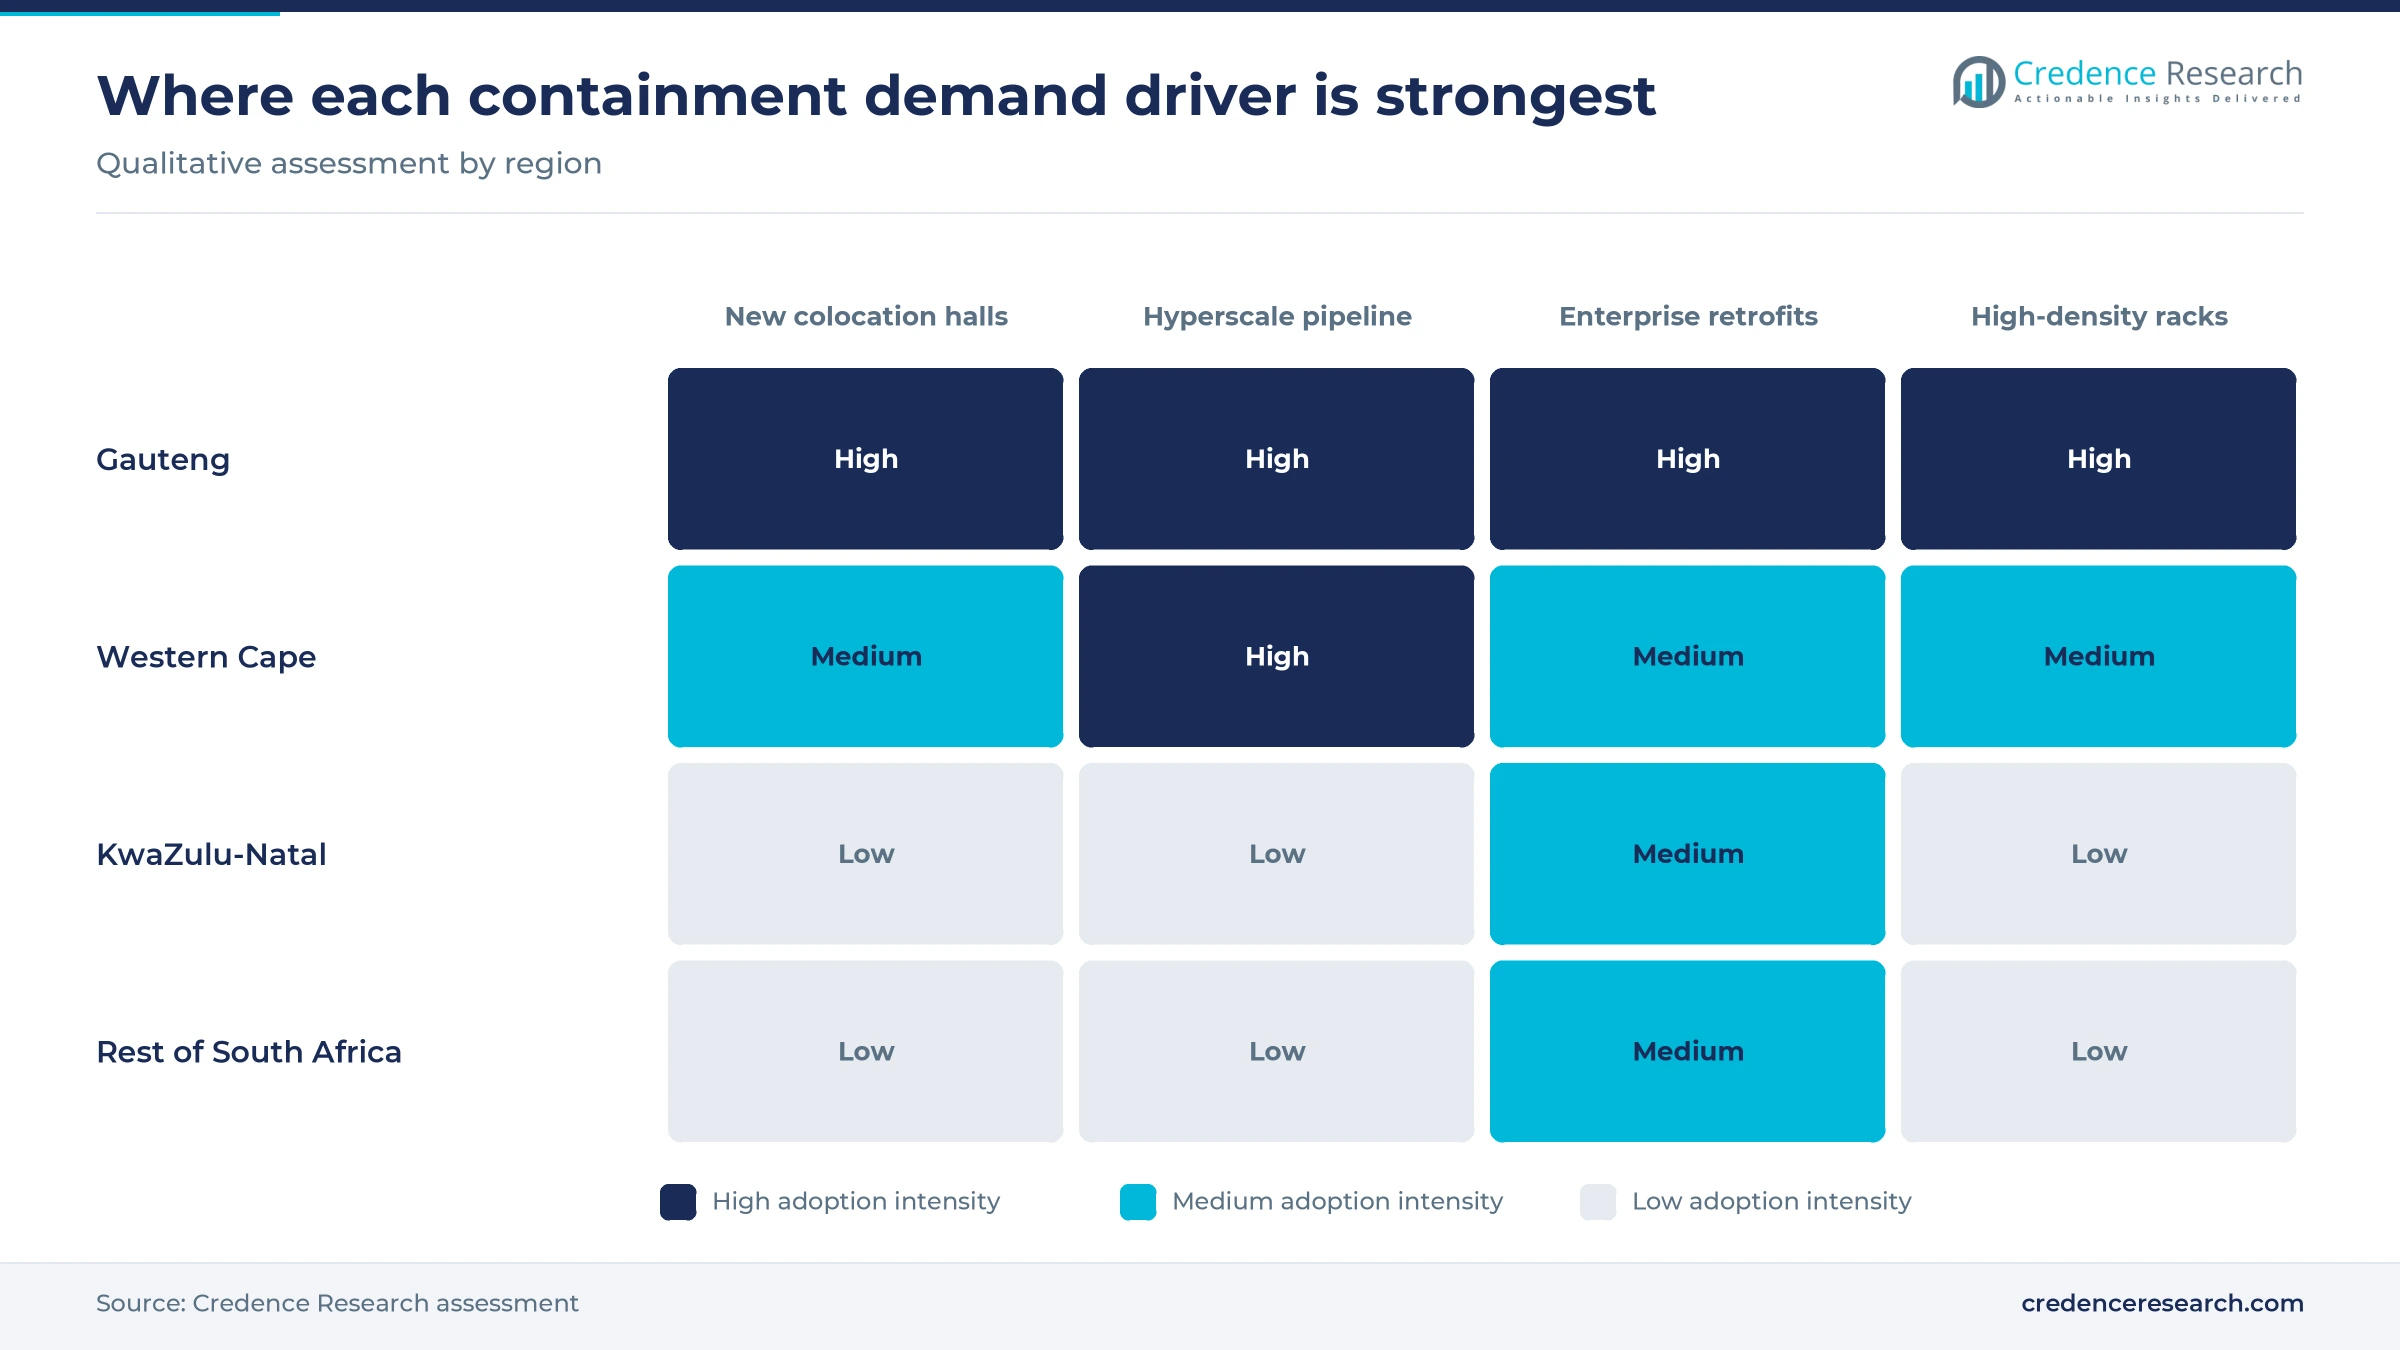
| Region | Value, 2025 (USD million) | Share, 2025 | CAGR, 2026–2035 |
|---|---|---|---|
| Gauteng | 15.3 | 66.0% | 8.8% |
| Western Cape | 6.0 | 26.0% | 10.1% |
| KwaZulu-Natal | 1.2 | 5.0% | 9.6% |
| Rest of South Africa | 0.7 | 3.0% | 9.3% |
Gauteng leads through Johannesburg campus clusters
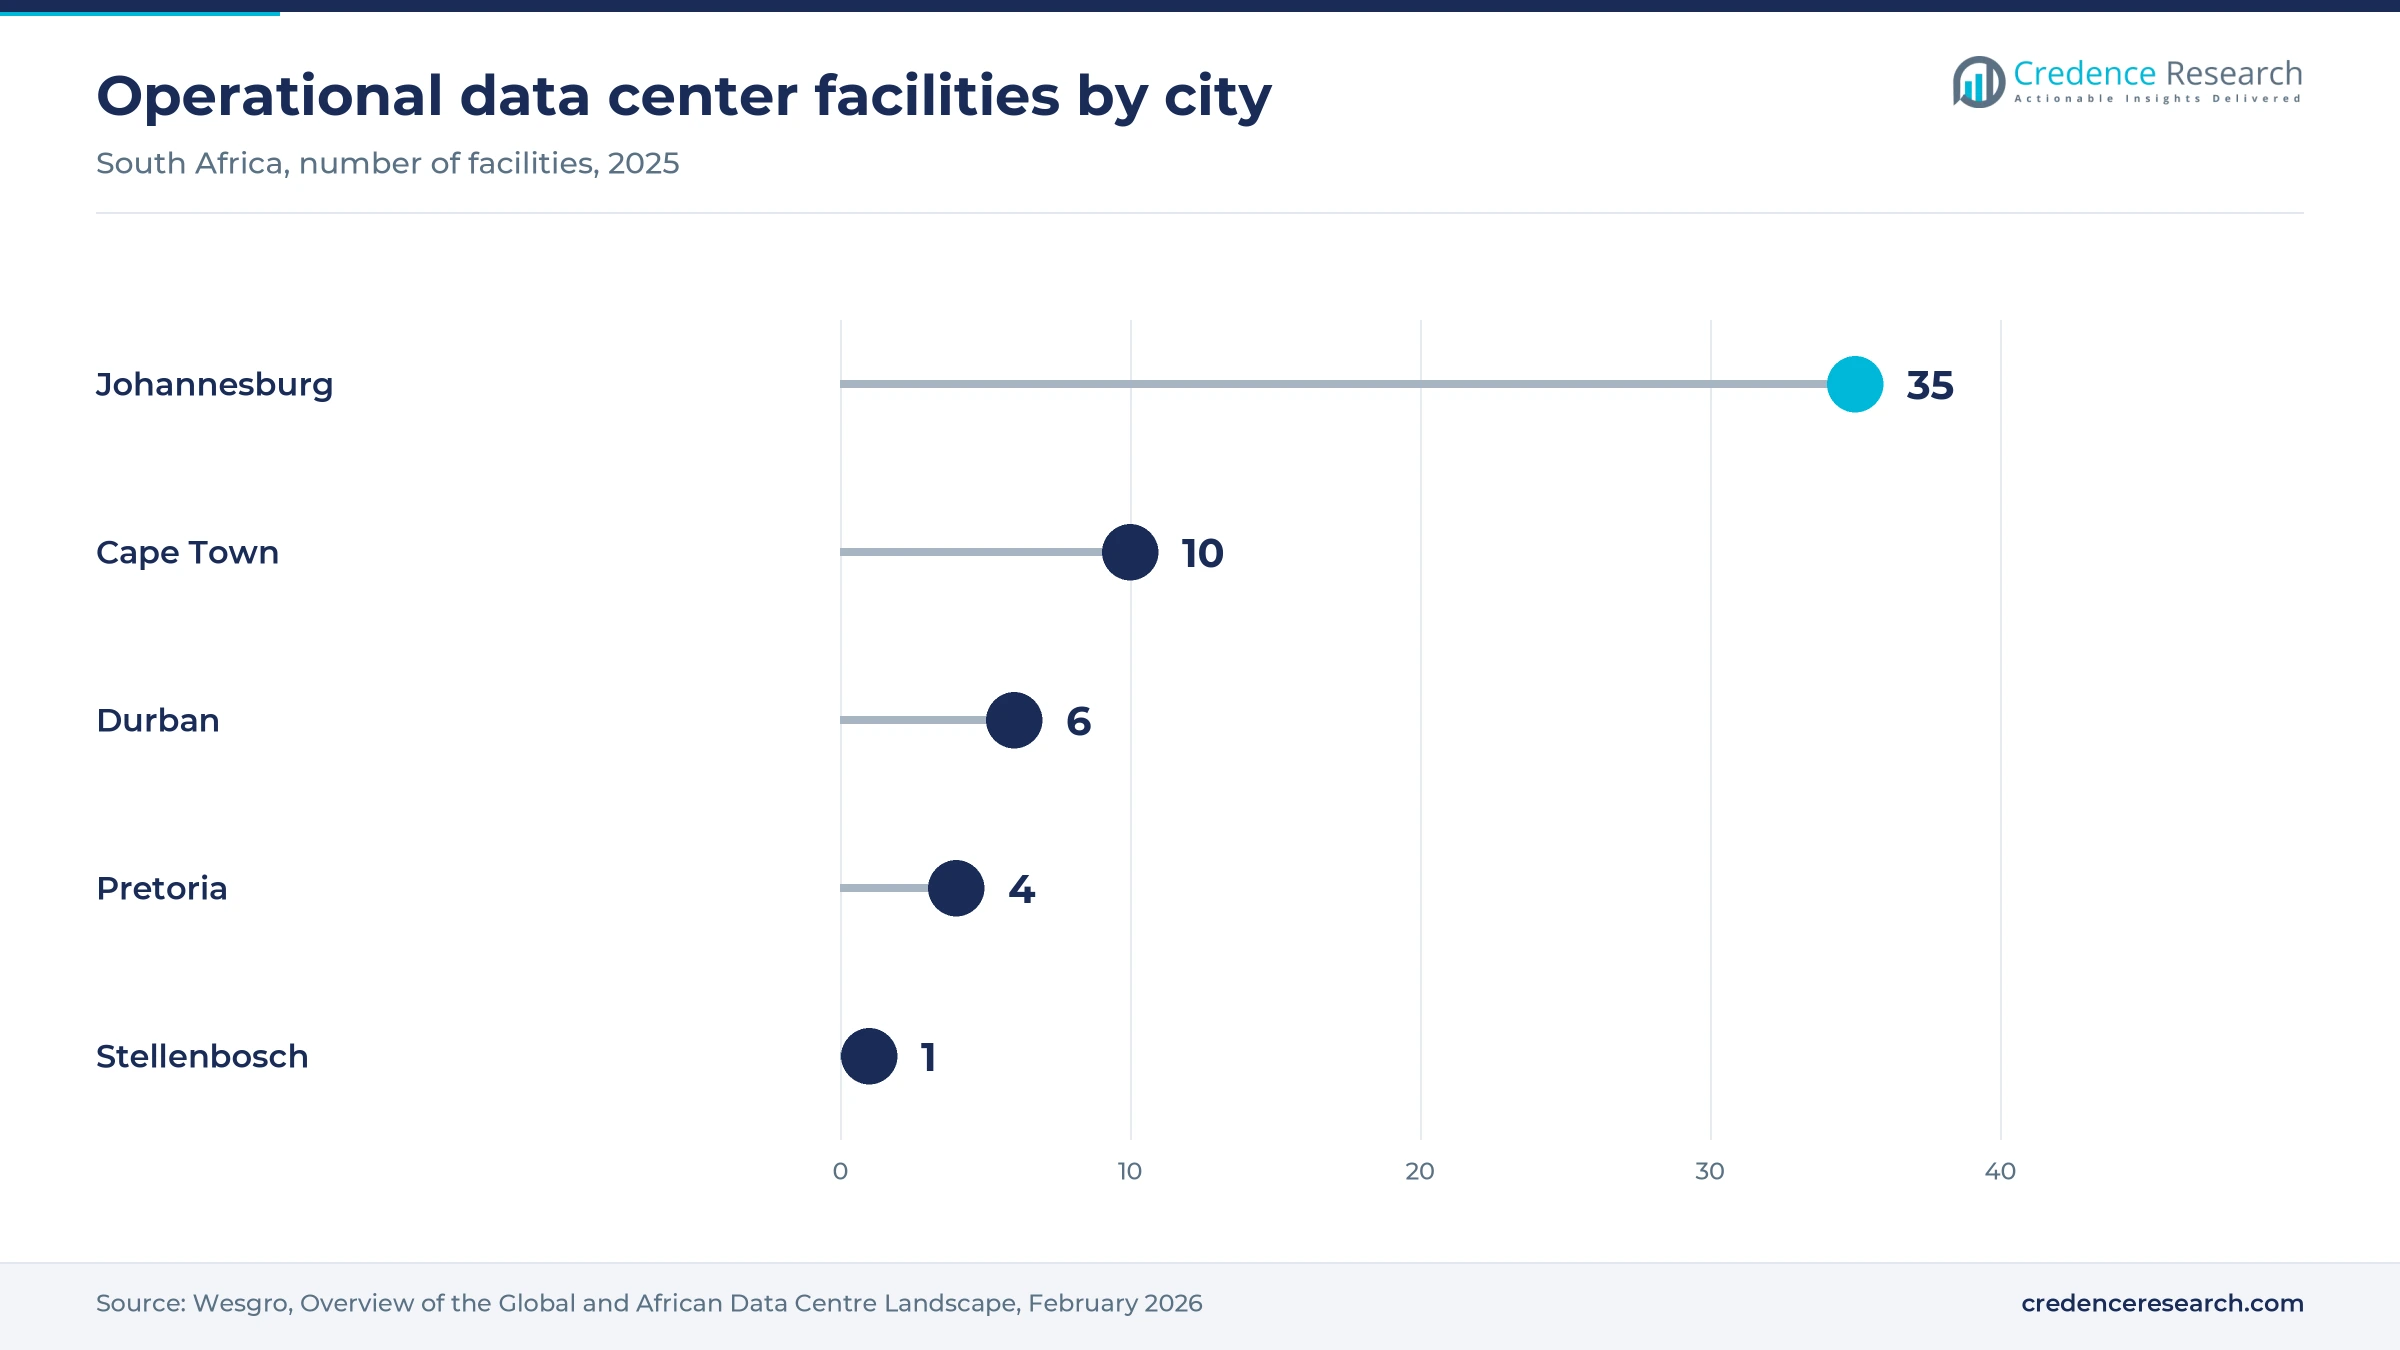
Gauteng held 66.0% of 2025 value and grows at 8.8% a year through 2035. Wesgro counts 35 operational facilities in Johannesburg and four in Pretoria, out of 56 nationally. Teraco's Isando campus will reach 110 MW of critical load once its 40 MW JB7 building, funded by an R8 billion syndicated loan, is completed in 2026, Engineering News reported. Vantage plans 100 MW across two Johannesburg campuses, so the province keeps the largest flow of new hall fit-outs and UPS system orders.
Western Cape grows fastest as hyperscale halls open
Western Cape held 26.0% of 2025 value and is the fastest-growing region at 10.1% a year. Wesgro counts 10 facilities in Cape Town and one in Stellenbosch, and notes that the cool coastal climate supports ambient and seawater cooling. Teraco's CT2 campus now carries 50 MW of IT load on 90 MW of utility power, and Africa Data Centres added 6 MW, or about 1,000 racks, at CPT1 in July 2024. Cooler air raises the payback from tight containment, because more hours qualify for free cooling.
KwaZulu-Natal grows from subsea cable landing demand
KwaZulu-Natal held 5.0% of 2025 value and grows at 9.6% a year. Wesgro counts six facilities in Durban, where cable landing stations bring network operators. Teraco doubled its Durban DB1 site to 2.2 MW of critical load and more than 700 racks in November 2023. Public sources reviewed do not show a Durban hall above 5 MW, which is an evidence gap, so demand is modeled as smaller network and enterprise rooms that suit renovation projects.
Rest of South Africa relies on mine and municipal rooms
Rest of South Africa held 3.0% of 2025 value and grows at 9.3% a year. Wesgro lists no operational colocation facility outside the five cities it tracks, so demand here comes from mine sites, municipal offices and provincial departments running small server rooms. Datacentrix deployed a mobile data center with Huawei cold aisle containment at the Khumani iron ore mine in the Northern Cape, Intelligent CIO reported in September 2019. Credence Research assumes containment here is bought as part of room upgrades with precision air conditioning units.
Hall completions, cloud pledges and land purchases
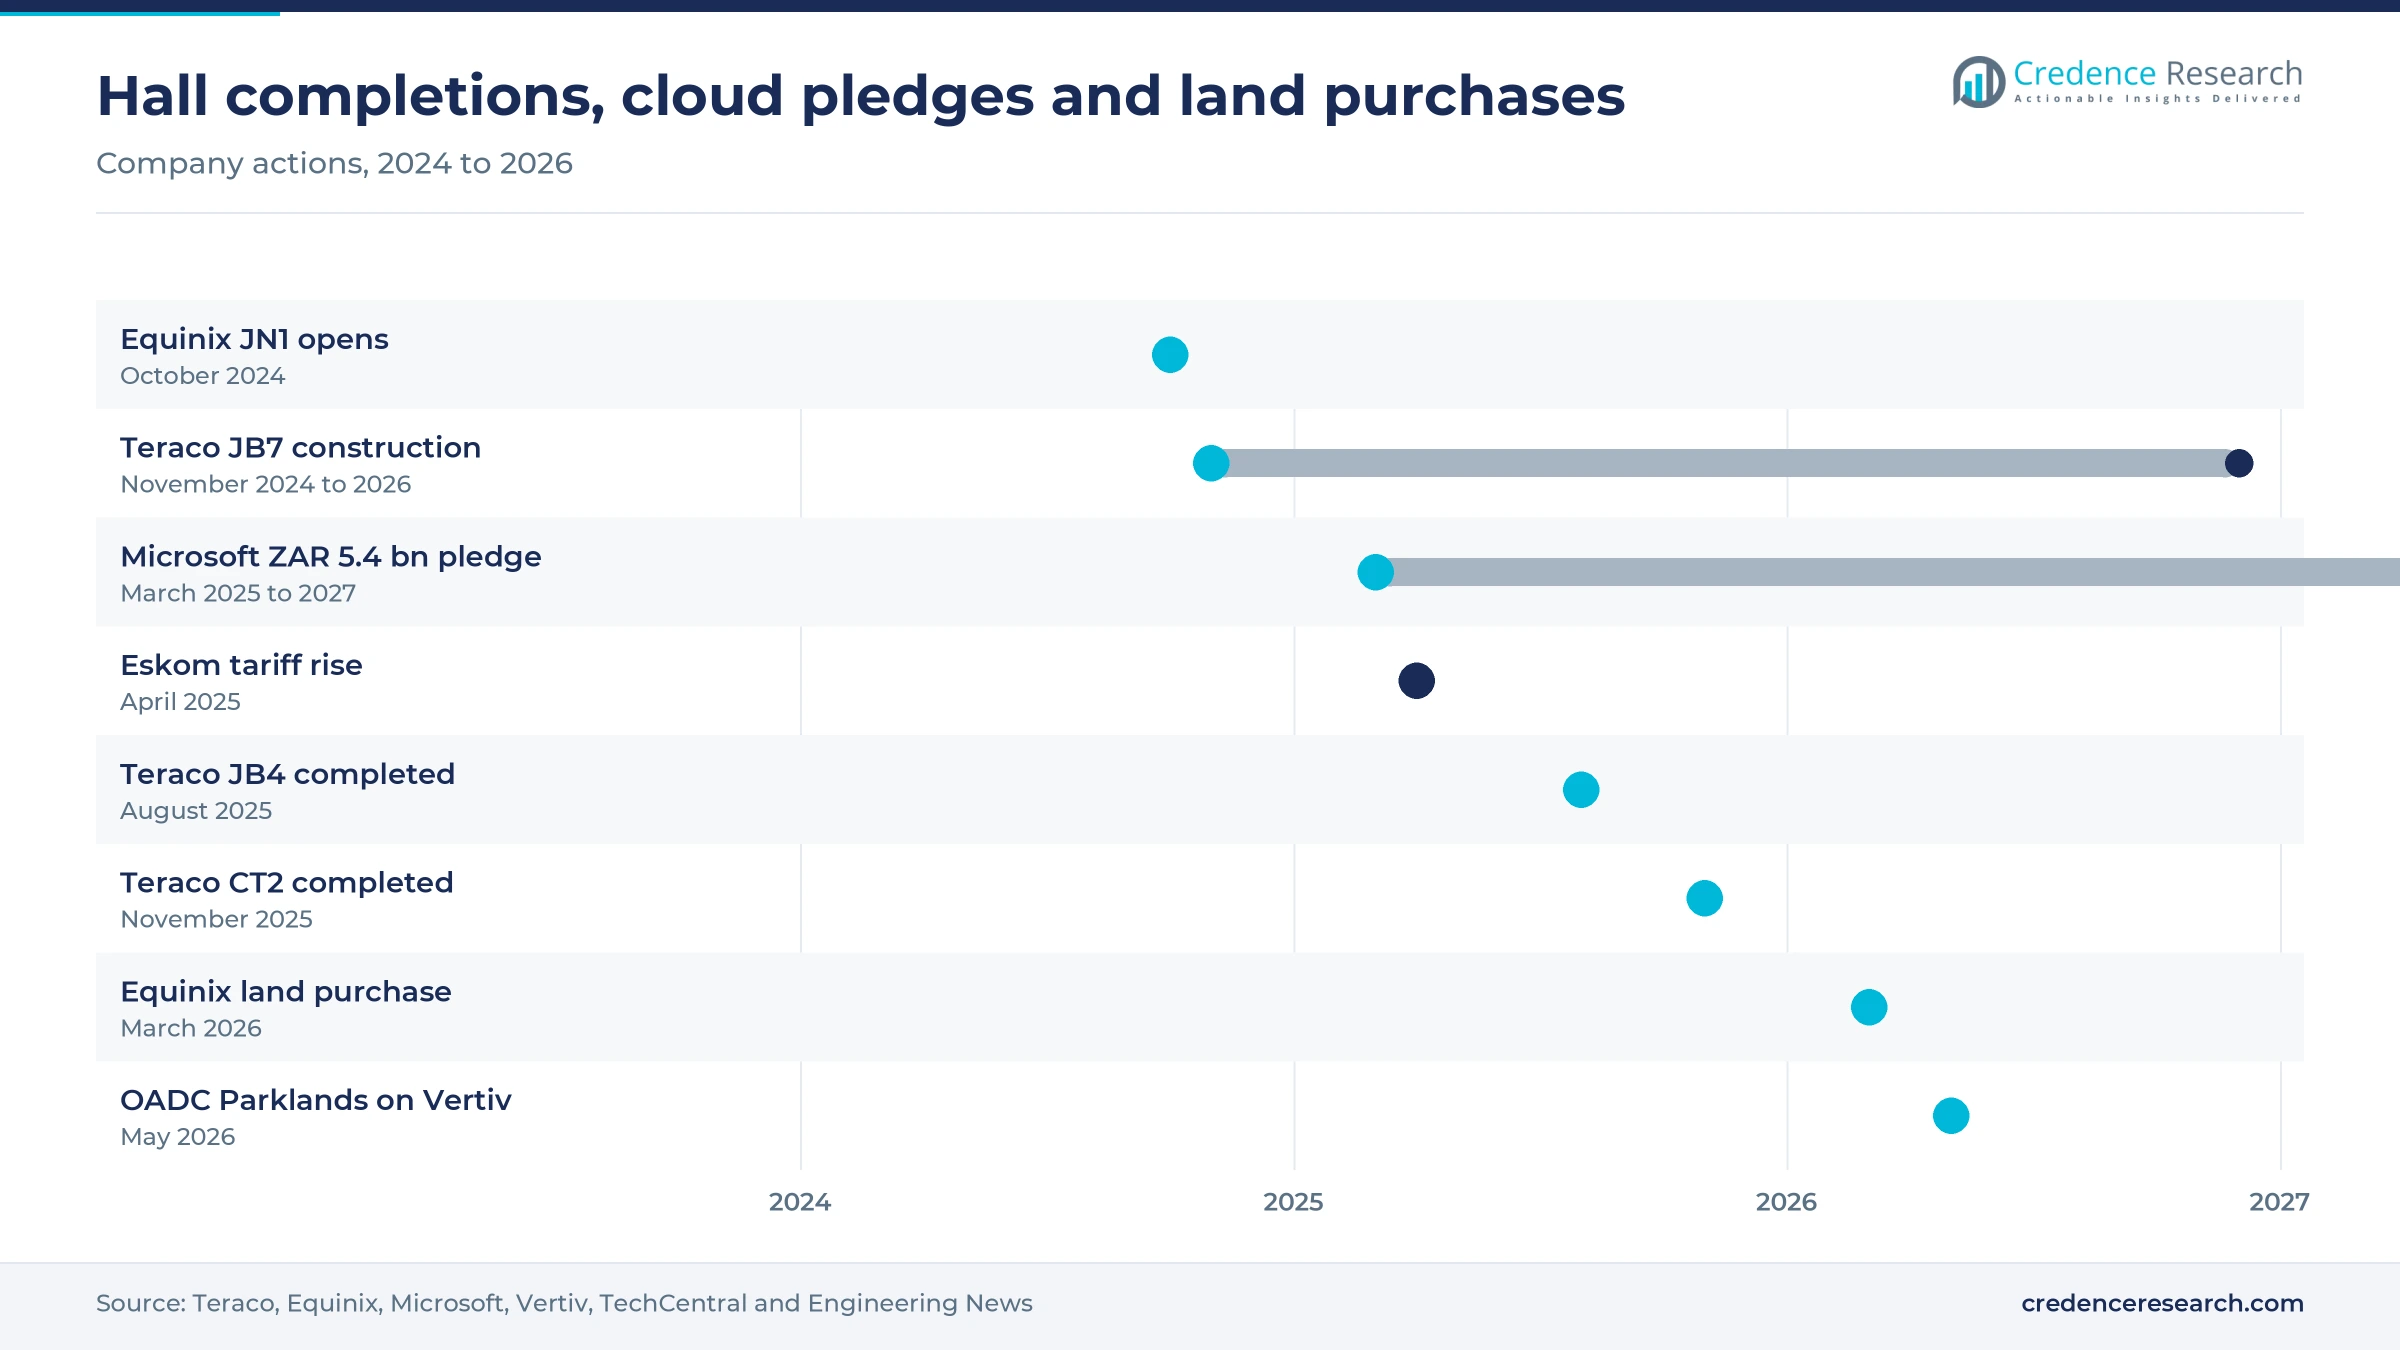
| Development | Status and market relevance |
|---|---|
| In October 2024, Equinix opened JN1, its first South African site, in Johannesburg with 700 cabinets and plans for 3,475 at full build. | Operational launch; initial phase in service, later phases planned. |
| In March 2025, Microsoft committed a further ZAR 5.4 billion to expand cloud and AI infrastructure in South Africa through 2027. | Investment commitment; spending runs to the end of 2027. |
| In August 2025, Teraco completed the JB4 expansion in Ekurhuleni, adding 30 MW across six liquid-cooling-enabled halls. | Completed; halls available for tenant fit-out. |
| In November 2025, Teraco completed the CT2 expansion in Cape Town, adding 32 MW across eight data halls. | Completed; the campus now carries 50 MW of IT load. |
| In May 2026, Open Access Data Centres standardized its Parklands site on Vertiv power, thermal management and containment. | Operational; the IDC 10 hall was recently commissioned and two halls are planned. |
Sealed pods, rear doors and sensor-led airflow control
- Sealed in-row pods enclose a short row with its own cooling units, which lets operators cool 30 kW and denser cabinets without chilling the whole hall.
- Rear-door heat exchangers remove heat at the cabinet door, which Teraco plans for cabinets up to about 55 kW at JB7.
- Sensor-led airflow control adjusts cooling hall by hall from temperature and pressure readings, as Teraco's AI-enabled controls do at JB4 and CT2.
- Hybrid air and liquid layouts combine contained air aisles with liquid cooling loops, so one hall can host cloud racks and GPU servers.
Need a Custom Version of This Report?
Tailor the scope, geography, or segments to your exact requirements.
- Custom geography or segment scope
- Direct access to our analyst team
Global rack makers compete through local integrators
Competition in the South Africa data center containment market splits between global makers and local installers. Schneider Electric sells APC NetShelter aisle containment and modular rooms, while Vertiv supplies containment with power and thermal systems, as at Open Access Data Centres' Parklands site. Rittal South Africa supplied VX IT racks with aisle containment, cooling units and power distribution to a Cape Town data center in August 2023. Huawei FusionModule containment has been deployed at a Northern Cape mine through a local integrator. Datacentrix wins design, site preparation and installation work in enterprise, mine and government rooms, where buyers want one contractor for racks, power and airflow. Buyers judge suppliers on delivery lead times, local installation crews, fire-code compliance and whether containment ships as part of a wider power and cooling package.
How is the supply side organized?
The supply side serving South African buyers runs in three distinct tiers. Global rack and cooling makers, led by Schneider Electric, Vertiv and Rittal, design containment systems and sell them through South African subsidiaries and partners. Modular systems suppliers such as Huawei ship containment inside prefabricated rooms for remote sites. Local integrators and electrical contractors, including Datacentrix, install and maintain systems in enterprise rooms. Entry barriers sit in hyperscale design approvals, fire-code compliance and framework agreements with large operators, and margins are highest in engineered pods for dense racks.
Containment suppliers buyers shortlist in South Africa
| Company | Type | Role in the market |
|---|---|---|
| Schneider Electric | Full-line supplier | Sells APC NetShelter aisle containment, racks and prefabricated modular data center rooms |
| Vertiv | Full-line supplier | Supplies containment with power and cooling at Parklands in Johannesburg |
| Rittal | Rack and enclosure maker | Supplies VX IT racks with aisle containment and cooling units |
| Huawei | Modular systems supplier | Sells FusionModule modular data centers with cold aisle containment |
| Datacentrix | Local integrator | Designs, prepares and installs enterprise data center rooms in South Africa |
Density, not hall count, will set value per megawatt
Credence Research's view is that rack density, not the number of new halls, will decide how much value the market adds by 2035. Hot aisle kits lead today because colocation halls open in standard 5 MW blocks at moderate densities, yet cloud and AI tenants are moving toward 30 to 55 kW cabinets that need sealed pods, rear doors and sensors. Liquid cooling will trim air containment in the densest halls after 2030. Suppliers that pair engineered pods with local installation crews should gain the most share.
Estimates rest on capacity, price and company data
The report uses 2025 as the base year and 2026 to 2035 as the forecast period. The 2025 value brings the earlier Credence Research estimate for 2024 forward at its own growth rate and was checked against installed IT capacity, new hall completions, racks per megawatt and containment prices. Market values come from the Credence Research model, and the regional, containment type, data center type and arrangement splits are Credence Research estimates informed by public data. Sources include International Energy Agency analysis, Eskom tariff notices, Wesgro research, operator and supplier releases, and South African business publishers. No published South Africa containment estimate could be opened, so the 2025 value carries a wider range than the segment splits. No interviews or surveys were used to build these estimates.
Pipeline timing and grid supply shape value to 2035
Credence Research expects containment value to reach USD 56.3 million by 2035 as announced colocation and hyperscale campuses move from land and loans to fitted halls. Wesgro projects installed IT capacity rising from just over 500 MW in 2025 to about 960 MW by 2030. Western Cape should keep the fastest pace, while Gauteng remains the largest source of value. In-row cooling pods grow at 10.8% a year during 2026–2035 as dense racks spread. The main risks are grid connections after 2029 and faster liquid cooling, while enterprise retrofits offer upside.
Grid connections and liquid cooling set the range
The range to 2035 depends mainly on how many announced megawatts reach commissioning and on how quickly AI halls move heat removal into liquid loops. Colocation fit-outs support every case, but grid connections after 2029 decide how many halls open each year. Enterprise retrofits add upside if tariffs keep rising faster than inflation, while a weaker rand would raise imported hardware prices and slow smaller projects in every case.
| Scenario | CAGR, 2026–2035 | Value, 2035 | What has to hold |
|---|---|---|---|
| Downside | 6.2% | USD 43.8 million | Grid constraints delay new halls after 2029 and AI halls adopt liquid loops quickly |
| Base | 9.25% | USD 56.3 million | Teraco, Equinix and Vantage complete announced phases broadly on schedule |
| Upside | 11.2% | USD 66.3 million | Western Cape hyperscale campuses open early and enterprises retrofit rooms at scale |
Frequently Asked Questions
How big is the South Africa data center containment market?
How many data centers operate in South Africa?
Which containment type leads in South Africa?
What does containment cost in South Africa?
Which region leads containment demand?
How do electricity tariffs affect containment demand?
What are the main challenges for containment suppliers?
Who are the main companies in this market?
Table of Content
Chapter 1 Market Segmentation
- 1.1 Segmentation Framework
- 1.1.1 Product and Service Classification
- 1.1.2 Application and End-Use Classification
- 1.1.3 Technology and Solution Classification
- 1.1.4 Customer and Distribution Channel Classification
- 1.1.5 Geographic Segmentation
- 1.1.6 Market Segment Definitions and Boundaries
- 1.2 By Containment Type
- 1.2.1 Hot Aisle Containment
- 1.2.2 Cold Aisle Containment
- 1.2.3 In-Row Cooling Containment
- 1.2.4 Rack-Based Chimney Containment
- 1.3 By Data Center Type
- 1.3.1 Colocation Data Center
- 1.3.2 Hyperscale Data Center
- 1.3.3 Enterprise Data Center
- 1.3.4 Cloud Data Center
- 1.3.5 Others
- 1.4 By Arrangement
- 1.4.1 Modular Containment
- 1.4.2 Rigid Containment
- 1.4.3 Hybrid Containment
- 1.4.4 Others
Chapter 2 Introduction
- 2.1 Report Objectives and Scope
- 2.2 Product Definition and Industry Terminology
- 2.3 Market Inclusions and Exclusions
- 2.4 Research Process
- 2.4.1 Primary Research and Expert Interviews
- 2.4.2 Secondary Research and Source Review
- 2.4.3 Top-Down and Bottom-Up Estimation
- 2.4.4 Data Triangulation and Verification
- 2.5 Market Size Measurement Basis
- 2.5.1 2025: USD 23.2 million → 2035: USD 56.3 million
- 2.6 Historical and Forecast Reference Periods
- 2.6.1 Historical Period: 2018-2025
- 2.6.2 Base Year: 2025
- 2.6.3 Forecast Period: 2025-2035
- 2.7 Research Assumptions and Limitations
Chapter 3 Executive Summary
- 3.1 Market Snapshot and Key Findings
- 3.2 Base-Year Market Size, 2025
- 3.3 Forecast Market Size, 2035
- 3.4 Revenue and Volume Growth Outlook
- 3.5 Key Demand and Supply Indicators
- 3.6 Leading Market Segments
- 3.7 Fastest-Growing Market Opportunities
- 3.8 Regional Performance Highlights
- 3.9 Technology and Industry Transformation
- 3.10 Competitive Landscape Summary
- 3.11 Analyst View and Strategic Implications
Chapter 4 South Africa Data Center Containment Market Trends and Developments
- 4.1 Historical Industry Development, 2018-2025
- 4.2 Recent Market Trends and Developments
- 4.3 Demand and Customer Behavior Trends
- 4.4 Technology and Product Innovation
- 4.5 Artificial Intelligence, Automation and Digitalization
- 4.6 Local Manufacturing and Supply Chain Realignment
- 4.7 Industry Partnerships, Mergers and Acquisitions
- 4.8 Sustainability and Circular Economy Developments
- 4.9 Government and Private Sector Investment Trends
- 4.10 Emerging Business Models and Commercialization
- 4.11 Industry Developments and Announcements
Chapter 5 South Africa Data Center Containment Market Production, Supply and Demand Analysis
- 5.1 Demand Trend and Consumption Analysis, 2018-2025
- 5.2 Demand Forecast, 2025-2035
- 5.3 Production and Output Trend, 2018-2025
- 5.4 Production and Output Forecast, 2025-2035
- 5.5 Installed Capacity and Capacity Utilization
- 5.6 Company-Wise Production Plants and Statistics
- 5.6.1 Installed Production Capacity
- 5.6.2 Actual Production
- 5.6.3 Planned Capacity and Expansion Targets
- 5.7 Supply Chain Structure and Procurement Trends
- 5.8 Supply-Demand Gap and Bottlenecks
- 5.9 Import Dependence and Sourcing Structure
- 5.10 Contract Manufacturing and Outsourcing
- 5.11 Regional Supply and Demand Concentration
Chapter 6 South Africa Data Center Containment Market Pricing Analysis
- 6.1 Pricing Structure and Measurement
- 6.2 Historical Pricing Trends, 2018-2025
- 6.3 Pricing Outlook, 2025-2035
- 6.4 Average Selling Price and Unit Economics
- 6.5 Pricing by Product and Market Segment
- 6.6 Geographic Pricing Differences
- 6.7 Key Input, Energy, Labor and Logistics Costs
- 6.8 Contract Pricing and Purchasing Models
- 6.9 Pricing Sensitivity and Competitive Positioning
- 6.10 Price, Margin and Profitability Implications
Chapter 7 South Africa Data Center Containment Market Dynamics
- 7.1 Market Growth Drivers
- 7.1.1 Demand-Side Drivers
- 7.1.2 Technology and Innovation Drivers
- 7.1.3 Infrastructure and Investment Drivers
- 7.1.4 Regulatory and Policy Drivers
- 7.2 Market Restraints
- 7.2.1 Cost and Affordability Constraints
- 7.2.2 Technology and Adoption Barriers
- 7.2.3 Supply Chain and Operational Constraints
- 7.3 Market Challenges
- 7.3.1 Competitive Pressure and Margin Erosion
- 7.3.2 Skills, Infrastructure and Implementation Gaps
- 7.4 Emerging Market Opportunities
- 7.5 Market Dynamics Impact and Time-Horizon Assessment
Chapter 8 South Africa Data Center Containment Value Chain Analysis
- 8.1 Industry Value Chain Overview
- 8.2 Upstream Suppliers and Critical Inputs
- 8.3 Technology and Component Providers
- 8.4 Manufacturing or Service Delivery
- 8.5 Distribution, Channel Partners and Integrators
- 8.6 Downstream Applications and End Users
- 8.7 Value Addition and Profit Pools
- 8.8 Vertical Integration and Outsourcing
- 8.9 Supplier Concentration and Risk
- 8.10 Supply Chain Localization and Resilience
Chapter 9 South Africa Data Center Containment Market Regulations and Policies
- 9.1 Relevant Laws, Standards and Compliance Frameworks
- 9.2 Product, Service, Safety and Quality Requirements
- 9.3 Government Policies, Incentives and Subsidies
- 9.4 Imports, Exports and Trade Barriers
- 9.5 Public Procurement and Local Content Requirements
- 9.6 Environmental and Sustainability Compliance
- 9.7 Upcoming Policy Changes and Market Implications
Chapter 10 South Africa Data Center Containment Market Hotspots and Opportunities
- 10.1 Market Opportunity Mapping and Growth Hotspots
- 10.2 High-Growth Applications and Customer Groups
- 10.3 Underserved Markets and White-Space Opportunities
- 10.4 Emerging Technology and Product Opportunities
- 10.5 New Capacity and Investment Hotspots
- 10.6 Market Entry and Expansion Opportunities
- 10.7 Distribution and Partnership Opportunities
- 10.8 Near-Term and Long-Term Commercial Potential
- 10.9 Opportunity Attractiveness and Execution Risks
Chapter 11 South Africa Data Center Containment Market Outlook, 2025-2035
- 11.1 Market Size and Analysis
- 11.1.1 Revenue (Market Measurement: 2025: USD 23.2 million → 2035: USD 56.3 million)
- 11.1.2 Market Volume and Quantity Sold
- 11.1.3 Historical Market Size, 2018-2025
- 11.1.4 Base-Year Market Size, 2025
- 11.2 Market Forecast, 2025-2035
- 11.2.1 Revenue Forecast to 2035
- 11.2.2 Volume Forecast to 2035
- 11.2.3 CAGR and Year-on-Year Growth
- 11.2.4 Incremental Revenue Opportunity
- 11.3 Forecast Assumptions and Scenario Analysis
- 11.3.1 Base-Case Forecast
- 11.3.2 Optimistic and Conservative Scenarios
- 11.3.3 Technology, Pricing and Policy Sensitivities
- 11.4 Market Attractiveness and Growth Outlook
Chapter 12 South Africa Data Center Containment Market Segmentation and Outlook
- 12.1 Segmentation Summary and Market Shares, 2025
- 12.2 Largest and Fastest-Growing Segments
- 12.3 By Containment Type - Market Size and Forecast, 2025-2035
- 12.3.1 Segment Definition and Scope
- 12.3.2 Historical Market Size, 2018-2025
- 12.3.3 Revenue Forecast, 2025-2035
- 12.3.4 Volume Forecast, 2025-2035
- 12.3.5 Base-Year Market Share, 2025
- 12.3.6 Segment CAGR and Growth Drivers
- 12.3.7 Subsegment Market Size and Forecast
- 12.3.7.1 Hot Aisle Containment
- 12.3.7.2 Cold Aisle Containment
- 12.3.7.3 In-Row Cooling Containment
- 12.3.7.4 Rack-Based Chimney Containment
- 12.3.8 Subsegment Pricing and Adoption Trends
- 12.3.9 Leading Suppliers and Competition
- 12.3.10 Regional Demand and Opportunities
- 12.4 By Data Center Type - Market Size and Forecast, 2025-2035
- 12.4.1 Segment Definition and Scope
- 12.4.2 Historical Market Size, 2018-2025
- 12.4.3 Revenue Forecast, 2025-2035
- 12.4.4 Volume Forecast, 2025-2035
- 12.4.5 Base-Year Market Share, 2025
- 12.4.6 Segment CAGR and Growth Drivers
- 12.4.7 Subsegment Market Size and Forecast
- 12.4.7.1 Colocation Data Center
- 12.4.7.2 Hyperscale Data Center
- 12.4.7.3 Enterprise Data Center
- 12.4.7.4 Cloud Data Center
- 12.4.7.5 Others
- 12.4.8 Subsegment Pricing and Adoption Trends
- 12.4.9 Leading Suppliers and Competition
- 12.4.10 Regional Demand and Opportunities
- 12.5 By Arrangement - Market Size and Forecast, 2025-2035
- 12.5.1 Segment Definition and Scope
- 12.5.2 Historical Market Size, 2018-2025
- 12.5.3 Revenue Forecast, 2025-2035
- 12.5.4 Volume Forecast, 2025-2035
- 12.5.5 Base-Year Market Share, 2025
- 12.5.6 Segment CAGR and Growth Drivers
- 12.5.7 Subsegment Market Size and Forecast
- 12.5.7.1 Modular Containment
- 12.5.7.2 Rigid Containment
- 12.5.7.3 Hybrid Containment
- 12.5.7.4 Others
- 12.5.8 Subsegment Pricing and Adoption Trends
- 12.5.9 Leading Suppliers and Competition
- 12.5.10 Regional Demand and Opportunities
- 12.6 Segment Growth Comparison
- 12.7 Segment Attractiveness and Priority Matrix
Chapter 13 South Africa Data Center Containment Geographic Market Outlook, 2025-2035
- 13.1 Domestic Market Distribution and Demand Clusters
- 13.2 State- or Province-Wise Market Size and Forecast, 2025-2035
- 13.3 City and Metropolitan Market Outlook
- 13.4 Industrial, Manufacturing and Commercial Clusters
- 13.5 Geographic Concentration of Key End Users
- 13.6 Local Pricing and Purchasing Differences
- 13.7 Domestic Production Facilities and Capacity Map
- 13.8 Local Infrastructure and Project Pipeline
- 13.9 State-Level Policy and Incentive Differences
- 13.10 Subnational Investment Hotspots and Opportunities
- 13.11 Distribution and Logistics Networks
- 13.12 Domestic Competitive Footprint
Chapter 14 South Africa Data Center Containment Technology, Innovation and Sustainability Outlook
- 14.1 Technology Landscape and Maturity
- 14.2 Product, Process and Service Innovation
- 14.3 AI, Automation and Digital Tools in the Industry
- 14.4 Technology Adoption and Performance Benchmarking
- 14.5 Innovation Pipeline and R&D Investment
- 14.6 Patent and Intellectual Property Trends
- 14.7 Energy Efficiency and Resource Management
- 14.8 Sustainability, Recycling and Circularity
- 14.9 Technology Roadmap, 2025-2035
- 14.10 Risks of Obsolescence and Technology Substitution
Chapter 15 South Africa Data Center Containment Market Key Strategic Imperatives
- 15.1 Growth and Market Entry Priorities
- 15.2 High-Return Products and Segments
- 15.3 Pricing, Profitability and Cost Optimization
- 15.4 Technology Investment and Product Differentiation
- 15.5 Supply Chain Localization and Resilience
- 15.6 Distribution and Customer Acquisition
- 15.7 Partnership, Acquisition and Capacity Strategy
- 15.8 Regional Expansion Priorities
- 15.9 Short-, Medium- and Long-Term Actions
Chapter 16 Competition Outlook
- 16.1 Industry Competition Characteristics
- 16.2 Market Structure and Concentration
- 16.3 Market Share and Competitive Positioning, 2025
- 16.4 Company-Wise Revenue and Product Benchmarking
- 16.5 Production and Service Capacity Benchmarking
- 16.6 Technology, Pricing and Differentiation
- 16.7 Regional Footprint and Distribution Strength
- 16.8 Mergers, Acquisitions and Strategic Alliances
- 16.9 New Entrants and Competitive Threats
- 16.10 Porter's Five Forces and Industry Attractiveness
- 16.11 Competitive Outlook, 2025-2035
Chapter 17 Company Profiles
- 17.1 Company Coverage and Selection Criteria
- 17.2 Schneider Electric
- 17.2.1 Business Description
- 17.2.2 Company Ownership and Geographic Presence
- 17.2.3 Product and Service Portfolio
- 17.2.4 Manufacturing and Operating Footprint
- 17.2.5 Production Capacity and Expansion Plans
- 17.2.6 Financial Performance and Investment
- 17.2.7 Market Share and Competitive Position
- 17.2.8 Technology and Innovation Capabilities
- 17.2.9 Strategic Alliances or Partnerships
- 17.2.10 Recent Developments
- 17.2.11 Growth Strategy and Outlook
- 17.3 Vertiv
- 17.4 Rittal
- 17.5 Huawei
- 17.6 Datacentrix
- 17.7 Other Relevant Market Participants
Note: Every listed company is profiled on the structure shown under the first company. The company list is preliminary and may change based on research findings, market developments, data availability and client requirements.
Chapter 18 Disclaimer
- 18.1 Research and Forecast Disclaimer
- 18.2 Data Source and Estimation Limitations
Note: The depth of individual sections depends on data availability for this market. Volume, capacity, trade and other unit-based metrics are included where applicable.

