
Market Overview:
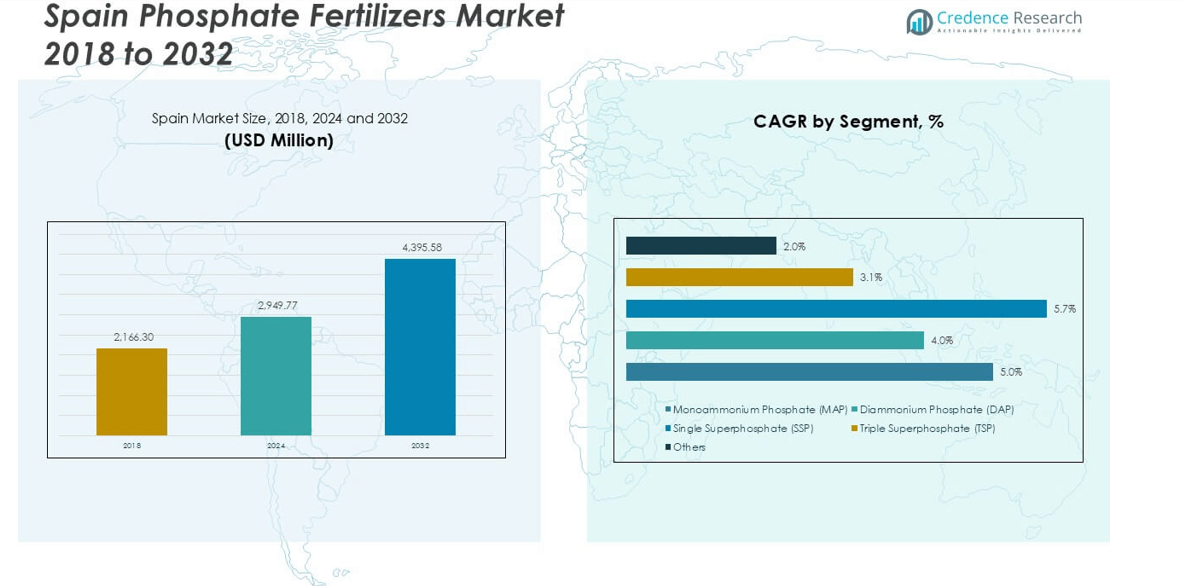
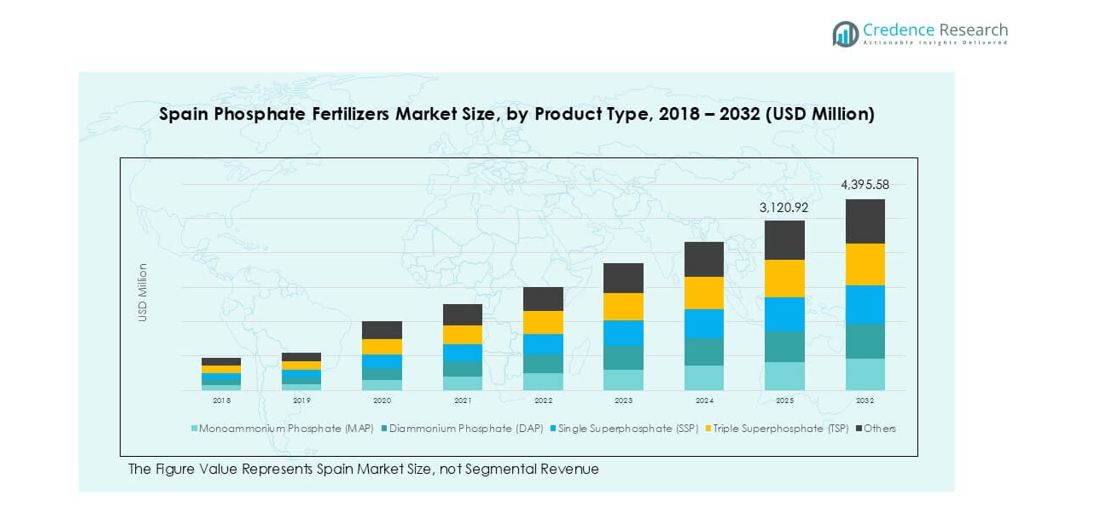
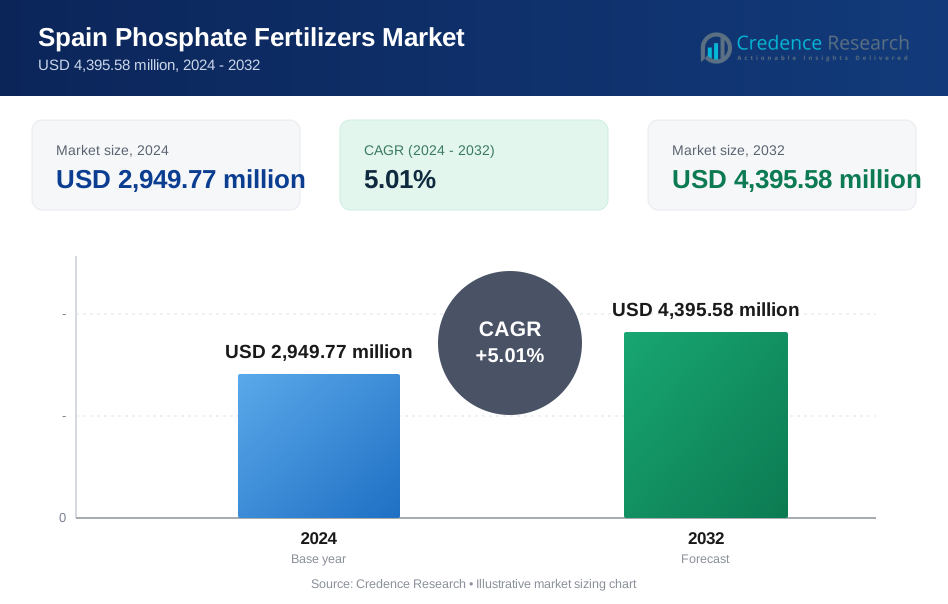
Spain Phosphate Fertilizers market size was valued at USD 2,166.30 million in 2018 and grew to USD 2,949.77 million in 2024. It is anticipated to reach USD 4,395.58 million by 2032, at a CAGR of 5.01% during the forecast period.
| REPORT ATTRIBUTE | DETAILS |
|---|---|
| Historical Period | 2020-2023 |
| Base Year | 2024 |
| Forecast Period | 2025-2032 |
| Spain Phosphate Fertilizers Market Size 2024 | USD 2,949.77 million |
| Spain Phosphate Fertilizers Market, CAGR | 5.01% |
| Spain Phosphate Fertilizers Market Size 2032 | USD 4,395.58 million |
Spain’s phosphate fertilizers market is driven by major players such as Yara International, EuroChem Group, ICL Group Ltd, BASF SE, OCI Nitrogen, Nutrien Ltd., CF Industries Holdings, K+S AG, Helm AG, and COMPO Expert GmbH. These companies dominate supply through high-quality MAP, DAP, and specialty phosphate products, supported by robust distribution networks and agronomic services. The South region leads with 32% market share, driven by extensive olive, citrus, and greenhouse cultivation requiring consistent phosphorus inputs. The East region follows with 24% share, supported by fruit, vegetable, and viticulture production. These regions form the core demand hubs, enabling steady market growth and encouraging suppliers to expand water-soluble and precision farming fertilizer offerings.
Market Insights
- The Spain phosphate fertilizers market was valued at USD 2,949.77 million in 2024 and is projected to reach USD 4,395.58 million by 2032, registering a CAGR of 5.01% during the forecast period.
- Rising demand for cereals, grains, and horticulture crops drives phosphate consumption, with MAP and DAP holding over 60% combined share due to high nutrient efficiency and suitability for varied soils.
- Trends include growing adoption of water-soluble fertilizers for drip irrigation, precision farming practices, and bio-based phosphorus products aligning with EU sustainability policies.
- The market is moderately consolidated with major players like Yara International, EuroChem, BASF SE, Nutrien, and ICL Group expanding specialty phosphate portfolios and strengthening cooperative distribution networks.
- Regionally, the South leads with 32% share, followed by the East with 24%, Central with 18%, North with 16%, and Islands contributing 10%, forming the main demand clusters.
Market Segmentation Analysis:
By Product Type
Monoammonium Phosphate (MAP) leads the Spain phosphate fertilizers market, holding over 35% share in 2024. Its dominance comes from high nutrient concentration and suitability for a variety of soils and crops. Diammonium Phosphate (DAP) follows closely, favored for its high phosphorus and nitrogen content supporting early root development. Single Superphosphate (SSP) and Triple Superphosphate (TSP) maintain steady demand due to affordability and wide use in traditional farming. Growing adoption of precision farming and nutrient-specific fertilization drives demand for MAP and DAP as farmers seek higher yield efficiency.
- For example, Fertiberia's "Impact Zero" fertilizer, made with green hydrogen, was used in a pilot project on maize fields for PepsiCo, paving the way for a major expansion in 2024.
By Application
Cereals & Grains dominate the market, accounting for over 40% share in 2024. Rising production of wheat, barley, and maize in Spain drives strong phosphate demand for improved root strength and yield. Oilseeds form the second-largest segment, benefiting from growing sunflower cultivation and higher demand for edible oils. Fruits & Vegetables show rapid growth, supported by Spain’s large horticulture industry and export potential. Government programs promoting balanced fertilizer use and soil health improvement further boost phosphate use across all segments, ensuring sustained demand growth.
- For instance, in 2023, Spain's wheat harvest was drastically reduced by severe drought, resulting in a production of less than half of the 5.8 million metric tons stated.
Market Overview
Rising Demand for High-Yield Crops
Spain’s growing need for cereals, grains, and horticultural produce fuels phosphate fertilizer use. Farmers adopt high-analysis fertilizers like MAP and DAP to boost soil fertility and achieve higher yields. Government initiatives supporting food security and productivity further accelerate adoption. Rising exports of fruits and vegetables add pressure for consistent, quality harvests. These factors collectively strengthen phosphate demand and ensure sustained market expansion through the forecast period.
- For instance, in 2023, Fertiberia was active in the Castilla y León and Aragón regions through its regional subsidiary and logistics centers. That year, it also partnered with PepsiCo on a pilot program in Spain to provide low-carbon fertilizers for potato and corn crops.
Precision Farming and Soil Health Focus
Adoption of precision agriculture technologies drives targeted phosphate fertilizer application. Spanish farmers increasingly use soil testing, GPS-guided equipment, and smart nutrient management systems to optimize phosphorus usage. This trend minimizes wastage, reduces environmental impact, and enhances yield efficiency. Government programs promoting balanced fertilization practices support this shift, resulting in higher adoption of premium and customized phosphate blends.
- For instance, in 2024, John Deere focused on hardware and software updates for its precision technology. This included the introduction of the new G5Plus CommandCenter displays, which have built-in variable-rate application capabilities.
Supportive Government Policies and Subsidies
Spain benefits from EU Common Agricultural Policy (CAP) incentives promoting sustainable farming and nutrient management. Subsidies for fertilizer purchases and programs encouraging balanced NPK application boost phosphate usage. Policymakers also support initiatives for soil quality improvement and crop diversification, which create demand for phosphorus-rich fertilizers. These measures ensure steady growth in fertilizer consumption, particularly for high-value crops and cereals.
Key Trends & Opportunities
Shift Toward Water-Soluble Fertilizers
Farmers in Spain increasingly adopt water-soluble phosphate fertilizers to meet drip irrigation needs. This trend supports precision dosing and improves nutrient uptake efficiency for high-value crops. Horticultural producers, particularly in greenhouse farming, prefer these products for enhanced solubility and quick absorption. Rising adoption of fertigation practices provides opportunities for fertilizer manufacturers to expand water-soluble product portfolios.
- For instance, in 2023, ICL Specialty Fertilizers likely provided a smaller but significant portion of the total water-soluble fertilizer used in Spanish greenhouses, which covered approximately 49,316 hectares in the main growing regions like Almería.
Grwing Demand for Specialty and Bio-Based Fertilizers
Demand for environmentally friendly phosphate fertilizers is rising as Spain focuses on sustainable agriculture. Specialty products with slow-release formulations or bio-enhanced phosphorus are gaining traction. These solutions improve soil microbial activity and reduce runoff losses, aligning with EU sustainability goals. Market players investing in R&D and launching innovative bio-based phosphate products can capture growing demand among eco-conscious farmers.
- For instance, EuroChem offers various advanced fertilizers, including "enhanced-efficiency fertilizers" (EEFs) like their ENTEC and UTEC products, which are designed to reduce nutrient loss, increase efficiency, and lower the environmental impact of farming.
Key Challenges
Environmental Regulations and Runoff Concerns
Strict EU regulations on nutrient runoff and phosphate pollution create compliance challenges for farmers. Over-application risks penalties and environmental damage, prompting cautious fertilizer use. This limits market growth potential unless solutions offer better nutrient efficiency and low leaching risk. Manufacturers must innovate to provide eco-friendly formulations that meet these regulatory standards.
Volatility in Raw Material Prices
Fluctuating global prices of phosphate rock and related inputs increase production costs for fertilizer suppliers. Import dependence exposes Spain to supply chain risks and price volatility. Rising costs can reduce farmers’ purchasing power and shift demand toward cheaper alternatives, impacting market growth. Long-term supply contracts and local sourcing initiatives are essential to mitigate these risks.
Regional Analysis
South (Andalusia, Murcia, Extremadura)
The South leads phosphate consumption with 32% market share. Large acreage of olives, citrus, and horticulture drives phosphorus demand. Drip irrigation supports soluble MAP and fertigation blends. Greenhouse clusters in Almería intensify application frequency and dosing control. Export-focused fruit growers prioritize consistent nutrient programs. Water-scarce zones favor efficient, water-soluble grades to cut losses. Regional cooperatives negotiate seasonal bulk purchases and logistics.
East (Catalonia, Valencia, Aragon, Balearic)
The East holds 24% market share. High-value fruits, vegetables, and wine grapes require reliable phosphorus supply. Precision farming adoption boosts targeted MAP and DAP usage. Vineyards emphasize root development and early vigor responses. Processing industries prefer predictable quality and certified inputs. Ports enable steady import flow and competitive pricing. Retail networks support small and medium farms with tailored blends.
Central (Castilla-La Mancha, Madrid, Castilla y León)
The Central region accounts for 18% market share. Cereals, sunflower, and legumes create steady baseline demand. Broadacre farms prioritize cost-effective SSP and balanced NPK formulations. Variable soils increase reliance on soil testing and calibrated doses. Larger farm sizes enable planned seasonal procurement. Coop storage smooths supply during peak application windows. Growing oilseed rotations support phosphorus replenishment strategies.
North (Galicia, Asturias, Cantabria, Basque Country, Navarra, La Rioja)
The North represents 16% market share. Mixed farming and dairy systems maintain consistent phosphorus needs. Forage and maize silage programs favor dependable TSP and DAP inputs. Rainfall patterns raise runoff concerns and stewardship practices. Farmers adopt split applications and buffer management. Viticulture in Rioja demands precise early-season phosphorus. Regional guidance encourages balanced nutrient plans. Retailers stock low-leaching, efficiency-focused products.
Market Segmentations:
By Product Type:
- Monoammonium Phosphate (MAP)
- Diammonium Phosphate (DAP)
- Single Superphosphate (SSP)
- Triple Superphosphate (TSP)
- Others
By Application:
- Cereals & Grains
- Oilseeds
- Fruits & Vegetables
- Others
By Geography:
- South (Andalusia, Murcia, Extremadura)
- East (Catalonia, Valencia, Aragon, Balearic)
- Central (Castilla-La Mancha, Madrid, Castilla y León)
- North (Galicia, Asturias, Cantabria, Basque Country, Navarra, La Rioja)
Competitive Landscape
The Spain phosphate fertilizers market is moderately consolidated, with global and regional players competing through product innovation, distribution strength, and pricing strategies. Leading companies such as Yara International, EuroChem Group, ICL Group Ltd, BASF SE, OCI Nitrogen, Nutrien Ltd., CF Industries Holdings, K+S AG, Helm AG, and COMPO Expert GmbH collectively hold a significant market share. These players focus on high-analysis phosphate products like MAP and DAP, supported by efficient logistics and agronomic advisory services. Many companies are expanding their water-soluble and specialty phosphate offerings to serve precision farming and fertigation needs in Spain’s horticulture sector. Strategic partnerships with local cooperatives and distributors help improve market penetration and ensure timely supply during peak application seasons. Continuous R&D investment in eco-friendly and slow-release formulations allows these players to meet strict EU environmental regulations and capture demand from sustainability-focused farmers.
Key Player Analysis
- Yara International
- EuroChem Group
- ICL Group Ltd
- BASF SE
- OCI Nitrogen (OCI NV)
- Nutrien Ltd.
- CF Industries Holdings
- K+S AG
- Helm AG
- COMPO Expert GmbH
Recent Developments
- In December 2023, Yara announced that it is acquiring the organic-based fertilizer business of Agribios, a company in Italy. The acquisition includes a production facility in Ronco all’Adige, focused on sustainable farming solutions through organic-based and organo-mineral fertilizers. This deal aligns with Yara’s strategy to expand its offerings in regenerative agriculture, complementing its current mineral fertilizer portfolio.
- In May 2022, Coromandel International, a fertilizer manufacturer, plans to buy a 45% stake in Baobab Mining and Chemicals Corporation (BMCC), a rock phosphate mining firm based in Senegal Africa, for $19.6 million (approximately $150 crore).
- In May 2022, Indian Potash Ltd signed a five-year agreement with Israel Chemical Ltd to import 0.6-0.65 million tonnes of potash muriate annually.
- In February 2022, EuroChem Group (hereafter referred to as "EuroChem" or "the Group"), a leading global producer of fertilizer, recently announced that it had completed the acquisition of the Serra do Salitre phosphate project in Brazil.
Report Coverage
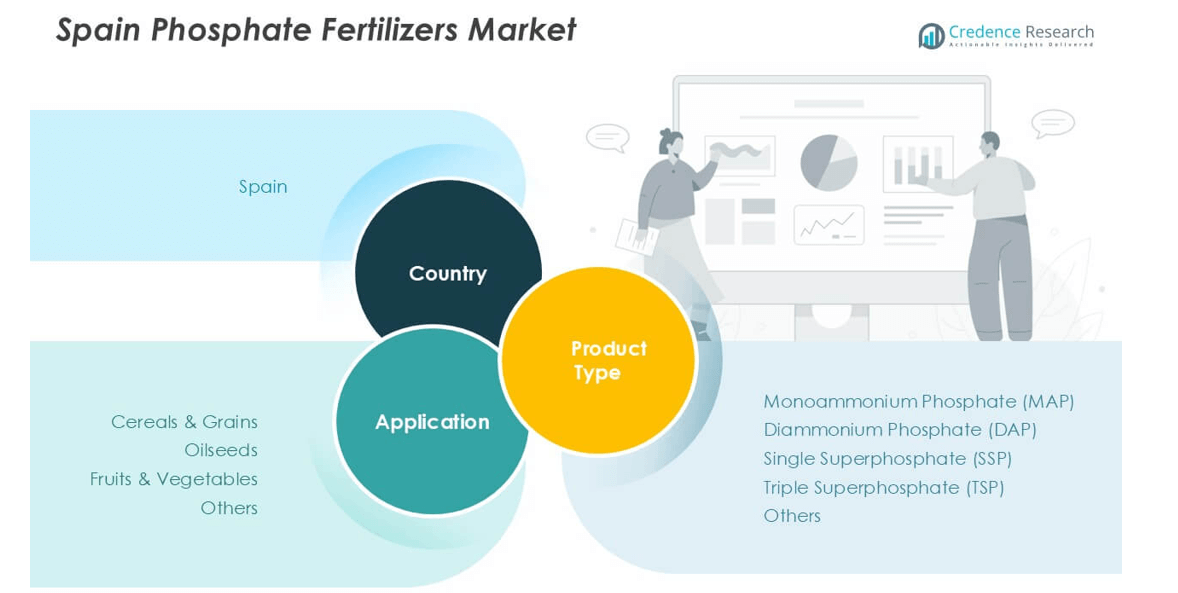
The research report offers an in-depth analysis based on Product Type, Application and Geography. It details leading market players, providing an overview of their business, product offerings, investments, revenue streams, and key applications. Additionally, the report includes insights into the competitive environment, SWOT analysis, current market trends, as well as the primary drivers and constraints. Furthermore, it discusses various factors that have driven market expansion in recent years. The report also explores market dynamics, regulatory scenarios, and technological advancements that are shaping the industry. It assesses the impact of external factors and global economic changes on market growth. Lastly, it provides strategic recommendations for new entrants and established companies to navigate the complexities of the market.
Future Outlook
- Demand for phosphate fertilizers will grow steadily with rising production of cereals and horticultural crops.
- Adoption of precision farming will increase targeted application of MAP, DAP, and water-soluble products.
- Fertigation and drip irrigation systems will drive higher use of soluble phosphate grades in greenhouse farming.
- Specialty and bio-based phosphate fertilizers will gain popularity to meet EU sustainability targets.
- Companies will invest in R&D for slow-release and eco-friendly formulations to reduce nutrient losses.
- Strategic partnerships with cooperatives will expand reach and improve seasonal supply consistency.
- Digital advisory tools will support farmers in optimizing phosphorus application rates.
- Regional demand will stay strongest in the South and East, supported by export-oriented crops.
- Volatility in raw material prices may lead to more localized sourcing and strategic imports.
- Market players will enhance farmer training programs to promote balanced nutrient management practices.
Request a Free Sample
Fill in your details and we'll send you a free sample report.
- Sample data tables & charts
- Research methodology
Need a Custom Version of This Report?
Tailor the scope, geography, or segments to your exact requirements.
- Custom geography or segment scope
- Direct access to our analyst team
Frequently Asked Questions
What is the current market size for Spain Phosphate Fertilizers market, and what is its projected size in 2032?
At what Compound Annual Growth Rate is the Spain Phosphate Fertilizers market projected to grow between 2025 and 2032?
What are the primary factors fueling the growth of the Spain Phosphate Fertilizers market?
Who are the leading companies in the Spain Phosphate Fertilizers market?
Which region commanded the largest share of the Spain Phosphate Fertilizers market in 2024?
Table of Content
Chapter 1. Report Introduction
- 1.1 Report Description & Purpose
- 1.1.1 Report Title & Market Definition
- 1.1.2 Unique Selling Propositions (USP) & Key Differentiators
- 1.1.3 Value Proposition for Stakeholders
- 1.2 Research Objectives
- 1.2.1 Market Sizing Objectives (Volume & Revenue)
- 1.2.2 Segmentation Objectives
- 1.2.3 Competitive Intelligence Objectives
- 1.2.4 Forecast & Scenario Objectives
- 1.3 Report Scope
- 1.3.1 Spain Phosphate Fertilizers Scope – Types & Subtypes Covered
- 1.3.2 Geographic Scope – Regions & Countries Covered
- 1.3.3 Historical Period, Base Year & Forecast Period (2024; forecast to 2032)
- 1.3.4 Inclusions & Exclusions
- 1.4 HS Code & Classification Framework
- 1.5 Currency, Units & Pricing Basis
- 1.6 Target Stakeholders
- 1.7 Limitations & Assumptions
Chapter 2. Executive Summary
- 2.1 Global Spain Phosphate Fertilizers Market Snapshot
- 2.1.1 Market Size – Historical (2024) & Forecast (2024-2032) (2024: USD 2,949.77 million → 2032: USD 4,395.58 million)
- 2.1.2 Volume & Revenue – Global Totals
- 2.1.3 Key Market Highlights – Top Five Facts
- 2.2 Spain Phosphate Fertilizers Market Segmentation Snapshot
- 2.2.1 Market Split by Region – 2024 vs. 2032
- 2.3 Competitive Snapshot
- 2.3.1 Top 10 Players by Revenue Share – 2024
- 2.3.2 Top 10 Players by Volume Share – 2024
- 2.3.3 Recent Strategic Developments (18-Month Summary)
- 2.4 Key Investment Highlights & Strategic Conclusions
Chapter 3. Spain Phosphate Fertilizers Market Dynamics & Industry Analysis
- 3.1 Market Overview & Context
- 3.1.1 Spain Phosphate Fertilizers Market Position in the Broader Automotive Value Chain
- 3.1.2 OEM vs. Replacement Market Dynamics
- 3.1.3 Market Maturity & Development Stage by Region
- 3.2 Spain Phosphate Fertilizers Market Drivers
- 3.3 Spain Phosphate Fertilizers Market Restraints & Challenges
- 3.4 Spain Phosphate Fertilizers Market Opportunities
- 3.5 Porter's Five Forces Analysis
- 3.5.1 Threat of New Entrants
- 3.5.2 Bargaining Power of Suppliers
- 3.5.3 Bargaining Power of Buyers
- 3.5.4 Threat of Substitutes
- 3.5.5 Competitive Rivalry – Intensity Assessment
- 3.6 Spain Phosphate Fertilizers Value Chain Analysis
- 3.6.1 Upstream – Raw Material/Input Suppliers
- 3.6.1.1 Raw Material/Input 1
- 3.6.1.2 Raw Material/Input 2
- 3.6.1.3 Raw Material/Input 3
- 3.6.2 Midstream – Production/Manufacturing/Service Delivery
- 3.6.2.1 Production/Process Overview
- 3.6.2.2 Key Facility Locations & Capacity by Manufacturer
- 3.6.3 Downstream – Distribution & End Consumer
- 3.6.3.1 Primary Channel – B2B/OEM
- 3.6.3.2 Secondary Channels – Dealer, Retail, Online, Direct
- 3.6.4 Value Chain Profitability Analysis
- 3.6.1 Upstream – Raw Material/Input Suppliers
- 3.7 PESTEL Analysis
- 3.7.1 Political Factors
- 3.7.2 Economic Factors
- 3.7.3 Social Factors
- 3.7.4 Technological Factors
- 3.7.5 Environmental Factors
- 3.7.6 Legal Factors
- 3.8 Spain Phosphate Fertilizers Supply Chain Analysis
- 3.8.1 Raw Material/Input Supply Risk Assessment
- 3.8.2 Manufacturing Concentration Risk (Geographic Exposure)
- 3.8.3 Trade Disruption Impact Analysis
- 3.9 Regulatory & Policy Landscape
Note: The regulatory and policy landscape section covers regulations based on their applicability to the market, Spain Phosphate Fertilizers category, geography, and scope of the study. Only regulatory frameworks with a material impact on operations, compliance, trade, sustainability, or market access are analyzed in detail.
Chapter 4. Key Investment Pockets & Opportunity Analysis
- 4.1 Spain Phosphate Fertilizers Market Attractiveness Analysis
- 4.1.1 By Region – Investment Attractiveness Matrix (Volume × CAGR)
- 4.2 Absolute Revenue Growth Opportunity
- 4.2.1 By Region – Absolute USD Growth Through 2032
- 4.3 Incremental Volume Opportunity
- 4.3.1 By Region – Incremental Volume Through 2032
- 4.3.2 Segment – Incremental Volume
- 4.4 Emerging Submarket Opportunity Deep Dive (Subject to Applicability)
- 4.5 Emerging Market Opportunity Scorecards
- 4.5.1 United States
- 4.5.2 Europe
- 4.5.3 Asia
- 4.5.4 Middle East & Africa
Note: Emerging Market Opportunity Scorecards will be included based on relevance and strategic importance. Regions listed are indicative and may vary depending on data availability and market dynamics.
Chapter 5. Spain Phosphate Fertilizers Import-Export Analysis & Trade Flows
- 5.1 Global Trade Overview
- 5.1.1 Global Export Value by Country (2024)
- 5.1.2 Global Export Volume by Country (2024)
- 5.1.3 Global Import Value by Country (2024)
- 5.1.4 Global Import Volume by Country (2024)
- 5.1.5 Net Trade Balance by Country (2024)
- 5.2 Export Analysis – Segment
- 5.2.1 Type 1 (HS Code)
- 5.2.2 Type 2 (HS Code)
- 5.2.3 Type 3 (HS Code)
- 5.2.4 Type 4 (HS Code)
- 5.2.5 Type 5 (HS Code)
- 5.3 Import Analysis – Segment
- 5.3.1 Type 1 (HS Code)
- 5.3.2 Type 2 (HS Code)
- 5.3.3 Type 3 (HS Code)
- 5.3.4 Type 4 (HS Code)
- 5.3.5 Type 5 (HS Code)
- 5.4 Average Unit Trade Prices
- 5.4.1 Average Export Price – Segment & Country
- 5.4.2 Average Import Price – Segment & Source Country
- 5.4.3 Price Trends (2024)
- 5.5 Key Trade Route Analysis
- 5.5.1 Trade Route 1
- 5.5.2 Trade Route 2
- 5.5.3 Trade Route 3
- 5.5.4 Trade Route 4
- 5.5.5 Trade Route 5
- 5.6 Trade Policy Impact Assessment
- 5.6.1 US Anti-Dumping & Section 301 Tariffs
- 5.6.2 EU Customs Union Impact
- 5.6.3 Major Free Trade Agreements
- 5.6.4 USMCA Rules of Origin
Note: Trade policy analysis will be included only where relevant to the Spain Phosphate Fertilizers market.
Chapter 6. Competitive Landscape & Company Benchmarking
- 6.1 Spain Phosphate Fertilizers Market Concentration & Structure
- 6.1.1 Herfindahl-Hirschman Index (HHI) – vs. 2024
- 6.1.2 Tier 1, Tier 2 & Tier 3 Market Structure
- 6.1.3 Global, Regional & Local Player Dynamics
- 6.2 Spain Phosphate Fertilizers Market Share Analysis – 2024
- 6.2.1 Global Revenue Share by Company
- 6.2.2 Global Volume Share by Company
- 6.2.3 Regional Revenue Share
- 6.2.4 Market Share Evolution ( vs. 2024)
- 6.2.5 OEM Segment Share by Company
- 6.2.6 Replacement Segment Share by Company
- 6.3 Production/Delivery Capacity & Facility Analysis
- 6.3.1 Global Installed Capacity
- 6.3.2 Capacity Utilization Rates
- 6.3.3 Production/Output Volume
- 6.3.4 Facility Locations & Capacity Map
- 6.3.5 Planned Capacity Additions
- 6.4 Spain Phosphate Fertilizers Competitive Benchmarking Matrix
- 6.4.1 Revenue, Volume, CAGR & Profitability Comparison
- 6.4.2 Channel Revenue Mix
- 6.4.3 Geographic Revenue Exposure
- 6.4.4 R&D Intensity
- 6.4.5 Sustainability Maturity
- 6.5 Strategic Developments in Spain Phosphate Fertilizers (Last 24 Months)
- 6.5.1 Mergers, Acquisitions & Divestments
- 6.5.2 New Spain Phosphate Fertilizers Launches
- 6.5.3 Facility Expansions
- 6.5.4 Strategic Alliances, Joint Ventures & Partnerships
- 6.5.5 Distribution Expansion & Market Entry
- 6.5.6 Sustainability & ESG Initiatives
- 6.6 Competitive Strategy Mapping
- 6.6.1 Leader, Challenger, Follower & Niche Classification
- 6.6.2 Pricing Strategy Comparison
- 6.6.3 Channel Strategy Matrix
Note: Strategic developments are included based on their materiality and the availability of reliable information.
Chapter 7. Global Spain Phosphate Fertilizers Market – By Distribution Channel
- 7.1 Segment Overview
- 7.1.1 Volume & Revenue Split by Channel (2024 & 2032)
- 7.1.2 Channel Mix Evolution (2024-2032)
Chapter 8. Regional Market Analysis – Global Overview
- 8.1 Global Regional Overview
- 8.1.1 Regional Volume Share
- 8.1.2 Regional Revenue Share
- 8.1.3 Regional Volume by Region
- 8.1.4 Regional Revenue by Region
- 8.1.5 Regional Forecast Through 2032
- 8.2 Cross-Regional Segment Analysis
- 8.2.1 By Distribution Channel
- 8.2.2 By Brand/Price Tier
Chapter 9. North America Spain Phosphate Fertilizers Market
- 9.1 United States
- 9.2 Canada
- 9.3 Mexico
Chapter 10. Europe Spain Phosphate Fertilizers Market
- 10.1 Germany
- 10.2 France
- 10.3 Italy
- 10.4 United Kingdom
- 10.5 Spain
- 10.6 Poland
- 10.7 Russia
- 10.8 Netherlands
- 10.9 Belgium
- 10.10 Sweden
- 10.11 Denmark
- 10.12 Norway
- 10.13 Rest of Europe
Chapter 11. Asia Pacific Spain Phosphate Fertilizers Market
- 11.1 China
- 11.2 India
- 11.3 Japan
- 11.4 South Korea
- 11.5 Thailand
- 11.6 Indonesia
- 11.7 Vietnam
- 11.8 Malaysia
- 11.9 Australia
- 11.10 Rest of Asia Pacific
Chapter 12. Latin America Spain Phosphate Fertilizers Market
- 12.1 Brazil
- 12.2 Argentina
- 12.3 Colombia
- 12.4 Chile
- 12.5 Rest of Latin America
Chapter 13. Middle East Spain Phosphate Fertilizers Market
- 13.1 Saudi Arabia
- 13.2 United Arab Emirates
- 13.3 Turkey
- 13.4 Israel
- 13.5 Iran
- 13.6 Rest of the Middle East
Chapter 14. Africa Spain Phosphate Fertilizers Market
- 14.1 South Africa
- 14.2 Egypt
- 14.3 Nigeria
- 14.4 Morocco
- 14.5 Rest of Africa
Chapter 15. Spain Phosphate Fertilizers Company Profiles
- 15.1 [Company 01]
- 15.1.1 Company Overview
- 15.1.2 Key Management Personnel
- 15.1.3 Products & Services Portfolio
- 15.1.4 Financial Performance
- 15.1.5 Key Market Focus & Geographic Presence
- 15.1.6 Recent Developments & Strategic Initiatives
Note: The company profile list is preliminary and may change based on research findings, market developments, data availability, and client requirements.
Chapter 16. Appendices
- Appendix A – List of Abbreviations & Acronyms
- Appendix B – Industry Classification Code Reference – Full Series
- Appendix C – Production & Capacity Data Tables
- Appendix D – End-Use & Demand Base Tables
- Appendix E – Consumption & Replacement Rate Assumptions
- Appendix F – ASP Reference Tables
- Appendix G – Manufacturing & Facility Database
- Appendix H – Import-Export Data Tables
- Appendix I – Regulatory Summary Tables
- Appendix J – Primary Research Participant List (Anonymized)
- Appendix K – Primary Research Questionnaire Framework
- Appendix L – Data Sources & Bibliography
- Appendix M – Market Size Divergence & Source Comparison
Chapter 17. Research Methodology
- 17.1 Research Framework & Philosophy
- 17.2 Secondary Research – Sources, Hierarchy & Data Extraction
- 17.3 Data Modeling – Bottom-Up & Top-Down Market Sizing
- 17.4 Primary Research – Stakeholder Framework, LOI & Sample Sizes
- 17.5 Forecast Methodology – Regression, Scenario & Sensitivity Analysis
- 17.6 Quality Control – Four-Layer Validation Framework
- 17.7 Limitations & Standard Assumptions
- 17.8 Disclaimer
